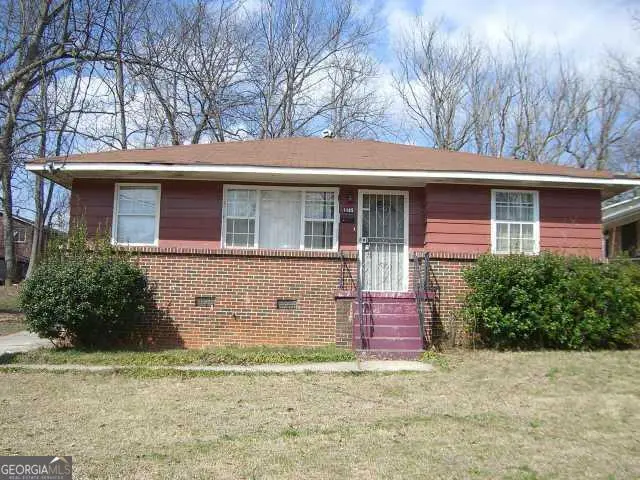
1165 Mobile St NW · Atlanta, GA
Flood risk 1/10 · Minimal
- FEMA flood zone
- X (unshaded)
- Chance of flooding over 30 yrs
- 0.0%
- Est. flood insurance / yr
- $473 – $860
Fire risk 1/10 · Minimal
- Est. fire insurance / yr
- $963 – $1,789
Heat risk 5/10 · Moderate
- Hot days now (above 103°F)
- 7 days/yr
- Hot days in 30 yrs
- 18 days/yr
Wind risk 6/10 · Moderate
- Chance of severe wind over 30 yrs
- 27.0%
Air-quality risk 4/10 · Minor
- Unhealthy air days now
- 5 days/yr
- Unhealthy air days in 30 yrs
- 7 days/yr
Risk factors via First Street. Map © Google.
Why this score? — see what drove the D grade
The composite is a weighted blend of 9 inputs, each scored 0–100. Each bar is that input's sub-score; the figure is the points it added to the 100-point composite (weight × sub-score).
- Cash flow +14.2/30.0
- ARV discount +5.0/15.0
- DSCR +4.3/10.0
- Livability +4.2/5.0
- 1% rule +4.1/10.0
- Rent growth +3.1/5.0
- Schools +2.7/10.0
- Condition / age +2.5/5.0
- Appreciation +0.0/10.0
$190,000
🖨 Deal sheet (PDF) 📄 Offer letter ✓ Due diligence
Listing remarks MLS
GREAT OPPORTUNITY. SPACIOUS 3 BEDROOM HOME, 1 FULL BATH. CLOSE TO PUBLIC TRANSPORTATION.
Key facts
- 7,492 sq ft lot
- Built 1955
- Listed 27 days
Property features AI
Finance
- Other: Located in Hunter Terrace subdivision; GPS friendly directions
- HOA & community: No HOA
Exterior
- Parking: Carport; Parking pad; Open parking available
- Utilities: Public water; Public sewer; Electricity available; Natural gas available; High speed internet available; Cable available
- Home design: Single family residence; House; Built in 1955; One story
- Construction: Brick and other construction materials; Composition roof; Owner-reported building area 1060
- Exterior features: City lot
Interior
- Kitchen: Appliances: Other
- Bedrooms: 3 bedrooms on the main level
- Flooring: Other flooring
- Bathrooms: 2 full bathrooms on the main level
- Heating & cooling: Central heating; Ceiling fan(s) for cooling
- Interior features: One-level layout; Owner-reported living area 1060; Fixer condition
- Laundry & utility: Laundry features: Other
Neighborhood map
What this means for you Summary
Snapshot
- This is a 3-bed/1.0-bath single-family listed at $190k.
Deal economics
- At list price, monthly cash flow is $32 ($384/yr) — positive.
- The deal already cash-flows at list — no discount required.
- To meet the 1% rule (rent ≥ 1% of price), the offer needs to be $172k (9.4% below list).
- Recommended offer: $172k (9.4% below list) — sets the bar for 1% rule.
- Cap rate 6.5% vs local median 3.1% in Atlanta — top-decile yield for the area; either an underpriced asset or a hidden risk that comps aren't pricing in. Stress-test before assuming the spread holds.
Location & tenants
- Location reads 83/100 on livability (#6 in GA, #919 nationally) — a professional / high-income tenant draw. Strengths: amenities A+, commute A+, housing A+; Watch: cost of living C-.
- Atlanta Public Schools (urban): math 28% / reading 35% proficiency, ranked #80 of 174 in GA (top 46%) — families likely to look elsewhere, expect single-tenant / working-renter base with shorter leases; 71% free/reduced lunch — lower-income household profile, screen leases tightly.
- Zoned schools: Kipp Ways Primary Charter School (math 5% / reading 5%, grade F, #1,160 of 1,228 statewide, top 98%, 477 students, 100% FRL, charter); Herman J. Russell West End Academy (math 12% / reading 12%, grade F, #417 of 470 statewide, top 90%, 399 students, 100% FRL); Booker T. Washington High School (math 24% / reading 24%, grade F, #184 of 424 statewide, top 48%, 831 students, 100% FRL) — zoned schools average 100% FRL vs 71% district-wide (29 pts higher); higher-poverty schools than district average — tighter screening recommended.
- Zoned-school proficiency averages 14% at this address vs 32% district-wide (-18 pts) — the specific schools serving this property underperform the Atlanta Public Schools average; the district grade overstates school quality for this exact location.
- Market conditions: Rents rising (+2.5%/yr); 293 active listings in the ZIP; 40 comparable units currently listed for rent nearby; rentals at typical pace (median 26d on market — plan ~3-4 weeks tenant-placement turnaround); lower-income renter base — watch delinquency; 11,565 units permitted in Fulton County in 2024 (8,159 in 5+ unit buildings).
Forward outlook
- Local home prices are declining (-3.0%/yr); year-one equity from $1k of loan paydown is wiped out by about $6k of value loss. Plan a longer hold.
- Fulton County population projected at +38% by 2050 — long-run rental-demand tailwind backs the buy-and-hold thesis.
Negotiation context
- It's been on market 27 days — a 2% lower offer ($187k) is reasonable based on typical stale-listing flexibility.
- 4 sale attempts since 18y ago with the ask held roughly flat each time — persistent listings suggest the price (not the market) is what's stuck; bring a comps-based counter.
- Current owner paid $60k; list at $190k implies a 219% gain — meaningful room to come down on a strong offer.
Risks & watch-outs
- Watch-outs: built in 1955 — expect roof / HVAC / electrical / plumbing capex.
- Climate carrying-cost: major wind risk, 27% chance of damaging wind over 30y; extreme-heat days projected 7→18/yr by 2055 (HVAC capex compounding) — expect insurance premiums to compound above CPI over the hold.
Questions for the listing agent
- Built in 1955 — when were the roof, HVAC, electrical panel, plumbing, and water heater last replaced?
- Is there a deadline driving the sale (1031 exchange, divorce, estate, relocation)? That informs how much negotiation room exists.
- The area grade is low — what's the realistic commute time and amenity access for the typical tenant pool here? Any planned neighborhood developments (good or bad) we should know about?
- What's the average days-on-market for RENTAL listings here right now (not sales)? A rising rental-DOM trend means longer vacancies and softer asking-rent achievability than the comps imply.
- What's the recent tenant-quality profile in this submarket — average credit score on applications, eviction rate, late-payment / NSF rate, and stable-employment percentage? A property-management company in the area should have these aggregated.
- How much new for-sale + rental construction is in the pipeline within 1–3 miles? Heavy new supply typically softens prices + rents 12–24 months out; constrained supply supports both.
Investment metrics
- 1% rule
- 0.91% ✗
- Cap rate
- 6.49%
- Cash-on-cash
- 0.72%
- DSCR
- 1.03
- GRM
- 9.2
CMA / ARV
- ARV (on-the-fly)
- $179,908
- Comps found
- 12
Show comp detail 12 sales within ~0.75 mi
| Address | Dist | Beds/Ba | Sqft | Sold | Price | $/sf | Match |
|---|---|---|---|---|---|---|---|
| 255 Stafford St NW | 0.06mi | 2/2.0 (-1) | 1,088 (-1%) | 10mo | $112,000 | $103 | 78 |
| 227 Chappell Rd NW | 0.45mi | 3/1.0 | 1,097 (0%) | 1mo | $185,000 | $169 | 78 |
| 259 Stafford St NW | 0.08mi | 3/1.5 | 1,027 (-6%) | 9mo | $56,000 | $55 | 77 |
| 1131 Harwell St NW | 0.47mi | 3/2.0 | 1,136 (+4%) | 3mo | $300,000 | $264 | 66 |
| 1189 Gardenia St NW | 0.46mi | 3/2.0 | 1,156 (+5%) | 1mo | $340,000 | $294 | 64 |
| 973 Neal St NW | 0.46mi | 3/2.0 | 1,082 (-1%) | 11mo | $210,000 | $194 | 63 |
| 6 Rockmart Dr SW | 0.58mi | 4/2.0 (+1) | 1,118 (+2%) | 8mo | $140,000 | $125 | 54 |
| 70 Rockmart Dr NW | 0.47mi | 3/1.5 | 1,204 (+10%) | 9mo | $175,000 | $145 | 52 |
| 1342 North Ave NW | 0.49mi | 4/2.0 (+1) | 1,004 (-8%) | 3mo | $165,000 | $164 | 52 |
| 1400 North Ave NW | 0.56mi | 3/2.0 | 1,228 (+12%) | 6mo | $270,000 | $220 | 44 |
| 845 Cameron M Alexander Blvd NW | 0.72mi | 3/1.0 | 988 (-10%) | 10mo | $135,000 | $137 | 42 |
| 228 James P Brawley Dr | 0.74mi | 3/2.0 | 1,232 (+12%) | 8mo | $165,000 | $134 | 34 |
Match score weights: distance 35% · size 25% · config 20% · recency 20%. Top-matched comps best support the ARV.
Projected returns pro-forma
-3.0% appreciation · 2.53% rent growth · sell at horizon
- IRR
- -15.7%
- Equity multiple
- 0.44×
- Total profit
- $-29,527
- Equity at exit
- $28,330
- IRR
- -8.0%
- Equity multiple
- 0.51×
- Total profit
- $-26,241
- Equity at exit
- $16,428
Cash invested: $53,200 (down + closing). Projections, not guarantees.
Landlord ↔ Tenant lean methodology
- Overall (STATE)
- 90 Strongly Landlord-Friendly
- State Georgia
- 90 Strongly Landlord-Friendly · R+3
- County
- — inherits STATE
- City
- — inherits STATE
ZIP-level market 30314
- Home prices YoY
- -22.9%
- Rents YoY
- 2.5%
- Active inventory
- 293
- Price-to-rent
- 9.2×
Monthly cashflow live
- Estimated rent
- $1,722 high interval (Pro) →
- Mortgage (P&I)
- −$996
- Tax from tax record
- −$253 /mo · $3,032/yr
- Insurance
- −$79
- HOA
- −$0
- Vacancy / Maint / Mgmt
- −$362
- Net cashflow
- $32
Break-even live
Sensitivity live
| Price | -10% $140 | -5% $86 | +0% $32 | +5% $-22 | +10% $-76 |
|---|---|---|---|---|---|
| Rent | -10% $-104 | -5% $-36 | +0% $32 | +5% $100 | +10% $168 |
| Rate | -1.0pp $128 | -0.5pp $80 | base $32 | +0.5pp $-17 | +1.0pp $-67 |
UW: 25.0% down · 7.5% · 30yr · 1.5% tax · 5.0% vac · 8.0% maint · 8.0% mgmt
Financing live
Cash to close
- Down payment
- $47,500
- Closing costs
- $5,700
- Reserves months
- —
- Total cash needed
- —
Loan-product check · same deal, 3 products live
Conventional
25% down · 7.5% · 30yr
- Down + closing
- —
- Monthly P&I
- —
- Monthly cashflow
- —
- DSCR
- —
- Eligible?
- —
Personal DTI + credit; lowest rate.
DSCR
20% down · 8.5% · 30yr
- Down + closing
- —
- Monthly P&I
- —
- Monthly cashflow
- —
- DSCR
- —
- Eligible?
- —
No personal income docs; deal must DSCR.
Hard money
10% down · 12.0% · 12mo
- Down + closing
- —
- Monthly P&I
- —
- Monthly cashflow
- —
- DSCR
- —
- Eligible?
- —
Short-term bridge; refi at stabilization.
Rent comps 40 comps
| Address | Beds | Baths | Sqft | Rent | $/sqft | DOM | Units | Dist |
|---|---|---|---|---|---|---|---|---|
| 245 Stafford St NW Unit A Atlanta, GA | 2.0 | 1.0 | 784 | $1,300 | $1.66 | 26d | 1 | 0.11mi |
| 1005 Westmoor Dr NW Unit A Atlanta, GA | 4.0 | 2.0 | 1348 | $1,695 | $1.26 | 26d | 1 | 0.38mi |
| 120 Burbank Dr NW Atlanta, GA | 3.0 | 2.0 | 1331 | $1,795 | $1.35 | 26d | 1 | 0.38mi |
| 1332 Akridge St NW Atlanta, GA | 3.0 | 2.0 | 1400 | $1,775 | $1.27 | 26d | 1 | 0.47mi |
| 272 Joseph E Lowery Blvd NW Atlanta, GA | 3.0 | 1.0 | 1230 | $1,800 | $1.46 | 26d | 1 | 0.48mi |
| 1448 Rome Dr NW Unit 1448 Atlanta, GA | 3.0 | 2.5 | 1400 | $2,300 | $1.64 | 14d | 1 | 0.54mi |
| 891 Rock St NW Atlanta, GA | 2.0–3.0 | 2.0 | 1104 | $1,491 | $1.35 | 26d | 4 | 0.54mi |
| 936 Mayson Turner Rd NW Atlanta, GA | 3.0 | 1.0–2.0 | 648 | $1,377 | $2.12 | 0d | 13 | 0.56mi |
| 5 Burbank Dr SW Unit B Atlanta, GA | 2.0 | 1.0 | 1000 | $1,300 | $1.30 | 18d | 1 | 0.59mi |
| 15 Burbank Dr SW Unit 3 Atlanta, GA | 2.0 | 1.0 | 900 | $1,350 | $1.50 | 12d | 1 | 0.61mi |
| 1338 Sharon St NW Atlanta, GA | 2.0 | 1.0 | 800 | $1,600 | $2.00 | 21d | 1 | 0.66mi |
| 1336 Sharon St NW Atlanta, GA | 2.0 | 1.0 | 800 | $1,450 | $1.81 | 26d | 1 | 0.66mi |
| 557 Chappell Rd NW Atlanta, GA | 3.0 | 2.0 | 1264 | $1,850 | $1.46 | 7d | 1 | 0.68mi |
| 399 Holly St NW Unit 6 Atlanta, GA | 2.0 | 1.0 | 775 | $1,500 | $1.94 | 20d | 1 | 0.68mi |
| 564 Joseph E. Lowery Blvd NW Unit 3 Atlanta, GA | 2.0 | 1.0 | 980 | $1,100 | $1.12 | 26d | 1 | 0.69mi |
| 564 Joseph E Lowery Blvd NW Atlanta, GA | 2.0 | 1.0 | 980 | $1,100 | $1.12 | 26d | 1 | 0.69mi |
| 280 Holly Rd NW Unit B Atlanta, GA | 2.0 | 2.0 | 1100 | $1,650 | $1.50 | 26d | 1 | 0.69mi |
| 427 Holly St NW Atlanta, GA | 2.0 | 2.0 | 900 | $2,100 | $2.33 | 26d | 1 | 0.70mi |
| 870 Mayson Turner Rd NW #1442 Atlanta, GA | 2.0 | 2.0 | 1094 | $2,100 | $1.92 | 26d | 1 | 0.71mi |
| 590 Joseph E Lowery Blvd NW Atlanta, GA | 2.0 | 1.0 | 980 | $1,100 | $1.12 | 26d | 1 | 0.72mi |
| 60 Paschal Blvd NW Atlanta, GA | 1.0–3.0 | 1.0–2.5 | 945 | $1,625 | $1.72 | 26d | 25 | 0.79mi |
| 371 Lanier St NW #1 Atlanta, GA | 2.0 | 1.0 | 700 | $1,250 | $1.79 | 9d | 1 | 0.79mi |
| 882 Fox St NW Atlanta, GA | 2.0 | 1.0 | 980 | $1,350 | $1.38 | 26d | 1 | 0.83mi |
| 884 T P Burruss SR Dr SW Atlanta, GA | 3.0 | 2.0 | 1366 | $2,299 | $1.68 | 26d | 1 | 0.83mi |
| 1595 Carlisle St NW Unit 1 Atlanta, GA | 2.0 | 1.0 | 900 | $1,200 | $1.33 | 26d | 1 | 0.84mi |
| 139 Lawton St SW Atlanta, GA | 2.0 | 1.0 | 750 | $995 | $1.33 | 26d | 1 | 0.85mi |
| 155 Rosser St SW Atlanta, GA | 3.0 | 2.0 | 1500 | $2,073 | $1.38 | 26d | 1 | 0.86mi |
| 945 Palmetto Ave SW Atlanta, GA | 3.0 | 2.0 | 1200 | $3,500 | $2.92 | 26d | 1 | 0.87mi |
| 865 Fox St NW Atlanta, GA | 2.0 | 1.0 | 980 | $1,200 | $1.22 | 26d | 1 | 0.88mi |
| 481 Griffin St NW Atlanta, GA | 2.0 | 2.0 | 1080 | $2,000 | $1.85 | 18d | 1 | 0.92mi |
| 954 Parsons St SW Atlanta, GA | 4.0 | 3.5 | 1376 | $2,800 | $2.03 | 24d | 1 | 0.93mi |
| 679 Jones Ave NW Atlanta, GA | 3.0 | 2.0 | 1350 | $2,195 | $1.63 | 26d | 1 | 0.94mi |
| 636 Francis Pl NW Unit A Atlanta, GA | 2.0 | 2.0 | 1380 | $1,800 | $1.30 | 26d | 1 | 0.95mi |
| 20 Griffin St NW Unit 1 Atlanta, GA | 2.0 | 1.0 | 800 | $1,250 | $1.56 | 26d | 1 | 0.95mi |
| 75 Griffin St NW Atlanta, GA | 2.0 | 1.0 | 1000 | $1,600 | $1.60 | 26d | 1 | 0.95mi |
| 390 W Lake Ave NW Unit B9 Atlanta, GA | 2.0 | 1.5 | 1256 | $1,275 | $1.02 | 26d | 1 | 0.98mi |
| 390 W Lake Ave NW Unit A10 Atlanta, GA | 3.0 | 1.5 | 1256 | $1,275 | $1.02 | 26d | 1 | 0.98mi |
| 390 W Lake Ave NW Apt A1 Atlanta, GA | 3.0 | 1.5 | 1256 | $1,299 | $1.03 | 26d | 1 | 0.98mi |
| 403 Elm St NW Atlanta, GA | 3.0 | 1.0 | 874 | $1,700 | $1.95 | 26d | 1 | 1.02mi |
| 195 W Lake Ave NW Unit 1 Atlanta, GA | 3.0 | 2.0 | 1245 | $2,654 | $2.13 | 26d | 1 | 1.03mi |
Listing history 38 events
-
2026-06-21days on market $190,000 Active 27 DOM
-
2026-06-18days on market $190,000 Active 24 DOM
-
2026-06-17days on market $190,000 Active 23 DOM
-
2026-06-16days on market $190,000 Active 22 DOM
-
2026-06-15days on market $190,000 Active 21 DOM
-
2026-06-13days on market $190,000 Active 19 DOM
-
2026-06-13days on market $190,000 Active 18 DOM
-
2026-06-09days on market $190,000 Active 15 DOM
-
2026-06-08statusdays on market $190,000 Active 14 DOM
-
2026-06-07days on market $190,000 New 13 DOM
-
2026-06-04days on market $190,000 New 10 DOM
-
2026-06-03days on market $190,000 New 9 DOM
-
2026-06-02days on market $190,000 New 8 DOM
-
2026-06-01days on market $190,000 New 7 DOM
-
2026-05-31days on market $190,000 New 6 DOM
-
2026-05-25$190,000 New
-
2018-05-01soldstatus $59,500
-
2015-06-01historical
-
2015-03-09price $30,000
-
2015-02-06$35,999 New
-
2011-08-09soldstatus $12,500 Sold 89-char remark
Show marketing remark (89 chars)
GREAT OPPORTUNITY. SPACIOUS 3 BEDROOM HOME, 1 FULL BATH. CLOSE TO PUBLIC TRANSPORTATION.
-
2011-07-31historical 89-char remark
Show marketing remark (89 chars)
GREAT OPPORTUNITY. SPACIOUS 3 BEDROOM HOME, 1 FULL BATH. CLOSE TO PUBLIC TRANSPORTATION.
-
2011-06-11price $11,900
-
2011-06-10price $11,900 89-char remark
Show marketing remark (89 chars)
GREAT OPPORTUNITY. SPACIOUS 3 BEDROOM HOME, 1 FULL BATH. CLOSE TO PUBLIC TRANSPORTATION.
-
2011-05-07price $13,250
-
2011-05-06price $13,250 89-char remark
Show marketing remark (89 chars)
GREAT OPPORTUNITY. SPACIOUS 3 BEDROOM HOME, 1 FULL BATH. CLOSE TO PUBLIC TRANSPORTATION.
-
2011-03-24$14,000 Active 89-char remark
Show marketing remark (89 chars)
GREAT OPPORTUNITY. SPACIOUS 3 BEDROOM HOME, 1 FULL BATH. CLOSE TO PUBLIC TRANSPORTATION.
-
2010-03-23price $46,500 Reduced
-
2010-03-03price $47,000 Reduced
-
2010-01-06price $47,500 Reduced
-
2009-12-24price $48,500
-
2009-12-16price $49,500 Reduced
-
2008-12-15soldstatus $38,000
-
2008-09-17soldstatus $16,900
-
2008-04-08$24,500
-
2003-12-19soldstatus $74,000
-
1993-05-05soldstatus $16,100
-
1978-08-01soldstatus $7,500
ⓘ Source: listings_history table (triggers on properties + properties_extension) + one-shot
backfill from property_details.listing_events for pre-trigger history.
Tax reassessment forecast GA · Resets to sale price
- Current annual tax
- $3,032 · $253/mo
- Projected year-2 tax
- $3,032 · $253/mo
- Expected delta
- $0/yr ($0/mo · 0.0%)
ⓘ Screening estimate from a state-policy table — verify with the county assessor before closing.
Climate risk First Street
- Flood 1/10 Low FEMA zone X (unshaded) · 0% chance over 30 yrs
- Wildfire 1/10 Low
- Heat 5/10 Major 7 d/yr ≥103°F today · 18 d/yr by 30 yrs out
- Wind 6/10 Major 27% chance of damaging wind over 30 yrs
- Air quality 4/10 Moderate 5 unhealthy d/yr today · 7 by 30 yrs out
Nearby sold comps map
Loading sold comps map…
Walkable amenities ~0.75 mi
Loading nearby amenities…
Taxation est. · year 1
- Rental income
- $20,661
- − Mortgage interest
- −$10,643
- − Property taxes
- −$3,032
- − Insurance
- −$950
- − Repairs & maintenance
- −$1,653
- − Management
- −$1,653
- − Depreciation
- −$5,527
- Taxable loss
- −$2,797
- Est. tax savings @ 24.0%
- +$671
- After-tax cash flow
- $1,055/yr
For passive investors: Depreciation is non-cash, so a rental often shows a tax loss while cash-flowing — sheltering income. Rental losses are passive: they offset passive income freely, and up to $25,000/yr can offset ordinary (W-2) income if you actively participate and your MAGI is under $100k (phasing out to $0 by $150k); unused losses carry forward. On sale, claimed depreciation is recaptured at up to 25%, and gains may owe capital-gains tax (a 1031 exchange can defer both). Figures are a year-1 estimate at your 24.0% rate — not tax advice; consult a CPA.
Schools (NCES district)
- District
- Atlanta Public Schools
- NCES district ID
- 1300120
- Math proficiency
- 28% ▼ -6.00%
- Reading proficiency
- 35% ▼ -2.00%
- Median HH income
- $48,306
- Composite
- 27.27/100
- National rank
- #7006
- State rank
- #80 of 174 in GA
Livability — Atlanta
- Score
- 83/100
- State rank
- #6
- US rank
- #919
Category grades
Schools grade is shown separately in the Schools card above.
Census & demographics
- Census place
- Atlanta, GA
- County
- Fulton County · 1,094,430 people
- City population
- 629,525
- Metro
- Atlanta-Sandy Springs-Alpharetta, GA
- Population (ZIP)
- 23,333
- Household income
- $42,089
- Rent vs Own
- Severe rent burden
- 1293.0
Population outlook (Fulton County) Hauer SSP2
- Today (2025)
- 1,203,707 people
- By 2030
- 1,299,706 · +8.0%
- By 2040
- 1,488,256 · +23.6%
- By 2050
- 1,664,580 · +38.3%
- By 2075
- 2,036,072 · +69.2%
- By 2100
- 2,222,402 · +84.6%
Race, ethnicity, and origin ACS 2023
- Neighborhood character
- Predominantly Black (76%)
- Race & ethnicity
- Black 76% White 11% Hispanic / Latino 7% Asian 4% Two or more races 3%
- Hispanic origin (detail)
- Mexican 4% Dominican 1%
- Common ancestry
- Lithuanian 1%
- Foreign-born
- 6% · Canada, China, South Korea
- Languages at home
- 89% English-only · Spanish 5% Other Indo-European 1% Chinese 1%
Political lean MEDSL · Fulton
- 2024 margin
- Solid D (+44.9) · D 71.9% · R 27.0% · Other 1.1%
- 2008→2024 swing
- +9.8pp toward D · 2008: 35.0pp · 2024: 44.9pp
- All cycles
- 2024: D+44.9 2020: D+46.4 2016: D+42.1 2012: D+29.6 2008: D+35.0
Not yet ingested
- Civics
- —
Market trends
- HPI YoY
- ▼ -95.32%
- Current HPI
- 321.4626
- Rent YoY
- ▲ 2.53%
- Metro
- Atlanta-Sandy Springs-Alpharetta, GA
- State GDP YoY
- ▲ 2.66%
- F500 in state
- 28
Industry mix (Fortune 500 HQ in GA)
| Industry | F500 HQs | Revenue |
|---|---|---|
| Paper / Packaging | 2 | $29B |
|
||
| Retail | 1 | $160B |
|
||
| Transportation / Logistics | 1 | $91B |
|
||
| Airlines | 1 | $62B |
|
||
| Consumer Goods | 1 | $47B |
|
||
| Utilities | 1 | $25B |
|
||
Price history
+2433.3% since first listed23 events — show timeline
- 2026-05-25 Listed $190,000 GAMLS
- 2018-05-01 Sold (Public Records) $59,500 Public Records
- 2015-06-01 Listing Removed — GAMLS
- 2015-03-09 Price Changed $30,000 GAMLS
- 2015-02-06 Listed $35,999 GAMLS
- 2011-08-09 Sold (MLS) $12,500 FMLS
- 2011-07-31 Listing Removed — FMLS
- 2011-06-11 Price Changed $11,900 GAMLS
- 2011-06-10 Price Changed $11,900 FMLS
- 2011-05-07 Price Changed $13,250 GAMLS
- 2011-05-06 Price Changed $13,250 FMLS
- 2011-03-24 Listed $14,000 FMLS
- 2010-03-23 Price Changed $46,500 GAMLS
- 2010-03-03 Price Changed $47,000 GAMLS
- 2010-01-06 Price Changed $47,500 GAMLS
- 2009-12-24 Price Changed $48,500 GAMLS
- 2009-12-16 Price Changed $49,500 GAMLS
- 2008-12-15 Sold (Public Records) $38,000 Public Records
- 2008-09-17 Sold (MLS) $16,900 FMLS
- 2008-04-08 Listed $24,500 FMLS
- 2003-12-19 Sold (Public Records) $74,000 Public Records
- 1993-05-05 Sold (Public Records) $16,100 Public Records
- 1978-08-01 Sold (Public Records) $7,500 Public Records
Property tax history
+7.0%/yrLatest (2025): $3,032 · -0.9% YoY. Source: county tax records.
Cash-flow waterfall
monthlySold comps — $/sqft
last 12 mo · ≤1 miLoading sold comps…