 Duplex
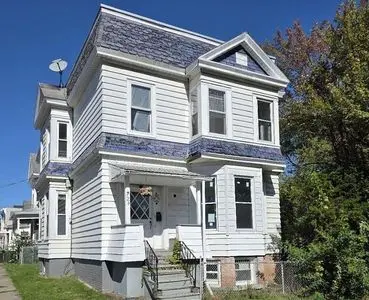
526 15th St · Watervliet, NY
Flood risk 1/10 · Minimal
- FEMA flood zone
- X (unshaded)
- Chance of flooding over 30 yrs
- 0.0%
- Est. flood insurance / yr
- $473 – $860
Fire risk 1/10 · Minimal
- Est. fire insurance / yr
- $691 – $1,283
Heat risk 4/10 · Minor
- Hot days now (above 96°F)
- 7 days/yr
- Hot days in 30 yrs
- 17 days/yr
Wind risk 3/10 · Minor
- Chance of severe wind over 30 yrs
- 6.0%
Air-quality risk 2/10 · Minimal
- Unhealthy air days now
- 0 days/yr
- Unhealthy air days in 30 yrs
- 1 days/yr
Risk factors via First Street. Map © Google.
Why this score? — see what drove the D grade
The composite is a weighted blend of 9 inputs, each scored 0–100. Each bar is that input's sub-score; the figure is the points it added to the 100-point composite (weight × sub-score).
- Cash flow +17.3/30.0
- DSCR +5.4/10.0
- 1% rule +5.3/10.0
- Rent growth +4.2/5.0
- Livability +4.2/5.0
- Schools +3.4/10.0
- Condition / age +2.5/5.0
- ARV discount +0.0/15.0
- Appreciation +0.0/10.0
$359,000
🖨 Deal sheet 📄 Offer letter ✓ Due diligence
Multi-family units
County records classify this as Multi-Family (2-4 Unit). Listing-text estimate: 2 units. confirmed
Listing remarks MLS
Assignment Contract. Cash Only. Sold AS IS. 10 Percent due at signing. Agent is Owner
Key facts
- New water tank
- Private yard
- Sunroom
Tags
Neighborhood map
What this means for you Summary
Snapshot
- This is a 2 × 3-bed/1.0-bath units multifamily listed at $359k.
Deal economics
- At list price, monthly cash flow is $263 ($3k/yr) — positive. Per door: $132/mo.
- The deal already cash-flows at list — no discount required.
- Meets the 1% rule at list price ($4k rent vs $359k).
- Cap rate 7.2% vs local median 5.9% in Watervliet — meaningfully above typical; check what's discounted (condition, days-on-market, listing class) to confirm the premium yield is real.
Location & tenants
- Location reads 84/100 on livability (#51 in NY, #786 nationally) — a professional / high-income tenant draw. Strengths: amenities A+, housing A+, health & safety A+; Watch: crime D+, schools D.
- Watervliet City School District (suburban): math 36% / reading 45% proficiency, ranked #524 of 590 in NY (top 89%) — families likely to look elsewhere, expect single-tenant / working-renter base with shorter leases.
- Market conditions: Rents rising fast (+6.6%/yr); 72 active listings in the ZIP; 675 units permitted in Albany County in 2024 (451 in 5+ unit buildings).
- At $3,693/mo this rent would consume 68% of the median local household income ($65k/yr) (locally 1224% of renters already pay >50% of income on rent) — very limited rent-growth headroom before tenants either downsize or default.
Forward outlook
- Local home prices are declining (-3.0%/yr); year-one equity from $2k of loan paydown is wiped out by about $11k of value loss. Plan a longer hold.
- Albany County population projected at +9% by 2050 — modest demand growth; plan on rents tracking national, not racing it.
Negotiation context
- Only 1 days on market — expect competitive offers; lowballing is unlikely to land.
- 3 sale attempts since 12y ago with the ask held roughly flat each time — persistent listings suggest the price (not the market) is what's stuck; bring a comps-based counter.
- Current owner paid $189k; list at $359k implies a 90% gain — meaningful room to come down on a strong offer.
Questions for the listing agent
- Can we see the unit-by-unit rent roll, current vacancy, and any below-market leases? What's the average tenancy length?
- What capital expenditures (roof, boiler, parking lot, exteriors) have been made in the last 5 years, and what's planned in the next 2?
- Built in 1970 — when were the roof, HVAC, electrical panel, plumbing, and water heater last replaced?
- Is there a deadline driving the sale (1031 exchange, divorce, estate, relocation)? That informs how much negotiation room exists.
- Schools are D-rated, which usually means shorter tenancies and higher turnover. Who's the typical renter profile here, and what's been the actual vacancy rate?
- Crime grade is D in this area — have there been break-ins, vandalism, or insurance claims at this property in the last 3 years? What carrier currently insures it and at what premium?
- The area grade is low — what's the realistic commute time and amenity access for the typical tenant pool here? Any planned neighborhood developments (good or bad) we should know about?
- What's the average days-on-market for RENTAL listings here right now (not sales)? A rising rental-DOM trend means longer vacancies and softer asking-rent achievability than the comps imply.
- What's the recent tenant-quality profile in this submarket — average credit score on applications, eviction rate, late-payment / NSF rate, and stable-employment percentage? A property-management company in the area should have these aggregated.
- How much new apartment / multifamily construction is in the pipeline within 1–3 miles? Heavy new supply (>2% of stock underway) typically softens rents 12–24 months out; light construction supports rent growth.
Investment metrics
- 1% rule
- 1.03% ✓
- Cap rate
- 7.17%
- Cash-on-cash
- 3.14%
- DSCR
- 1.14
- GRM
- 8.1
CMA / ARV
- ARV (on-the-fly)
- $271,440
- Comps found
- 12
Show comp detail 12 sales within ~0.75 mi
| Address | Dist | Beds/Ba | Sqft | Sold | Price | $/sf | Match |
|---|---|---|---|---|---|---|---|
| 526 15th St | 0.00mi | 7/2.0 | 2,610 (0%) | 6mo | $189,000 | $72 | 95 |
| 1546 Seventh Ave | 0.10mi | 6/3.0 (-1) | 2,552 (-2%) | 8mo | $350,000 | $137 | 76 |
| 1834 6th Ave | 0.27mi | 6/2.0 (-1) | 2,680 (+3%) | 3mo | $250,000 | $93 | 76 |
| 1819 6th Ave | 0.24mi | 6/2.0 (-1) | 2,684 (+3%) | 9mo | $202,500 | $75 | 72 |
| 902 19th St | 0.41mi | 6/2.5 (-1) | 2,560 (-2%) | 2mo | $250,000 | $98 | 69 |
| 204 13th St | 0.25mi | 6/3.0 (-1) | 2,794 (+7%) | 8mo | $289,900 | $104 | 61 |
| 2344 Broadway | 0.61mi | 6/2.0 (-1) | 2,582 (-1%) | 5mo | $215,000 | $83 | 60 |
| 1801 9th Ave | 0.29mi | 6/3.0 (-1) | 2,244 (-14%) | 2mo | $340,000 | $152 | 53 |
| 804 25th St | 0.63mi | 6/3.5 (-1) | 2,688 (+3%) | 6mo | $308,455 | $115 | 50 |
| 2315 3rd Ave | 0.50mi | 6/2.0 (-1) | 2,334 (-11%) | 6mo | $221,100 | $95 | 49 |
| 1910 9th Ave | 0.45mi | 6/2.0 (-1) | 2,880 (+10%) | 12mo | $364,000 | $126 | 47 |
| 2430 3rd Ave | 0.63mi | 7/3.0 | 2,248 (-14%) | 8mo | $290,000 | $129 | 37 |
Match score weights: distance 35% · size 25% · config 20% · recency 20%. Top-matched comps best support the ARV.
Projected returns pro-forma
-3.0% appreciation · 6.61% rent growth · sell at horizon
- IRR
- -7.1%
- Equity multiple
- 0.73×
- Total profit
- $-27,339
- Equity at exit
- $53,528
- IRR
- 6.8%
- Equity multiple
- 1.60×
- Total profit
- $59,890
- Equity at exit
- $31,040
Cash invested: $100,520 (down + closing). Projections, not guarantees.
Landlord ↔ Tenant lean methodology
- Overall (STATE)
- 15 Strongly Tenant-Friendly
- State New York
- 15 Strongly Tenant-Friendly · D+10
- County
- — inherits STATE
- City
- — inherits STATE
ZIP-level market 12189
- Home prices YoY
- -28.7%
- Rents YoY
- 6.6%
- Active inventory
- 72
- Price-to-rent
- 16.2×
Monthly cashflow live
- Estimated rent
- $3,693 high interval (Pro) →
- Mortgage (P&I)
- −$1,883
- Tax from tax record
- −$622 /mo · $7,463/yr
- Insurance
- −$150
- HOA
- −$0
- Vacancy / Maint / Mgmt
- −$776
- Net cashflow
- $263
Break-even live
2-unit breakdown (identical units grouped — click to expand)
| Units | Beds | Baths | Est. rent |
|---|---|---|---|
| 2× units | 3 | 1 | $3,692 |
| #1 | 3 | 1 | $1,846 |
| #2 | 3 | 1 | $1,846 |
| Total (2 units) | $3,693 | ||
UW: 25.0% down · 7.5% · 30yr · 1.5% tax · 5.0% vac · 8.0% maint · 8.0% mgmt
Financing live
Cash to close
- Down payment
- $89,750
- Closing costs
- $10,770
- Reserves months
- —
- Total cash needed
- —
Loan-product check · same deal, 3 products live
Conventional
25% down · 7.5% · 30yr
- Down + closing
- —
- Monthly P&I
- —
- Monthly cashflow
- —
- DSCR
- —
- Eligible?
- —
Personal DTI + credit; lowest rate.
DSCR
20% down · 8.5% · 30yr
- Down + closing
- —
- Monthly P&I
- —
- Monthly cashflow
- —
- DSCR
- —
- Eligible?
- —
No personal income docs; deal must DSCR.
Hard money
10% down · 12.0% · 12mo
- Down + closing
- —
- Monthly P&I
- —
- Monthly cashflow
- —
- DSCR
- —
- Eligible?
- —
Short-term bridge; refi at stabilization.
Listing history 9 events
-
2026-05-13status Under Contract
-
2026-05-12$359,000 Active
-
2025-12-05soldstatus $189,000 Closed 85-char remark
Show marketing remark (85 chars)
Assignment Contract. Cash Only. Sold AS IS. 10 Percent due at signing. Agent is Owner
-
2025-10-06status Pending 85-char remark
Show marketing remark (85 chars)
Assignment Contract. Cash Only. Sold AS IS. 10 Percent due at signing. Agent is Owner
-
2025-10-02$189,000 Active 85-char remark
Show marketing remark (85 chars)
Assignment Contract. Cash Only. Sold AS IS. 10 Percent due at signing. Agent is Owner
-
2014-09-30soldstatus $145,500
-
2014-09-03soldstatus $145,114 260-char remark
Show marketing remark (260 chars)
Well maintained 2 family in quiet Watervliet location with spacious 3 bedroom apartments, separate utilities with natural gas, possible 3rd unit in basement. Each unit has a heated sun porch, hardwood floors, laundry hook ups in each unit. Excellent Condition
-
2014-04-30historical 260-char remark
Show marketing remark (260 chars)
Well maintained 2 family in quiet Watervliet location with spacious 3 bedroom apartments, separate utilities with natural gas, possible 3rd unit in basement. Each unit has a heated sun porch, hardwood floors, laundry hook ups in each unit. Excellent Condition
-
2014-04-28$139,900 260-char remark
Show marketing remark (260 chars)
Well maintained 2 family in quiet Watervliet location with spacious 3 bedroom apartments, separate utilities with natural gas, possible 3rd unit in basement. Each unit has a heated sun porch, hardwood floors, laundry hook ups in each unit. Excellent Condition
ⓘ Source: listings_history table (triggers on properties + properties_extension) + one-shot
backfill from property_details.listing_events for pre-trigger history.
Tax reassessment forecast NY · Partial reset (capped growth)
- Current annual tax
- $7,463 · $622/mo
- Projected year-2 tax
- $7,463 · $622/mo
- Expected delta
- $0/yr ($0/mo · -0.0%)
ⓘ Screening estimate from a state-policy table — verify with the county assessor before closing.
Climate risk First Street
- Flood 1/10 Low FEMA zone X (unshaded) · 0% chance over 30 yrs
- Wildfire 1/10 Low
- Heat 4/10 Moderate 7 d/yr ≥96°F today · 17 d/yr by 30 yrs out
- Wind 3/10 Moderate 6% chance of damaging wind over 30 yrs
- Air quality 2/10 Low 0 unhealthy d/yr today · 1 by 30 yrs out
Nearby sold comps map
Loading sold comps map…
Walkable amenities ~0.75 mi
Loading nearby amenities…
Taxation est. · year 1
- Rental income
- $44,316
- − Mortgage interest
- −$20,110
- − Property taxes
- −$7,463
- − Insurance
- −$1,795
- − Repairs & maintenance
- −$3,545
- − Management
- −$3,545
- − Depreciation
- −$10,444
- Taxable loss
- −$2,586
- Est. tax savings @ 24.0%
- +$621
- After-tax cash flow
- $3,781/yr
For passive investors: Depreciation is non-cash, so a rental often shows a tax loss while cash-flowing — sheltering income. Rental losses are passive: they offset passive income freely, and up to $25,000/yr can offset ordinary (W-2) income if you actively participate and your MAGI is under $100k (phasing out to $0 by $150k); unused losses carry forward. On sale, claimed depreciation is recaptured at up to 25%, and gains may owe capital-gains tax (a 1031 exchange can defer both). Figures are a year-1 estimate at your 24.0% rate — not tax advice; consult a CPA.
Schools (NCES district)
- District
- Watervliet City School District
- NCES district ID
- 3630210
- Math proficiency
- 36% ▼ -2.00%
- Reading proficiency
- 45% ▬ 0.00%
- Median HH income
- $43,276
- Composite
- 34.23/100
- National rank
- #5261
- State rank
- #524 of 590 in NY
Livability — Watervliet
- Score
- 84/100
- State rank
- #51
- US rank
- #786
Category grades
Schools grade is shown separately in the Schools card above.
Census & demographics
- Census place
- Watervliet, NY
- County
- Albany County · 196,626 people
- City population
- 18,656
- Metro
- Albany-Schenectady-Troy, NY
- Population (ZIP)
- 18,656
- Household income
- $65,276
- Rent vs Own
- Severe rent burden
- 1224.0
Population outlook (Albany County) Hauer SSP2
- Today (2025)
- 320,794 people
- By 2030
- 327,401 · +2.1%
- By 2040
- 338,218 · +5.4%
- By 2050
- 348,467 · +8.6%
- By 2075
- 381,693 · +19.0%
- By 2100
- 393,809 · +22.8%
Race, ethnicity, and origin ACS 2023
- Neighborhood character
- Predominantly White (72%)
- Race & ethnicity
- White 72% Two or more races 8% Asian 8% Black 8% Hispanic / Latino 6%
- Hispanic origin (detail)
- Mexican 2% Puerto Rican 2% Dominican 1%
- Common ancestry
- Lithuanian 6% Romanian 5% Scotch-Irish 4%
- Foreign-born
- 11% · Canada, China, South Korea
- Languages at home
- 88% English-only · Other Indo-European 4% Spanish 2% Other Asian/Pacific 2%
Political lean MEDSL · Albany
- 2024 margin
- Strong D (+25.8) · D 62.9% · R 37.1%
- 2008→2024 swing
- -3.6pp toward R · 2008: 29.4pp · 2024: 25.8pp
- All cycles
- 2024: D+25.8 2020: D+31.4 2016: D+24.3 2012: D+31.0 2008: D+29.4
Not yet ingested
- Civics
- —
Market trends
- HPI YoY
- ▼ -110.16%
- Current HPI
- 273.8109
- Rent YoY
- ▲ 6.61%
- Metro
- Albany-Schenectady-Troy, NY
- State GDP YoY
- ▲ 2.60%
- F500 in state
- 92
Industry mix (Fortune 500 HQ in NY)
| Industry | F500 HQs | Revenue |
|---|---|---|
| Financial Services | 10 | $950B |
|
||
| Consumer Goods | 9 | $162B |
|
||
| Insurance | 4 | $225B |
|
||
| Telecommunications | 2 | $144B |
|
||
| Pharmaceuticals | 2 | $112B |
|
||
| Media / Entertainment | 2 | $69B |
|
||
Price history
+156.6% since first listed9 events — show timeline
- 2026-05-13 Pending — FSBO.com
- 2026-05-12 Listed $359,000 FSBO.com
- 2025-12-05 Sold (MLS) $189,000 Global MLS
- 2025-10-06 Pending — Global MLS
- 2025-10-02 Listed $189,000 Global MLS
- 2014-09-30 Sold (Public Records) $145,500 Public Records
- 2014-09-03 Sold (MLS) $145,114 Global MLS
- 2014-04-30 Listing Removed — Global MLS
- 2014-04-28 Listed $139,900 Global MLS
Property tax history
+6.1%/yrLatest (2025): $7,463 · +1.4% YoY. Source: county tax records.
Cash-flow waterfall
monthlySold comps — $/sqft
last 12 mo · ≤1 miLoading sold comps…