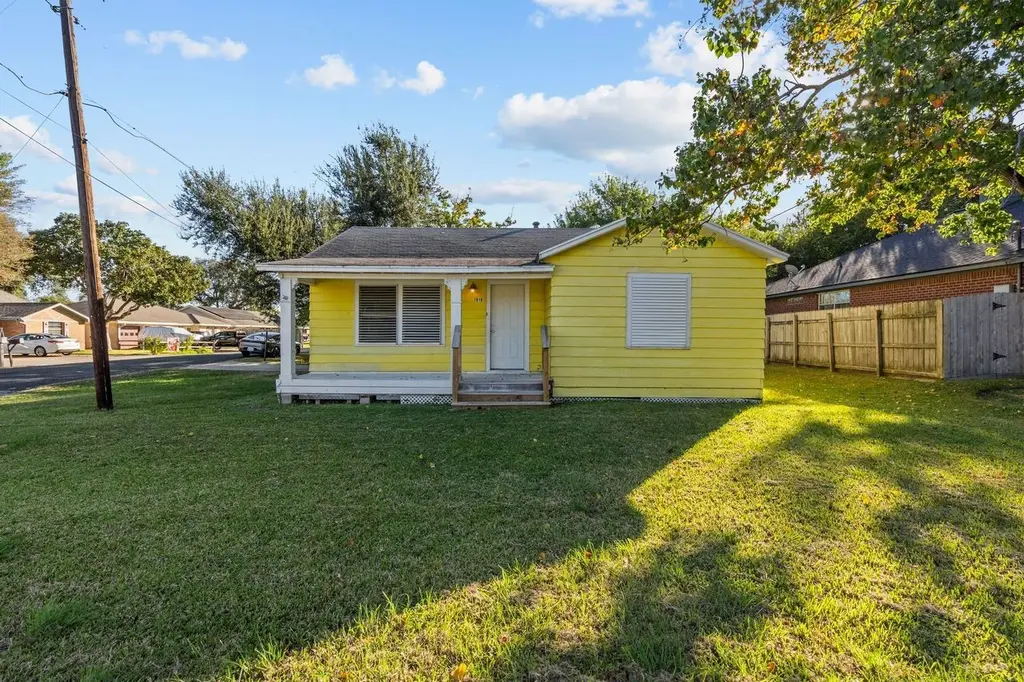
1916 N Logan St · Texas City, TX
Flood risk 9/10 · Severe
- FEMA flood zone
- X
- Chance of flooding over 30 yrs
- 0.99%
- Est. flood insurance / yr
- $507 – $1,088
Fire risk 1/10 · Minimal
- Est. fire insurance / yr
- $1,222 – $2,270
Heat risk 10/10 · Severe
- Hot days now (above 108°F)
- 7 days/yr
- Hot days in 30 yrs
- 27 days/yr
Wind risk 9/10 · Severe
- Chance of severe wind over 30 yrs
- 99.0%
Air-quality risk 2/10 · Minimal
- Unhealthy air days now
- 2 days/yr
- Unhealthy air days in 30 yrs
- 2 days/yr
Risk factors via First Street. Map © Google.
Why this score? — see what drove the D grade
The composite is a weighted blend of 9 inputs, each scored 0–100. Each bar is that input's sub-score; the figure is the points it added to the 100-point composite (weight × sub-score).
- Cash flow +13.4/30.0
- ARV discount +8.5/15.0
- 1% rule +5.3/10.0
- DSCR +4.0/10.0
- Rent growth +3.7/5.0
- Livability +3.1/5.0
- Condition / age +2.5/5.0
- Schools +2.4/10.0
- Appreciation +0.0/10.0
$185,000
🖨 Deal sheet 📄 Offer letter ✓ Due diligence
Listing remarks MLS
Welcome to your next home! This delightful 4-bedroom, 1-bath single-family residence offers comfort, character, and convenience all in one. Nestled in a quiet neighborhood in Texas City, this home features a cozy front porch perfect for morning coffee or evening relaxation. Outside, you’ll find a large backyard great for storage, or a future workshop. Located close to schools, parks, shopping, and just a short drive to the Galveston coast, this home offers a fantastic blend of suburban charm and coastal proximity.
Key facts
- Close to parks
- Close to schools
- Front porch
Tags
Neighborhood map
What this means for you Summary
Snapshot
- This is a 4-bed/1.0-bath single-family listed at $185k.
Deal economics
- At list price, monthly cash flow is $-62 ($-748/yr) — negative.
- To cash-flow at today's rent, offer at most $174k (6.0% below list).
- Meets the 1% rule at list price ($2k rent vs $185k).
- Recommended offer: $163k (12.0% below list) — sets the bar for market timing.
- Cap rate 6.3% vs local median 4.3% in Texas City — top-decile yield for the area; either an underpriced asset or a hidden risk that comps aren't pricing in. Stress-test before assuming the spread holds.
Location & tenants
- Location reads 62/100 on livability (#907 in TX) — a middle-class / working-renter tenant base. Strengths: cost of living A+, housing A+; Watch: crime D+, schools F, amenities F.
- Texas City ISD (suburban): math 28% / reading 29% proficiency, ranked #655 of 826 in TX (top 79%) — low school quality limits family demand, transient renter base, plan for 1-2y turnover; 66% free/reduced lunch — lower-income household profile, screen leases tightly.
- Market conditions: Rents rising fast (+4.9%/yr); 292 active listings in the ZIP; 9 comparable units currently listed for rent nearby; rentals at typical pace (median 24d on market — plan ~3-4 weeks tenant-placement turnaround); 3,258 units permitted in Galveston County in 2024 (0 in 5+ unit buildings).
- This rent runs 35% of the median local income ($66k/yr) — at the standard rent-burdened threshold; future hikes will face affordability resistance.
Forward outlook
- Local home prices are declining (-3.0%/yr); year-one equity from $1k of loan paydown is wiped out by about $6k of value loss. Plan a longer hold.
- Galveston County population projected at +43% by 2050 — long-run rental-demand tailwind backs the buy-and-hold thesis.
Negotiation context
- It's been on market 212 days — a 12% lower offer ($163k) is reasonable based on typical stale-listing flexibility.
- 2 sale attempts since 7y ago; this cycle's ask has dropped $10k (5%) from the opening price — seller is motivated, your offer sets the floor, not the list.
Risks & watch-outs
- Watch-outs: property tax is 2.9% of price; flood insurance adds $66/mo; built in 1956 — expect roof / HVAC / electrical / plumbing capex.
- Climate carrying-cost: severe flood risk; severe wind risk, 99% chance of damaging wind over 30y; extreme-heat days projected 7→27/yr by 2055 (HVAC capex compounding) — expect insurance premiums to compound above CPI over the hold.
Questions for the listing agent
- What do current leases actually rent for vs. the listed asking? Can we see a recent rent roll and the last 12 months of T-12 income?
- It's been on market 212 days. Have you received any prior offers? Is the seller open to a 12% concession, seller financing, or rate buy-down credit?
- Built in 1956 — when were the roof, HVAC, electrical panel, plumbing, and water heater last replaced?
- Property tax is high relative to price — has the assessment been appealed recently, and will the sale trigger a re-assessment?
- What's the actual annual flood-insurance premium (NFIP or private), and is the property in a SFHA with mandatory coverage?
- Why hasn't it sold? Are there any deal-killer items the seller is aware of (foundation, flood, title, zoning, code violations)?
- Is there a deadline driving the sale (1031 exchange, divorce, estate, relocation)? That informs how much negotiation room exists.
- Schools are F-rated, which usually means shorter tenancies and higher turnover. Who's the typical renter profile here, and what's been the actual vacancy rate?
- Crime grade is D in this area — have there been break-ins, vandalism, or insurance claims at this property in the last 3 years? What carrier currently insures it and at what premium?
- The area grade is low — what's the realistic commute time and amenity access for the typical tenant pool here? Any planned neighborhood developments (good or bad) we should know about?
- What's the average days-on-market for RENTAL listings here right now (not sales)? A rising rental-DOM trend means longer vacancies and softer asking-rent achievability than the comps imply.
- What's the recent tenant-quality profile in this submarket — average credit score on applications, eviction rate, late-payment / NSF rate, and stable-employment percentage? A property-management company in the area should have these aggregated.
- How much new for-sale + rental construction is in the pipeline within 1–3 miles? Heavy new supply typically softens prices + rents 12–24 months out; constrained supply supports both.
Investment metrics
- 1% rule
- 1.03% ✓
- Cap rate
- 6.32%
- Cash-on-cash
- 0.10%
- DSCR
- 1.00
- GRM
- 8.1
CMA / ARV
- ARV (median comp)
- $189,325
- List price
- $185,000
- Delta
- -2.28%
- Verdict
- FAIR
- Comps
- 20 within 1.0 mi
Show comp detail 12 sales within ~0.75 mi
| Address | Dist | Beds/Ba | Sqft | Sold | Price | $/sf | Match |
|---|---|---|---|---|---|---|---|
| 2410 21st Ave N | 0.10mi | 4/2.0 | 1,288 (-10%) | 2mo | $160,000 | $124 | 74 |
| 2429 16th Ave N | 0.28mi | 4/2.0 | 1,517 (+6%) | 2mo | $215,000 | $142 | 71 |
| 2009 15th Ave N | 0.51mi | 3/1.0 (-1) | 1,412 (-1%) | 3mo | $189,900 | $134 | 67 |
| 2013 17th Ave N | 0.41mi | 3/2.0 (-1) | 1,355 (-5%) | 1mo | $229,900 | $170 | 62 |
| 2419 29th Ave N | 0.48mi | 3/2.0 (-1) | 1,395 (-2%) | 3mo | $239,900 | $172 | 62 |
| 2814 12th Ave N | 0.61mi | 3/1.5 (-1) | 1,346 (-6%) | 1mo | $172,000 | $128 | 54 |
| 2918 15th Ave N | 0.61mi | 3/1.0 (-1) | 1,538 (+8%) | 1mo | $198,500 | $129 | 53 |
| 1702 16th Ave N | 0.65mi | 3/2.0 (-1) | 1,355 (-5%) | 2mo | $242,000 | $179 | 50 |
| 2604 27th Ave N | 0.43mi | 3/2.0 (-1) | 1,261 (-12%) | 2mo | $210,000 | $167 | 50 |
| 3014 14th Ave N | 0.70mi | 4/1.5 | 1,612 (+13%) | 1mo | $110,000 | $68 | 43 |
| 3217 21st St N | 0.71mi | 3/2.0 (-1) | 1,543 (+8%) | 3mo | $289,520 | $188 | 42 |
| 2909 30th Ave N | 0.73mi | 3/2.0 (-1) | 1,604 (+12%) | 1mo | $220,000 | $137 | 35 |
Match score weights: distance 35% · size 25% · config 20% · recency 20%. Top-matched comps best support the ARV.
Projected returns pro-forma
-3.0% appreciation · 4.91% rent growth · sell at horizon
- IRR
- -15.9%
- Equity multiple
- 0.42×
- Total profit
- $-30,013
- Equity at exit
- $27,584
- IRR
- -3.8%
- Equity multiple
- 0.72×
- Total profit
- $-14,501
- Equity at exit
- $15,995
Cash invested: $51,800 (down + closing). Projections, not guarantees.
Landlord ↔ Tenant lean methodology
- Overall (STATE)
- 87 Strongly Landlord-Friendly
- State Texas
- 87 Strongly Landlord-Friendly · R+5
- County
- — inherits STATE
- City
- — inherits STATE
ZIP-level market 77590
- Home prices YoY
- -19.3%
- Rents YoY
- 4.9%
- Active inventory
- 292
- Price-to-rent
- 8.1×
Monthly cashflow live
- Estimated rent
- $1,904 high interval (Pro) →
- Mortgage (P&I)
- −$970
- Tax from tax record
- −$453 /mo · $5,432/yr
- Insurance
- −$77
- Flood insurance flood zone
- −$66 /mo · $798/yr
- HOA
- −$0
- Vacancy / Maint / Mgmt
- −$400
- Net cashflow
- $-62
Break-even live
UW: 25.0% down · 7.5% · 30yr · 1.5% tax · 5.0% vac · 8.0% maint · 8.0% mgmt
Financing live
Cash to close
- Down payment
- $46,250
- Closing costs
- $5,550
- Reserves months
- —
- Total cash needed
- —
Loan-product check · same deal, 3 products live
Conventional
25% down · 7.5% · 30yr
- Down + closing
- —
- Monthly P&I
- —
- Monthly cashflow
- —
- DSCR
- —
- Eligible?
- —
Personal DTI + credit; lowest rate.
DSCR
20% down · 8.5% · 30yr
- Down + closing
- —
- Monthly P&I
- —
- Monthly cashflow
- —
- DSCR
- —
- Eligible?
- —
No personal income docs; deal must DSCR.
Hard money
10% down · 12.0% · 12mo
- Down + closing
- —
- Monthly P&I
- —
- Monthly cashflow
- —
- DSCR
- —
- Eligible?
- —
Short-term bridge; refi at stabilization.
Rent comps 9 comps
| Address | Beds | Baths | Sqft | Rent | $/sqft | DOM | Units | Dist |
|---|---|---|---|---|---|---|---|---|
| 2418 14th Ave N Texas City, TX | 3.0 | 2.0 | 1488 | $1,775 | $1.19 | 3d | 1 | 0.37mi |
| 2608 21st St N Texas City, TX | 3.0 | 2.0 | 974 | $1,400 | $1.44 | 43d | 1 | 0.52mi |
| 2602 21st St N Texas City, TX | 1.0–3.0 | 1.0–2.0 | 768 | $1,450 | $1.89 | 1d | 44 | 0.59mi |
| 1919 13th Ave N Texas City, TX | 1.0–3.0 | 1.0–2.0 | 950 | $1,499 | $1.58 | 2d | 6 | 0.65mi |
| 2622 34th Ave N Texas City, TX | 3.0 | 1.0 | 1476 | $1,725 | $1.17 | 43d | 1 | 0.77mi |
| 2714 5th Ave N Texas City, TX | 3.0 | 2.0 | 1382 | $1,800 | $1.30 | 43d | 1 | 1.03mi |
| 2526 3rd 1/2 Ave N Texas City, TX | 3.0 | 2.0 | 1240 | $1,550 | $1.25 | 24d | 1 | 1.08mi |
| 3106 Danforth Dr Texas City, TX | 3.0 | 1.0 | 1100 | $1,800 | $1.64 | 24d | 1 | 1.14mi |
| 3510 Oleander Ave Unit 1545914P Texas City, TX | 3.0 | 2.0 | 1808 | $3,902 | $2.16 | 17d | 1 | 1.22mi |
Listing history 19 events
-
2026-06-18days on market $185,000 Active 212 DOM
-
2026-06-17days on market $185,000 Active 211 DOM
-
2026-06-16days on market $185,000 Active 210 DOM
-
2026-06-15days on market $185,000 Active 209 DOM
-
2026-06-13days on market $185,000 Active 207 DOM
-
2026-06-09days on market $185,000 Active 203 DOM
-
2026-06-08days on market $185,000 Active 202 DOM
-
2026-06-07days on market $185,000 Active 201 DOM
-
2026-06-04days on market $185,000 Active 198 DOM
-
2026-06-03days on market $185,000 Active 197 DOM
-
2026-06-02days on market $185,000 Active 196 DOM
-
2026-06-01days on market $185,000 Active 195 DOM
-
2026-05-31days on market $185,000 Active 194 DOM
-
2025-11-18$195,000 Active 526-char remark
Show marketing remark (526 chars)
Welcome to your next home! This delightful 4-bedroom, 1-bath single-family residence offers comfort, character, and convenience all in one. Nestled in a quiet neighborhood in Texas City, this home features a cozy front porch perfect for morning coffee or evening relaxation. Outside, you’ll find a large backyard great for storage, or a future workshop. Located close to schools, parks, shopping, and just a short drive to the Galveston coast, this home offers a fantastic blend of suburban charm and coastal proximity.
-
2019-09-23soldstatus
-
2019-09-20soldstatus Sold 593-char remark
Show marketing remark (593 chars)
THIS HOME IS LOCATED IN AN ESTABLISHED NEIGHBORHOOD. CONVENIENTLY LOCATED NEAR SHOPPING CENTERS, RESTAURANTS AND EASY ACCESS TO HIGHWAYS. ALL INVESTORS AND BUYERS WELCOMED! MAKE THIS HOME YOUR OWN AND OR ENDLESS INVESTMENT OPPORTUNITIES. DON'T LET THIS OPPORTUNITY PASS! BUYER TO VERIFY ALL MEASUREMENTS AND ROOM DIMENSIONS. * * * 1 OF THE 3 CAR GARAGES CAN BE TURNED INTO A ONE BEDROOM EFFICIENCY FOR DOUBLE RENTAL INCOME. THERE'S TWO SEPARATE DRIVEWAYS WHICH IS A PLUS! EXTRA BACK ROOM ADDITION THAT IS NOT PART OF APPRAISAL DISTRICT. HOME IS DEFINITELY A MUST SEE!! HURRY BEFORE ITS GONE!
-
2019-08-23status Pending 593-char remark
Show marketing remark (593 chars)
THIS HOME IS LOCATED IN AN ESTABLISHED NEIGHBORHOOD. CONVENIENTLY LOCATED NEAR SHOPPING CENTERS, RESTAURANTS AND EASY ACCESS TO HIGHWAYS. ALL INVESTORS AND BUYERS WELCOMED! MAKE THIS HOME YOUR OWN AND OR ENDLESS INVESTMENT OPPORTUNITIES. DON'T LET THIS OPPORTUNITY PASS! BUYER TO VERIFY ALL MEASUREMENTS AND ROOM DIMENSIONS. * * * 1 OF THE 3 CAR GARAGES CAN BE TURNED INTO A ONE BEDROOM EFFICIENCY FOR DOUBLE RENTAL INCOME. THERE'S TWO SEPARATE DRIVEWAYS WHICH IS A PLUS! EXTRA BACK ROOM ADDITION THAT IS NOT PART OF APPRAISAL DISTRICT. HOME IS DEFINITELY A MUST SEE!! HURRY BEFORE ITS GONE!
-
2019-08-16status Option Pending 593-char remark
Show marketing remark (593 chars)
THIS HOME IS LOCATED IN AN ESTABLISHED NEIGHBORHOOD. CONVENIENTLY LOCATED NEAR SHOPPING CENTERS, RESTAURANTS AND EASY ACCESS TO HIGHWAYS. ALL INVESTORS AND BUYERS WELCOMED! MAKE THIS HOME YOUR OWN AND OR ENDLESS INVESTMENT OPPORTUNITIES. DON'T LET THIS OPPORTUNITY PASS! BUYER TO VERIFY ALL MEASUREMENTS AND ROOM DIMENSIONS. * * * 1 OF THE 3 CAR GARAGES CAN BE TURNED INTO A ONE BEDROOM EFFICIENCY FOR DOUBLE RENTAL INCOME. THERE'S TWO SEPARATE DRIVEWAYS WHICH IS A PLUS! EXTRA BACK ROOM ADDITION THAT IS NOT PART OF APPRAISAL DISTRICT. HOME IS DEFINITELY A MUST SEE!! HURRY BEFORE ITS GONE!
-
2019-08-03$89,000 Active 593-char remark
Show marketing remark (593 chars)
THIS HOME IS LOCATED IN AN ESTABLISHED NEIGHBORHOOD. CONVENIENTLY LOCATED NEAR SHOPPING CENTERS, RESTAURANTS AND EASY ACCESS TO HIGHWAYS. ALL INVESTORS AND BUYERS WELCOMED! MAKE THIS HOME YOUR OWN AND OR ENDLESS INVESTMENT OPPORTUNITIES. DON'T LET THIS OPPORTUNITY PASS! BUYER TO VERIFY ALL MEASUREMENTS AND ROOM DIMENSIONS. * * * 1 OF THE 3 CAR GARAGES CAN BE TURNED INTO A ONE BEDROOM EFFICIENCY FOR DOUBLE RENTAL INCOME. THERE'S TWO SEPARATE DRIVEWAYS WHICH IS A PLUS! EXTRA BACK ROOM ADDITION THAT IS NOT PART OF APPRAISAL DISTRICT. HOME IS DEFINITELY A MUST SEE!! HURRY BEFORE ITS GONE!
ⓘ Source: listings_history table (triggers on properties + properties_extension) + one-shot
backfill from property_details.listing_events for pre-trigger history.
Tax reassessment forecast TX · Resets to sale price
- Current annual tax
- $5,432 · $453/mo
- Projected year-2 tax
- $5,432 · $453/mo
- Expected delta
- $0/yr ($0/mo · 0.0%)
ⓘ Screening estimate from a state-policy table — verify with the county assessor before closing.
Climate risk First Street
- Flood 9/10 Extreme FEMA zone X · 99% chance over 30 yrs
- Wildfire 1/10 Low
- Heat 10/10 Extreme 7 d/yr ≥108°F today · 27 d/yr by 30 yrs out
- Wind 9/10 Extreme 99% chance of damaging wind over 30 yrs
- Air quality 2/10 Low 2 unhealthy d/yr today · 2 by 30 yrs out
Nearby sold comps map
Loading sold comps map…
Walkable amenities ~0.75 mi
Loading nearby amenities…
Taxation est. · year 1
- Rental income
- $22,847
- − Mortgage interest
- −$10,363
- − Property taxes
- −$5,432
- − Insurance
- −$1,722
- − Repairs & maintenance
- −$1,828
- − Management
- −$1,828
- − Depreciation
- −$5,382
- Taxable loss
- −$3,708
- Est. tax savings @ 24.0%
- +$890
- After-tax cash flow
- $142/yr
For passive investors: Depreciation is non-cash, so a rental often shows a tax loss while cash-flowing — sheltering income. Rental losses are passive: they offset passive income freely, and up to $25,000/yr can offset ordinary (W-2) income if you actively participate and your MAGI is under $100k (phasing out to $0 by $150k); unused losses carry forward. On sale, claimed depreciation is recaptured at up to 25%, and gains may owe capital-gains tax (a 1031 exchange can defer both). Figures are a year-1 estimate at your 24.0% rate — not tax advice; consult a CPA.
Schools (NCES district)
- District
- Texas City ISD
- NCES district ID
- 4842510
- Math proficiency
- 28% ▼ -10.00%
- Reading proficiency
- 29% ▼ -4.00%
- Median HH income
- $44,875
- Composite
- 24.47/100
- National rank
- #7664
- State rank
- #655 of 826 in TX
Livability — Texas City
- Score
- 62/100
- State rank
- #907
- US rank
- #16268
Category grades
Schools grade is shown separately in the Schools card above.
Census & demographics
- Census place
- Texas City, TX
- County
- Galveston County · 357,330 people
- City population
- 49,936
- Metro
- Houston-The Woodlands-Sugar Land, TX
- Population (ZIP)
- 31,642
- Household income
- $65,801
- Rent vs Own
- Severe rent burden
- 1821.0
Population outlook (Galveston County) Hauer SSP2
- Today (2025)
- 390,640 people
- By 2030
- 425,226 · +8.9%
- By 2040
- 493,765 · +26.4%
- By 2050
- 559,698 · +43.3%
- By 2075
- 719,260 · +84.1%
- By 2100
- 819,628 · +109.8%
Race, ethnicity, and origin ACS 2023
- Neighborhood character
- Diverse neighborhood (Simpson 0.66)
- Race & ethnicity
- White 41% Hispanic / Latino 38% Two or more races 20% Black 17% Asian 2%
- Hispanic origin (detail)
- Mexican 33% Puerto Rican 1%
- Common ancestry
- Lithuanian 2% Slovak 1% Italian 1%
- Foreign-born
- 9% · Canada, Vietnam
- Languages at home
- 72% English-only · Spanish 26% Other Indo-European 1%
Political lean MEDSL · Galveston
- 2024 margin
- Strong R (+27.4) · D 35.7% · R 63.1% · Other 1.2%
- 2008→2024 swing
- -7.9pp toward R · 2008: -19.5pp · 2024: -27.4pp
- All cycles
- 2024: R+27.4 2020: R+22.6 2016: R+22.6 2012: R+26.9 2008: R+19.5
Not yet ingested
- Civics
- —
Market trends
- HPI YoY
- ▼ -58.35%
- Current HPI
- 244.5809
- Rent YoY
- ▲ 4.91%
- Metro
- Houston-The Woodlands-Sugar Land, TX
- State GDP YoY
- ▲ 3.95%
- F500 in state
- 110
Industry mix (Fortune 500 HQ in TX)
| Industry | F500 HQs | Revenue |
|---|---|---|
| Energy | 16 | $1,198B |
|
||
| Technology | 5 | $198B |
|
||
| Engineering / Construction | 4 | $72B |
|
||
| Energy Services | 3 | $60B |
|
||
| Utilities | 3 | $41B |
|
||
| Healthcare | 2 | $330B |
|
||
Price history
+119.1% since first listed6 events — show timeline
- 2025-11-18 Listed $195,000 HARMLS
- 2019-09-23 Sold (Public Records) — Public Records
- 2019-09-20 Sold (MLS) — HARMLS
- 2019-08-23 Pending — HARMLS
- 2019-08-16 Pending — HARMLS
- 2019-08-03 Listed $89,000 HARMLS
Property tax history
+10.1%/yrLatest (2025): $5,432 · +21.8% YoY. Source: county tax records.
Cash-flow waterfall
monthlySold comps — $/sqft
last 12 mo · ≤1 miLoading sold comps…