 Multi-family
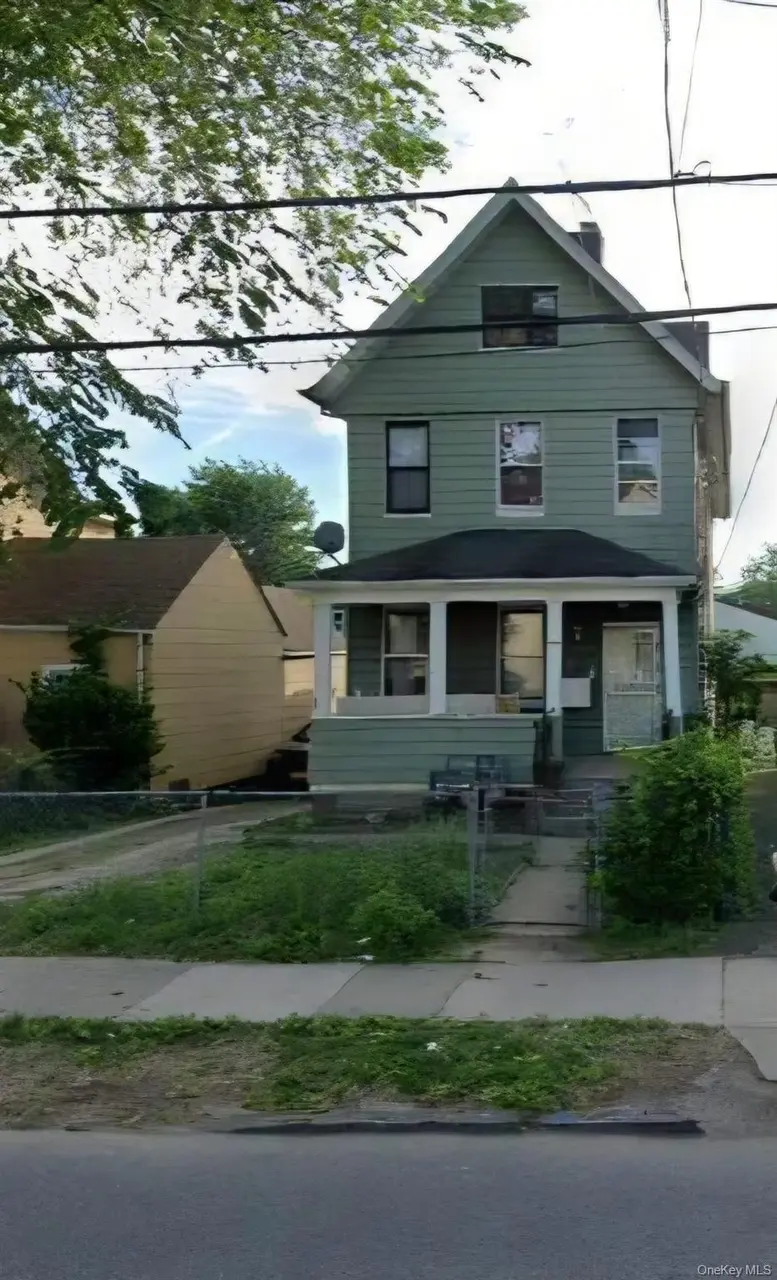
124 S 11th Ave · Mount Vernon, NY
Flood risk 1/10 · Minimal
- FEMA flood zone
- X (unshaded)
- Chance of flooding over 30 yrs
- 0.0%
- Est. flood insurance / yr
- $507 – $1,088
Fire risk 1/10 · Minimal
- Est. fire insurance / yr
- $691 – $1,283
Heat risk 6/10 · Moderate
- Hot days now (above 98°F)
- 7 days/yr
- Hot days in 30 yrs
- 15 days/yr
Wind risk 6/10 · Moderate
- Chance of severe wind over 30 yrs
- 27.0%
Air-quality risk 5/10 · Moderate
- Unhealthy air days now
- 6 days/yr
- Unhealthy air days in 30 yrs
- 8 days/yr
Risk factors via First Street. Map © Google.
Why this score? — see what drove the C grade
The composite is a weighted blend of 9 inputs, each scored 0–100. Each bar is that input's sub-score; the figure is the points it added to the 100-point composite (weight × sub-score).
- Cash flow +21.8/30.0
- ARV discount +7.5/15.0
- DSCR +7.0/10.0
- 1% rule +6.1/10.0
- Schools +3.7/10.0
- Livability +3.6/5.0
- Rent growth +3.3/5.0
- Condition / age +2.5/5.0
- Appreciation +0.0/10.0
$690,000
🖨 Deal sheet 📄 Offer letter ✓ Due diligence
Multi-family units
County records classify this as Multi-Family (2-4 Unit). Listing-text estimate: 1 unit. estimate disagrees with records
Listing remarks
Tremendous investment opportunity in the heart of Mount Vernon. This well-maintained three-unit property at 124 S 11th Ave features a total of 3 units first floor a spacious 2-bedroom/1-bathroom, second floor a recently updated 2 bedroom 2 bathroom and the third floor a one 1-bedroom/1-bathroom unit. Designed for easy management, the home boasts independent heating systems and hot water tanks for every apartment. With four electric meters (including a house meter) and three gas meters, tenants pay their own utilities. The property also includes a private driveway with parking for two vehicles. Schedule your appointment today to explore the incredible income potential!
Key facts
- Income potential
- Private driveway
- Well maintained
Tags
Property features AI
Exterior
- Parking: Driveway with parking for 2 vehicles; No carport
- Security: Other security features
- Utilities: Con-Edison electric service; Public sewer; Water connected and available; Natural gas connected and available; Electricity connected and available; Cable available and connected; Trash collection (public)
- Home design: Triplex; Property condition: Actual
- Construction: Other construction materials; Other foundation details; No other structures listed; Not waterfront
- Exterior features: No notable exterior features listed; Front yard, partial and perimeter fencing
Interior
- Bedrooms: One 1-bedroom unit; Two 2-bedroom units
- Flooring: Combination flooring
- Bathrooms: Four full bathrooms
- Heating & cooling: Baseboard heating (natural gas); Wall/window air conditioning units
- Interior features: Entrance foyer; Covered patio/porch
Neighborhood map
What this means for you Summary
Snapshot
- This is a 5-bed/4.0-bath multifamily listed at $690k.
Deal economics
- At list price, monthly cash flow is $1k ($13k/yr) — positive.
- The deal already cash-flows at list — no discount required.
- Meets the 1% rule at list price ($8k rent vs $690k).
- Recommended offer: $669k (3.0% below list) — sets the bar for market timing.
- Cap rate 8.2% vs local median 5.3% in Mount Vernon — top-decile yield for the area; either an underpriced asset or a hidden risk that comps aren't pricing in. Stress-test before assuming the spread holds.
Location & tenants
- Location reads 71/100 on livability (#397 in NY) — a middle-class / working-renter tenant base. Strengths: commute A+, health & safety A, employment B; Watch: crime D-, cost of living F.
- Mount Vernon School District (suburban): math 35% / reading 50% proficiency, ranked #485 of 590 in NY (top 82%) — families likely to look elsewhere, expect single-tenant / working-renter base with shorter leases; 62% free/reduced lunch — lower-income household profile, screen leases tightly.
- Zoned schools: Grimes School (math 17% / reading 37%, grade F, #1,786 of 2,108 statewide, top 86%, 411 students, 78% FRL); Benjamin Turner Middle School (math 8% / reading 32%, grade F, #678 of 729 statewide, top 94%, 196 students, 71% FRL); Mount Vernon High School (math 54% / reading 75%, grade B-, #776 of 1,100 statewide, top 73%, 1,094 students, 76% FRL).
- Market conditions: Rents rising (+3.4%/yr); 130 active listings in the ZIP; 8 comparable units currently listed for rent nearby; rentals at typical pace (median 24d on market — plan ~3-4 weeks tenant-placement turnaround); 954 units permitted in Westchester County in 2024 (649 in 5+ unit buildings).
- At $7,673/mo this rent would consume 152% of the median local household income ($61k/yr) (locally 2963% of renters already pay >50% of income on rent) — very limited rent-growth headroom before tenants either downsize or default.
Forward outlook
- Local home prices are declining (-3.0%/yr); year-one equity from $5k of loan paydown is wiped out by about $21k of value loss. Plan a longer hold.
- Westchester County population projected at +10% by 2050 — modest demand growth; plan on rents tracking national, not racing it.
Negotiation context
- It's been on market 45 days — a 3% lower offer ($669k) is reasonable based on typical stale-listing flexibility.
- 7 sale attempts since 29y ago with the ask held roughly flat each time — persistent listings suggest the price (not the market) is what's stuck; bring a comps-based counter.
- Current owner paid $80k; list at $690k implies a 762% gain — meaningful room to come down on a strong offer.
Risks & watch-outs
- Watch-outs: built in 1910 — expect roof / HVAC / electrical / plumbing capex.
- Climate carrying-cost: major wind risk, 27% chance of damaging wind over 30y; extreme-heat days projected 7→15/yr by 2055 (HVAC capex compounding) — expect insurance premiums to compound above CPI over the hold.
Questions for the listing agent
- It's been on market 45 days. Have you received any prior offers? Is the seller open to a 3% concession, seller financing, or rate buy-down credit?
- Built in 1910 — when were the roof, HVAC, electrical panel, plumbing, and water heater last replaced?
- Is there a deadline driving the sale (1031 exchange, divorce, estate, relocation)? That informs how much negotiation room exists.
- Crime grade is D in this area — have there been break-ins, vandalism, or insurance claims at this property in the last 3 years? What carrier currently insures it and at what premium?
- What's the average days-on-market for RENTAL listings here right now (not sales)? A rising rental-DOM trend means longer vacancies and softer asking-rent achievability than the comps imply.
- What's the recent tenant-quality profile in this submarket — average credit score on applications, eviction rate, late-payment / NSF rate, and stable-employment percentage? A property-management company in the area should have these aggregated.
- How much new apartment / multifamily construction is in the pipeline within 1–3 miles? Heavy new supply (>2% of stock underway) typically softens rents 12–24 months out; light construction supports rent growth.
Investment metrics
- 1% rule
- 1.11% ✓
- Cap rate
- 8.16%
- Cash-on-cash
- 6.68%
- DSCR
- 1.30
- GRM
- 7.5
CMA / ARV
No comps found within radius.
Show comp detail 12 sales within ~0.75 mi
| Address | Dist | Beds/Ba | Sqft | Sold | Price | $/sf | Match |
|---|---|---|---|---|---|---|---|
| 112 S 7th Ave | 0.21mi | 5/3.0 | 2,200 | 0mo | $445,000 | $202 | 73 |
| 4824 Robertson St | 0.41mi | 4/— (-1) | 1,975 | 2mo | $815,000 | $413 | 62 |
| 679 E 241st St | 0.48mi | 5/2.0 | 2,124 | 1mo | $800,000 | $377 | 56 |
| 14 S Terrace Ave | 0.47mi | 5/2.0 | — | 2mo | $685,000 | — | 56 |
| 28 Grove St | 0.41mi | 6/2.0 (+1) | — | 1mo | $600,000 | — | 54 |
| 2028 Pitman Ave | 0.69mi | 5/3.0 | 1,824 | 2mo | $770,000 | $422 | 50 |
| 4331 Wilder Ave | 0.61mi | 5/2.0 | 1,574 | 2mo | $803,000 | $510 | 50 |
| 350 S 2nd Ave | 0.62mi | 4/3.0 (-1) | 2,178 | 2mo | $465,000 | $213 | 48 |
| 58 Oak St | 0.56mi | 4/2.0 (-1) | 2,094 | 4mo | $595,000 | $284 | 46 |
| 132 East 4th St | 0.72mi | 6/2.0 (+1) | 2,800 | 0mo | $700,000 | $250 | 41 |
| 128 E 4th St | 0.71mi | 6/2.0 (+1) | — | 2mo | $770,000 | — | 40 |
| 507 S 6th Ave | 0.71mi | 4/2.0 (-1) | 1,674 | 4mo | $349,900 | $209 | 38 |
Match score weights: distance 35% · size 25% · config 20% · recency 20%. Top-matched comps best support the ARV.
Projected returns pro-forma
-3.0% appreciation · 3.37% rent growth · sell at horizon
- IRR
- -5.6%
- Equity multiple
- 0.79×
- Total profit
- $-40,211
- Equity at exit
- $102,881
- IRR
- 4.6%
- Equity multiple
- 1.34×
- Total profit
- $66,035
- Equity at exit
- $59,659
Cash invested: $193,200 (down + closing). Projections, not guarantees.
Landlord ↔ Tenant lean methodology
- Overall (STATE)
- 15 Strongly Tenant-Friendly
- State New York
- 15 Strongly Tenant-Friendly · D+10
- County
- — inherits STATE
- City
- — inherits STATE
ZIP-level market 10550
- Rents YoY
- 3.4%
- Active inventory
- 130
- Price-to-rent
- 21.7×
Monthly cashflow live
- Estimated rent
- $7,673 high interval (Pro) →
- Mortgage (P&I)
- −$3,618
- Tax from tax record
- −$1,080 /mo · $12,966/yr
- Insurance
- −$288
- HOA
- −$0
- Vacancy / Maint / Mgmt
- −$1,611
- Net cashflow
- $1,075
Break-even live
3-unit breakdown (identical units grouped — click to expand)
| Units | Beds | Baths | Est. rent |
|---|---|---|---|
| 2× units | 2 | 1 | $5,306 |
| #1 | 2 | 1 | $2,653 |
| #2 | 2 | 1 | $2,653 |
| 1× unit | 1 | 1 | $2,366 |
| Total (3 units) | $7,673 | ||
UW: 25.0% down · 7.5% · 30yr · 1.5% tax · 5.0% vac · 8.0% maint · 8.0% mgmt
Financing live
Cash to close
- Down payment
- $172,500
- Closing costs
- $20,700
- Reserves months
- —
- Total cash needed
- —
Loan-product check · same deal, 3 products live
Conventional
25% down · 7.5% · 30yr
- Down + closing
- —
- Monthly P&I
- —
- Monthly cashflow
- —
- DSCR
- —
- Eligible?
- —
Personal DTI + credit; lowest rate.
DSCR
20% down · 8.5% · 30yr
- Down + closing
- —
- Monthly P&I
- —
- Monthly cashflow
- —
- DSCR
- —
- Eligible?
- —
No personal income docs; deal must DSCR.
Hard money
10% down · 12.0% · 12mo
- Down + closing
- —
- Monthly P&I
- —
- Monthly cashflow
- —
- DSCR
- —
- Eligible?
- —
Short-term bridge; refi at stabilization.
Rent comps 8 comps
| Address | Beds | Baths | Sqft | Rent | $/sqft | DOM | Units | Dist |
|---|---|---|---|---|---|---|---|---|
| 310 S 7th Ave Mount Vernon, NY | 5.0 | 2.0 | 1000 | $4,800 | $4.80 | 24d | 1 | 0.40mi |
| 142 W 5th St Mount Vernon, NY | 6.0 | 2.0 | 1250 | $3,756 | $3.00 | 18d | 1 | 0.49mi |
| 16 Sherwood Ave Yonkers, NY | 4.0 | 1.0 | — | $3,711 | — | 43d | 1 | 0.69mi |
| 33 Union Ln Mount Vernon, NY | 5.0 | 1.0 | 1200 | $4,200 | $3.50 | 24d | 1 | 0.79mi |
| 33 Union Ln Unit 2 Mt Vernon, NY | 5.0 | 1.0 | — | $4,000 | — | 24d | 1 | 0.79mi |
| 218 Washington St Unit 2 Mt Vernon, NY | 4.0 | 2.0 | 950 | $3,900 | $4.11 | 24d | 1 | 0.84mi |
| 641 S 5th Ave Unit 2nd/3rd Floor Mt Vernon, NY | 5.0 | 2.0 | 1800 | $3,900 | $2.17 | 4d | 1 | 0.99mi |
| 222 Primrose Ave Unit 2 Mt Vernon, NY | 5.0 | 2.0 | 1900 | $5,250 | $2.76 | 18d | 1 | 1.19mi |
Listing history 32 events
-
2026-06-18days on market $690,000 Active 45 DOM
-
2026-06-17days on market $690,000 Active 44 DOM
-
2026-06-16days on market $690,000 Active 43 DOM
-
2026-06-15days on market $690,000 Active 42 DOM
-
2026-06-13days on market $690,000 Active 40 DOM
-
2026-06-10remarks 676-char remark
-
2026-06-09days on market $690,000 Active 36 DOM
-
2026-06-08days on market $690,000 Active 35 DOM
-
2026-06-07days on market $690,000 Active 34 DOM
-
2026-06-04days on market $690,000 Active 31 DOM
-
2026-06-03days on market $690,000 Active 30 DOM
-
2026-06-02days on market $690,000 Active 29 DOM
-
2026-06-01days on market $690,000 Active 28 DOM
-
2026-05-31days on market $690,000 Active 27 DOM
-
2026-05-14price $690,000
-
2026-05-04$724,900 Active
-
2024-04-23historical $2,100
-
2024-02-23$2,100
-
2022-03-18historical
-
2022-03-16price $749,900
-
2021-02-08$674,900 Active
-
2019-11-18historical
-
2019-09-03$624,900 Active
-
2017-07-23soldstatus $80,000 Sold
-
2016-11-19price $79,900
-
2016-08-05historical Pending
-
2016-07-22$94,900 Active
-
1998-09-29soldstatus $105,000
-
1998-08-11soldstatus $105,000
-
1998-08-11price $129,500
-
1998-04-01
-
1997-08-06$105,000
ⓘ Source: listings_history table (triggers on properties + properties_extension) + one-shot
backfill from property_details.listing_events for pre-trigger history.
Tax reassessment forecast NY · Partial reset (capped growth)
- Current annual tax
- $12,966 · $1,080/mo
- Projected year-2 tax
- $12,966 · $1,080/mo
- Expected delta
- $0/yr ($0/mo · 0.0%)
ⓘ Screening estimate from a state-policy table — verify with the county assessor before closing.
Climate risk First Street
- Flood 1/10 Low FEMA zone X (unshaded) · 0% chance over 30 yrs
- Wildfire 1/10 Low
- Heat 6/10 Major 7 d/yr ≥98°F today · 15 d/yr by 30 yrs out
- Wind 6/10 Major 27% chance of damaging wind over 30 yrs
- Air quality 5/10 Major 6 unhealthy d/yr today · 8 by 30 yrs out
Nearby sold comps map
Loading sold comps map…
Walkable amenities ~0.75 mi
Loading nearby amenities…
Taxation est. · year 1
- Rental income
- $92,076
- − Mortgage interest
- −$38,651
- − Property taxes
- −$12,966
- − Insurance
- −$3,450
- − Repairs & maintenance
- −$7,366
- − Management
- −$7,366
- − Depreciation
- −$20,073
- Taxable income
- $2,204
- Est. tax owed @ 24.0%
- −$529
- After-tax cash flow
- $12,374/yr
For passive investors: Depreciation is non-cash, so a rental often shows a tax loss while cash-flowing — sheltering income. Rental losses are passive: they offset passive income freely, and up to $25,000/yr can offset ordinary (W-2) income if you actively participate and your MAGI is under $100k (phasing out to $0 by $150k); unused losses carry forward. On sale, claimed depreciation is recaptured at up to 25%, and gains may owe capital-gains tax (a 1031 exchange can defer both). Figures are a year-1 estimate at your 24.0% rate — not tax advice; consult a CPA.
Schools (NCES district)
- District
- Mount Vernon School District
- NCES district ID
- 3620100
- Math proficiency
- 35% ▼ -3.00%
- Reading proficiency
- 50% ▲ 6.00%
- Median HH income
- $50,890
- Composite
- 36.59/100
- National rank
- #4631
- State rank
- #485 of 590 in NY
Livability — Mount Vernon
- Score
- 71/100
- State rank
- #397
- US rank
- #6876
Category grades
Schools grade is shown separately in the Schools card above.
Census & demographics
- Census place
- Mount Vernon, NY
- County
- Westchester County · 709,332 people
- City population
- 61,313
- Metro
- New York-Newark-Jersey City, NY-NJ-PA
- Population (ZIP)
- 38,972
- Household income
- $60,701
- Rent vs Own
- Severe rent burden
- 2963.0
Population outlook (Westchester County) Hauer SSP2
- Today (2025)
- 1,028,035 people
- By 2030
- 1,051,636 · +2.3%
- By 2040
- 1,098,520 · +6.9%
- By 2050
- 1,136,044 · +10.5%
- By 2075
- 1,196,925 · +16.4%
- By 2100
- 1,175,147 · +14.3%
Race, ethnicity, and origin ACS 2023
- Neighborhood character
- Predominantly Black (66%)
- Race & ethnicity
- Black 66% Hispanic / Latino 20% Two or more races 12% White 7% Asian 1%
- Hispanic origin (detail)
- Mexican 3% Puerto Rican 5% Dominican 4%
- Common ancestry
- Estonian 2% Hispanic 1% Russian 1%
- Foreign-born
- 34% · Canada, China, Jamaica
- Languages at home
- 73% English-only · Spanish 16% Other Indo-European 4% French/Haitian/Cajun 2%
Political lean MEDSL · Westchester
- 2024 margin
- Strong D (+26.3) · D 63.1% · R 36.9%
- 2008→2024 swing
- -1.3pp toward R · 2008: 27.6pp · 2024: 26.3pp
- All cycles
- 2024: D+26.3 2020: D+36.3 2016: D+32.8 2012: D+22.2 2008: D+27.6
Not yet ingested
- Civics
- —
Market trends
- HPI YoY
- ▼ -140.69%
- Current HPI
- 191.5235
- Rent YoY
- ▲ 3.37%
- Metro
- New York-Newark-Jersey City, NY-NJ-PA
- State GDP YoY
- ▲ 2.60%
- F500 in state
- 92
Industry mix (Fortune 500 HQ in NY)
| Industry | F500 HQs | Revenue |
|---|---|---|
| Financial Services | 10 | $950B |
|
||
| Consumer Goods | 9 | $162B |
|
||
| Insurance | 4 | $225B |
|
||
| Telecommunications | 2 | $144B |
|
||
| Pharmaceuticals | 2 | $112B |
|
||
| Media / Entertainment | 2 | $69B |
|
||
Price history
+557.1% since first listed18 events — show timeline
- 2026-05-14 Price Changed $690,000 OneKey® MLS as Distributed by MLS Grid
- 2026-05-04 Listed $724,900 OneKey® MLS as Distributed by MLS Grid
- 2024-04-23 Rental Removed $2,100 ONEKEY
- 2024-02-23 Listed for Rent $2,100 ONEKEY
- 2022-03-18 Listing Removed — OneKey® MLS as Distributed by MLS Grid
- 2022-03-16 Price Changed $749,900 OneKey® MLS as Distributed by MLS Grid
- 2021-02-08 Listed $674,900 OneKey® MLS as Distributed by MLS Grid
- 2019-11-18 Listing Removed — OneKey® MLS as Distributed by MLS Grid
- 2019-09-03 Listed $624,900 OneKey® MLS as Distributed by MLS Grid
- 2017-07-23 Sold (MLS) $80,000 OneKey® MLS as Distributed by MLS Grid
- 2016-11-19 Price Changed $79,900 OneKey® MLS as Distributed by MLS Grid
- 2016-08-05 Contingent — OneKey® MLS as Distributed by MLS Grid
- 2016-07-22 Listed $94,900 OneKey® MLS as Distributed by MLS Grid
- 1998-09-29 Sold (Public Records) $105,000 Public Records
- 1998-08-11 Price Changed $129,500 HGMLS
- 1998-08-11 Sold (MLS) $105,000 HGMLS
- 1998-04-01 Listed — HGMLS
- 1997-08-06 Listed $105,000 HGMLS
Property tax history
+2.2%/yrLatest (2025): $12,966 · +2.1% YoY. Source: county tax records.
Cash-flow waterfall
monthlySold comps — $/sqft
last 12 mo · ≤1 miLoading sold comps…