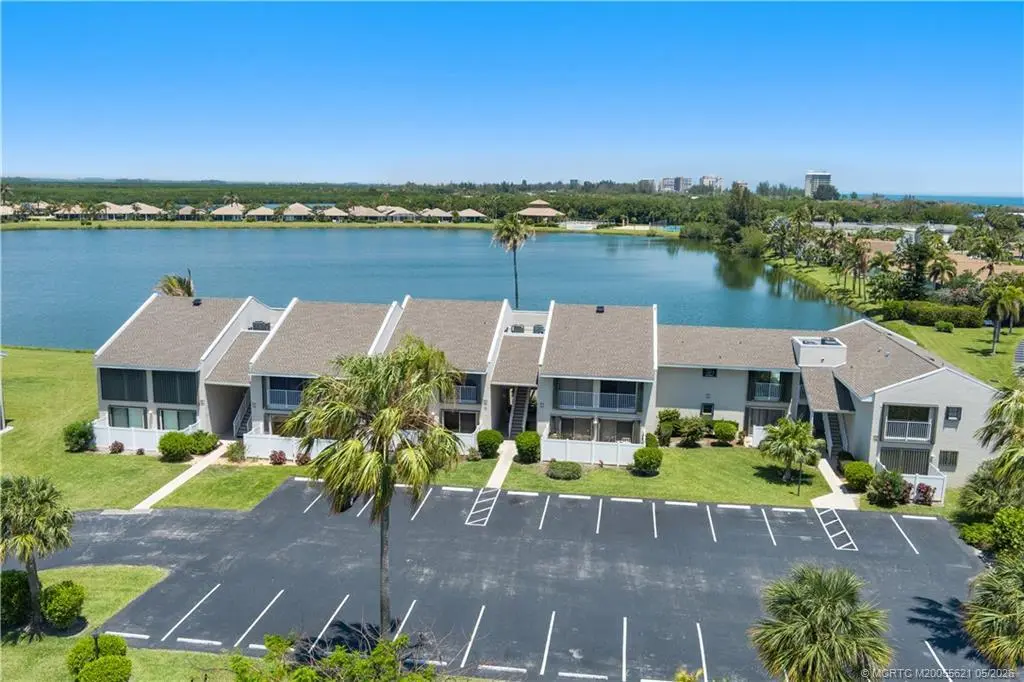
3206 S Lakeview Cir #1203 · Fort Pierce, FL
Flood risk 9/10 · Severe
- FEMA flood zone
- X (unshaded)
- Chance of flooding over 30 yrs
- 0.99%
- Est. flood insurance / yr
- $507 – $1,088
Fire risk 1/10 · Minimal
- Est. fire insurance / yr
- $947 – $1,759
Heat risk 10/10 · Severe
- Hot days now (above 106°F)
- 8 days/yr
- Hot days in 30 yrs
- 29 days/yr
Wind risk 10/10 · Severe
- Chance of severe wind over 30 yrs
- 99.0%
Air-quality risk 2/10 · Minimal
- Unhealthy air days now
- 2 days/yr
- Unhealthy air days in 30 yrs
- 2 days/yr
Risk factors via First Street. Map © Google.
Why this score? — see what drove the C- grade
The composite is a weighted blend of 9 inputs, each scored 0–100. Each bar is that input's sub-score; the figure is the points it added to the 100-point composite (weight × sub-score).
- Cash flow +16.6/30.0
- ARV discount +7.5/15.0
- 1% rule +6.7/10.0
- DSCR +5.1/10.0
- Rent growth +5.0/5.0
- Livability +3.8/5.0
- Schools +3.7/10.0
- Condition / age +2.5/5.0
- Appreciation +0.0/10.0
$285,000
🖨 Deal sheet (PDF) 📄 Offer letter ✓ Due diligence
Listing remarks
Hutchinson Island coastal gem! This gorgeous 2 BR 2 BA condo overlooking the lake is a perfect place to call home! Enjoy living where others vacation or create income as an investment property. 30-day rentals are allowed up to 12 times a year. Gorgeous 2nd-floor condo with breathtaking lake views! Open floor plan with vaulted ceilings, laminate flooring throughout, and a BRAND NEW coastal-inspired kitchen and spacious open porch! This amazing community offers a resort-style swimming pool, tennis, gated entrance, private deeded beach access, and marina with dock sales and rentals too! Tranquil island escape with wide, uncrowded beaches, ocean breezes & coastal charm! No age restrictio
Key facts
- Open floor plan
- Lake views
- Resort style pool
Tags
Property features AI
Finance
- Other: Lot approximately 9.95 acres
- Financial info: Pets allowed (number and size limits apply)
- HOA & community: Homeowners association with fees; Association fee includes insurance, grounds and structure maintenance, parking, pool(s), reserve fund, road maintenance, sewer, trash and water
Exterior
- Parking: Assigned parking; Common parking; Open parking
- Security: Gated community
- Utilities: Public water; Public sewer
- Home design: 2 stories; Resale property
- Construction: Block, concrete and stucco construction
- Exterior features: Gated community; Community pool; Street lights; Sidewalks; Tennis courts; Residential zoning
Interior
- Kitchen: Kitchen on main level (approx. 12 x 12); Electric range; Dishwasher; Refrigerator
- Bedrooms: 2 possible bedrooms; Bedroom on main level (approx. 12 x 11)
- Flooring: Laminate; Tile
- Bathrooms: 2 full bathrooms
- Heating & cooling: Central heating; Central air conditioning
- Interior features: Cathedral ceilings; Living/Dining room
- Laundry & utility: Washer; Dryer
Neighborhood map
What this means for you Summary
Snapshot
- This is a 2-bed/2.0-bath condo listed at $285k.
Deal economics
- At list price, monthly cash flow is $104 ($1k/yr) — positive.
- The deal already cash-flows at list — no discount required.
- Meets the 1% rule at list price ($3k rent vs $285k).
- Recommended offer: $276k (3.0% below list) — sets the bar for market timing.
- Cap rate 7.0% vs local median 3.7% in Fort Pierce — top-decile yield for the area; either an underpriced asset or a hidden risk that comps aren't pricing in. Stress-test before assuming the spread holds.
Location & tenants
- Location reads 76/100 on livability (#226 in FL, #3,360 nationally) — a middle-class / working-renter tenant base. Strengths: commute A+, cost of living A+, housing A+; Watch: crime D+, schools D, amenities F.
- St. Lucie (urban): math 40% / reading 48% proficiency, ranked #51 of 73 in FL (top 70%) — families likely to look elsewhere, expect single-tenant / working-renter base with shorter leases.
- Market conditions: Rents rising fast (+13.6%/yr); 382 active listings in the ZIP; 29 comparable units currently listed for rent nearby; rentals at typical pace (median 24d on market — plan ~3-4 weeks tenant-placement turnaround); solid renter incomes; 4,868 units permitted in St. Lucie County in 2024 (268 in 5+ unit buildings).
- This rent runs 42% of the median local income ($95k/yr) — at the standard rent-burdened threshold; future hikes will face affordability resistance.
Forward outlook
- Local home prices are declining (-3.0%/yr); year-one equity from $2k of loan paydown is wiped out by about $9k of value loss. Plan a longer hold.
- St. Lucie County population projected at +20% by 2050 — long-run rental-demand tailwind backs the buy-and-hold thesis.
- At projected returns (-3.0% appreciation + 8.0% rent growth), your $80k cash investment doubles in ~10 years — after that, you're playing with house money.
Negotiation context
- It's been on market 36 days — a 3% lower offer ($276k) is reasonable based on typical stale-listing flexibility.
- Current owner paid $149k; list at $285k implies a 91% gain — meaningful room to come down on a strong offer.
Risks & watch-outs
- Watch-outs: flood insurance adds $66/mo; HOA is 23% of rent.
- Climate carrying-cost: severe flood risk; severe wind risk, 99% chance of damaging wind over 30y; extreme-heat days projected 8→29/yr by 2055 (HVAC capex compounding) — expect insurance premiums to compound above CPI over the hold.
Questions for the listing agent
- It's been on market 36 days. Have you received any prior offers? Is the seller open to a 3% concession, seller financing, or rate buy-down credit?
- What's the actual annual flood-insurance premium (NFIP or private), and is the property in a SFHA with mandatory coverage?
- What does the HOA fee cover, when was the last increase, and are there any pending special assessments or reserve-fund shortfalls?
- Any open or pending special assessments — roof, HVAC, plumbing, elevator, façade? What's the per-unit balance and payoff schedule, and is the seller paying it off at close or rolling it to the buyer?
- Is there a deadline driving the sale (1031 exchange, divorce, estate, relocation)? That informs how much negotiation room exists.
- Schools are D-rated, which usually means shorter tenancies and higher turnover. Who's the typical renter profile here, and what's been the actual vacancy rate?
- Crime grade is D in this area — have there been break-ins, vandalism, or insurance claims at this property in the last 3 years? What carrier currently insures it and at what premium?
- What's the average days-on-market for RENTAL listings here right now (not sales)? A rising rental-DOM trend means longer vacancies and softer asking-rent achievability than the comps imply.
- What's the recent tenant-quality profile in this submarket — average credit score on applications, eviction rate, late-payment / NSF rate, and stable-employment percentage? A property-management company in the area should have these aggregated.
- How much new apartment / multifamily construction is in the pipeline within 1–3 miles? Heavy new supply (>2% of stock underway) typically softens rents 12–24 months out; light construction supports rent growth.
Investment metrics
- 1% rule
- 1.17% ✓
- Cap rate
- 7.01%
- Cash-on-cash
- 2.57%
- DSCR
- 1.11
- GRM
- 7.1
CMA / ARV
No comps found within radius.
Projected returns pro-forma
-3.0% appreciation · 8.0% rent growth · sell at horizon
- IRR
- -6.9%
- Equity multiple
- 0.73×
- Total profit
- $-21,506
- Equity at exit
- $42,494
- IRR
- 9.1%
- Equity multiple
- 1.90×
- Total profit
- $71,729
- Equity at exit
- $24,642
Cash invested: $79,800 (down + closing). Projections, not guarantees.
Landlord ↔ Tenant lean methodology
- Overall (STATE)
- 87 Strongly Landlord-Friendly
- State Florida
- 87 Strongly Landlord-Friendly · R+3
- County
- — inherits STATE
- City
- — inherits STATE
ZIP-level market 34949
- Home prices YoY
- -7.5%
- Rents YoY
- 13.6%
- Active inventory
- 382
- Price-to-rent
- 7.1×
Monthly cashflow live
- Estimated rent
- $3,338 high interval (Pro) →
- Mortgage (P&I)
- −$1,495
- Tax from tax record
- −$83 /mo · $999/yr
- Insurance
- −$119
- Flood insurance flood zone
- −$66 /mo · $798/yr
- HOA
- −$770
- Vacancy / Maint / Mgmt
- −$701
- Net cashflow
- $104
Break-even live
Sensitivity live
| Price | -10% $266 | -5% $185 | +0% $104 | +5% $24 | +10% $-57 |
|---|---|---|---|---|---|
| Rent | -10% $-160 | -5% $-28 | +0% $104 | +5% $236 | +10% $368 |
| Rate | -1.0pp $248 | -0.5pp $177 | base $104 | +0.5pp $30 | +1.0pp $-45 |
UW: 25.0% down · 7.5% · 30yr · 1.5% tax · 5.0% vac · 8.0% maint · 8.0% mgmt
Financing live
Cash to close
- Down payment
- $71,250
- Closing costs
- $8,550
- Reserves months
- —
- Total cash needed
- —
Loan-product check · same deal, 3 products live
Conventional
25% down · 7.5% · 30yr
- Down + closing
- —
- Monthly P&I
- —
- Monthly cashflow
- —
- DSCR
- —
- Eligible?
- —
Personal DTI + credit; lowest rate.
DSCR
20% down · 8.5% · 30yr
- Down + closing
- —
- Monthly P&I
- —
- Monthly cashflow
- —
- DSCR
- —
- Eligible?
- —
No personal income docs; deal must DSCR.
Hard money
10% down · 12.0% · 12mo
- Down + closing
- —
- Monthly P&I
- —
- Monthly cashflow
- —
- DSCR
- —
- Eligible?
- —
Short-term bridge; refi at stabilization.
Rent comps 29 comps
| Address | Beds | Baths | Sqft | Rent | $/sqft | DOM | Units | Dist |
|---|---|---|---|---|---|---|---|---|
| 3206 S Lakeview Cir #1105 Hutchinson Island, FL | 2.0 | 2.0 | 1080 | $2,500 | $2.31 | 21d | 1 | 0.02mi |
| 3100 North Highway A1A Unit Pco5 Fort Pierce, FL | 2.0 | 2.0 | 1207 | $4,000 | $3.31 | 24d | 1 | 0.18mi |
| 3120 N Highway A1A #1302 Hutchinson Island, FL | 3.0 | 2.0 | 1867 | $6,000 | $3.21 | 24d | 1 | 0.21mi |
| 3150 N Highway A1A #902 Hutchinson Island, FL | 3.0 | 2.0 | 1867 | $3,800 | $2.04 | 24d | 1 | 0.21mi |
| 3150 North Highway A1A Apt 1101N Fort Pierce, FL | 2.0 | 2.0 | 1800 | $3,700 | $2.06 | 24d | 1 | 0.21mi |
| 3200 N Highway A1A #1208 Hutchinson Island, FL | 2.0 | 2.0 | 1040 | $3,200 | $3.08 | 24d | 1 | 0.26mi |
| 3200 N Highway A1A #209 Hutchinson Island, FL | 2.0 | 2.0 | 1040 | $2,800 | $2.69 | 24d | 1 | 0.26mi |
| 2800 N Highway A1A Hutchinson Island, FL | 2.0 | 2.0 | 1373 | $3,972 | $2.89 | 24d | 6 | 0.33mi |
| 1002 Shorewinds Dr Apt B Fort Pierce, FL | 2.0 | 2.5 | 1088 | $2,250 | $2.07 | 24d | 1 | 0.38mi |
| 2700 N Highway A1A Hutchinson Island, FL | 2.0 | 2.0 | 1470 | $3,750 | $2.55 | 14d | 3 | 0.38mi |
| 3870 Jimmy Buffett Memorial Hwy Unit 906 Fort Pierce, FL | 2.0 | 2.0 | 1239 | $3,500 | $2.82 | 24d | 1 | 0.97mi |
| 3870 North Highway A1A Ph 6 Fort Pierce, FL | 2.0 | 2.0 | 1395 | $3,800 | $2.72 | 24d | 1 | 0.98mi |
| 3870 N Highway A1A #304 Hutchinson Island, FL | 2.0 | 2.0 | 1187 | $5,500 | $4.63 | 24d | 1 | 0.98mi |
| 3870 N Highway A1A #102 Hutchinson Island, FL | 2.0 | 2.0 | 1187 | $3,350 | $2.82 | 24d | 1 | 0.98mi |
| 3870 N Highway A1A #604 Hutchinson Island, FL | 2.0 | 2.0 | 1187 | $5,000 | $4.21 | 24d | 1 | 0.98mi |
| 3870 N Highway A1A #202 Fort Pierce, FL | 2.0 | 2.0 | 1187 | $3,000 | $2.53 | 24d | 1 | 0.98mi |
| 3870 N Highway A1A #301 Fort Pierce, FL | 2.0 | 2.0 | 1239 | $2,600 | $2.10 | 24d | 1 | 0.98mi |
| 3880 N Highway A1A #802 Hutchinson Island, FL | 2.0 | 2.0 | 1405 | $4,500 | $3.20 | 24d | 1 | 0.99mi |
| 4200 N Highway A1A #413 Hutchinson Island, FL | 2.0 | 2.0 | 1053 | $3,000 | $2.85 | 24d | 1 | 1.41mi |
| 4200 N Highway A1A #1111 Hutchinson Island, FL | 2.0 | 2.0 | 1053 | $3,800 | $3.61 | 24d | 1 | 1.41mi |
| 4200 N Highway A1A #215 Hutchinson Island, FL | 2.0 | 2.0 | 1053 | $2,300 | $2.18 | 14d | 1 | 1.41mi |
| 4225 N Highway A1A #17 Hutchinson Island, FL | 2.0 | 1.5 | 1234 | $2,500 | $2.03 | 24d | 1 | 1.44mi |
| 4225 N Highway A1A #20 Hutchinson Island, FL | 2.0 | 1.5 | 1234 | $3,000 | $2.43 | 24d | 1 | 1.44mi |
| 4225 N Highway A1A #18 Hutchinson Island, FL | 2.0 | 1.5 | 1234 | $2,400 | $1.94 | 24d | 1 | 1.44mi |
| 4250 N Highway A1A #805 Fort Pierce, FL | 2.0 | 2.0 | 1053 | $3,300 | $3.13 | 24d | 1 | 1.45mi |
| 4250 N Highway A1A #302 Hutchinson Island, FL | 2.0 | 2.0 | 1053 | $2,300 | $2.18 | 24d | 1 | 1.45mi |
| 4250 N Highway A1A #705 Hutchinson Island, FL | 2.0 | 2.0 | 1053 | $2,750 | $2.61 | 24d | 1 | 1.45mi |
| 4250 N Highway A1A #1005 Hutchinson Island, FL | 2.0 | 2.0 | 1050 | $5,300 | $5.05 | 24d | 1 | 1.45mi |
| 4275 Jimmy Buffett Memorial Hwy Unit 1546254P Fort Pierce, FL | 2.0 | 2.0 | 1097 | $4,838 | $4.41 | 14d | 1 | 1.47mi |
HOA detail condo
- Monthly dues
- $770 · $9,240/yr
- Likely covers
- poolsecurity
- Assessments
- None detected in remarks — confirm with the listing agent.
Listing history 20 events
-
2026-06-18days on market $285,000 Active 36 DOM
-
2026-06-17days on market $285,000 Active 35 DOM
-
2026-06-16days on market $285,000 Active 34 DOM
-
2026-06-15days on market $285,000 Active 33 DOM
-
2026-06-14days on market $285,000 Active 31 DOM
-
2026-06-13days on market $285,000 Active 30 DOM
-
2026-06-10days on market $285,000 Active 28 DOM
-
2026-06-09days on market $285,000 Active 27 DOM
-
2026-06-08days on market $285,000 Active 26 DOM
-
2026-06-07days on market $285,000 Active 25 DOM
-
2026-06-05days on market $285,000 Active 22 DOM
-
2026-06-03days on market $285,000 Active 21 DOM
-
2026-06-02days on market $285,000 Active 20 DOM
-
2026-06-01days on market $285,000 Active 19 DOM
-
2026-05-31days on market $285,000 Active 18 DOM
-
2026-05-30days on market $285,000 Active 17 DOM
-
2026-05-12$285,000 Active
-
2019-06-28soldstatus $149,000
-
2005-11-09soldstatus $310,000
-
1986-10-01soldstatus $80,000
ⓘ Source: listings_history table (triggers on properties + properties_extension) + one-shot
backfill from property_details.listing_events for pre-trigger history.
Tax reassessment forecast FL · Resets to sale price
- Current annual tax
- $999 · $83/mo
- Projected year-2 tax
- $2,366 · $197/mo
- Expected delta
- +$1,366/yr (+$114/mo · 136.8%)
ⓘ Screening estimate from a state-policy table — verify with the county assessor before closing.
Climate risk First Street
- Flood 9/10 Extreme FEMA zone X (unshaded) · 99% chance over 30 yrs
- Wildfire 1/10 Low
- Heat 10/10 Extreme 8 d/yr ≥106°F today · 29 d/yr by 30 yrs out
- Wind 10/10 Extreme 99% chance of damaging wind over 30 yrs
- Air quality 2/10 Low 2 unhealthy d/yr today · 2 by 30 yrs out
Nearby sold comps map
Loading sold comps map…
Walkable amenities ~0.75 mi
Loading nearby amenities…
Taxation est. · year 1
- Rental income
- $40,060
- − Mortgage interest
- −$15,964
- − Property taxes
- −$999
- − Insurance
- −$2,222
- − Repairs & maintenance
- −$3,205
- − Management
- −$3,205
- − HOA
- −$9,240
- − Depreciation
- −$8,291
- Taxable loss
- −$3,067
- Est. tax savings @ 24.0%
- +$736
- After-tax cash flow
- $1,987/yr
For passive investors: Depreciation is non-cash, so a rental often shows a tax loss while cash-flowing — sheltering income. Rental losses are passive: they offset passive income freely, and up to $25,000/yr can offset ordinary (W-2) income if you actively participate and your MAGI is under $100k (phasing out to $0 by $150k); unused losses carry forward. On sale, claimed depreciation is recaptured at up to 25%, and gains may owe capital-gains tax (a 1031 exchange can defer both). Figures are a year-1 estimate at your 24.0% rate — not tax advice; consult a CPA.
Schools (NCES district)
- District
- St. Lucie
- NCES district ID
- 1201770
- Math proficiency
- 40% ▼ -11.00%
- Reading proficiency
- 48% ▼ -4.00%
- Median HH income
- $44,737
- Composite
- 37.28/100
- National rank
- #4449
- State rank
- #51 of 73 in FL
Livability — Fort Pierce
- Score
- 76/100
- State rank
- #226
- US rank
- #3360
Category grades
Schools grade is shown separately in the Schools card above.
Census & demographics
- County
- Saint Lucie County · 337,150 people
- City population
- 78,556
- Metro
- Port St. Lucie, FL
- Population (ZIP)
- 7,470
- Household income
- $94,949
- Rent vs Own
- Severe rent burden
- 265.0
Population outlook (St. Lucie County) Hauer SSP2
- Today (2025)
- 338,016 people
- By 2030
- 355,687 · +5.2%
- By 2040
- 385,521 · +14.1%
- By 2050
- 406,106 · +20.1%
- By 2075
- 441,054 · +30.5%
- By 2100
- 436,885 · +29.2%
Race, ethnicity, and origin ACS 2023
- Neighborhood character
- Predominantly White (90%)
- Race & ethnicity
- White 90% Hispanic / Latino 7% Two or more races 6%
- Hispanic origin (detail)
- Cuban 3%
- Common ancestry
- Romanian 7% Lithuanian 6% Italian 5%
- Foreign-born
- 7% · Canada
- Languages at home
- 91% English-only · Spanish 4% German/W. Germanic 1% Russian/Polish/Slavic 1%
Political lean MEDSL · St. Lucie
- 2024 margin
- Lean R (+9.1) · D 45.1% · R 54.2%
- 2008→2024 swing
- -21.2pp toward R · 2008: 12.1pp · 2024: -9.1pp
- All cycles
- 2024: R+9.1 2020: R+1.6 2016: R+2.5 2012: D+7.9 2008: D+12.1
Not yet ingested
- Civics
- —
Market trends
- HPI YoY
- ▼ -48.89%
- Current HPI
- 601.12
- Rent YoY
- ▲ 13.64%
- Metro
- Port St. Lucie, FL
- State GDP YoY
- ▲ 3.28%
- F500 in state
- 36
Industry mix (Fortune 500 HQ in FL)
| Industry | F500 HQs | Revenue |
|---|---|---|
| Industrial Technology | 2 | $29B |
|
||
| Insurance | 2 | $17B |
|
||
| Retail | 1 | $60B |
|
||
| Technology Distribution | 1 | $58B |
|
||
| Homebuilding | 1 | $35B |
|
||
| Technology Manufacturing | 1 | $35B |
|
||
Price history
+256.2% since first listed4 events — show timeline
- 2026-05-12 Listed $285,000 MCRTC
- 2019-06-28 Sold (Public Records) $149,000 Public Records
- 2005-11-09 Sold (Public Records) $310,000 Public Records
- 1986-10-01 Sold (Public Records) $80,000 Public Records
Property tax history
-5.8%/yrLatest (2025): $999 · +4.6% YoY. Source: county tax records.
Cash-flow waterfall
monthlySold comps — $/sqft
last 12 mo · ≤1 miLoading sold comps…