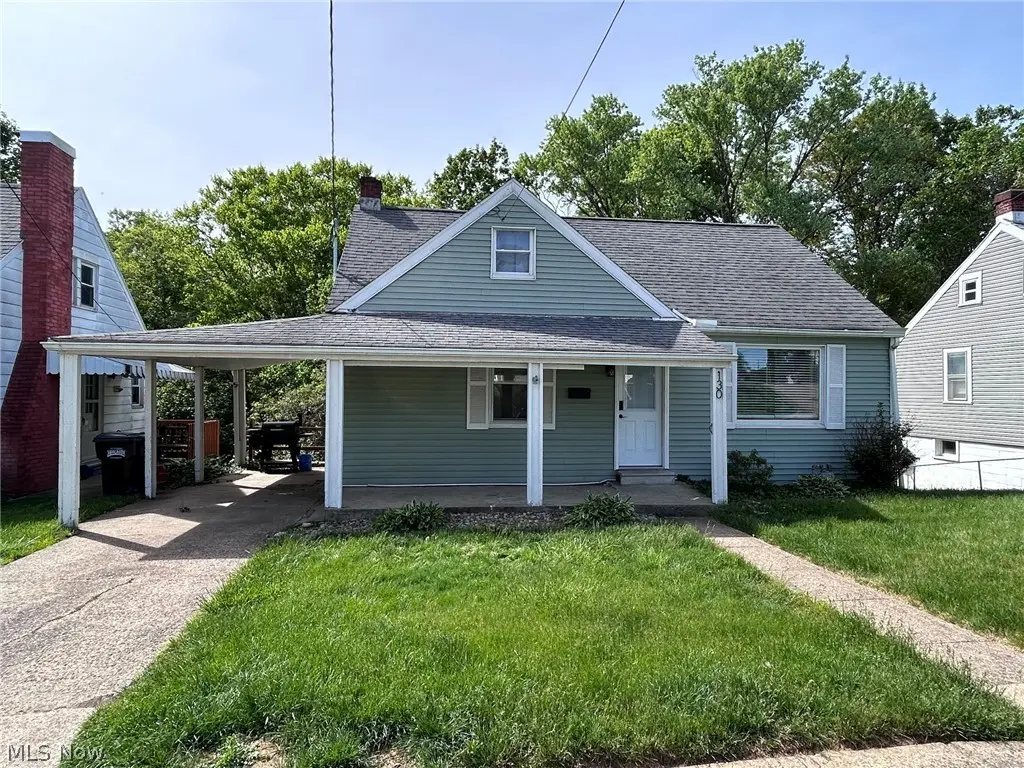
130 Alta St · Marietta, OH
Flood risk 1/10 · Minimal
- FEMA flood zone
- X (unshaded)
- Chance of flooding over 30 yrs
- 0.0%
- Est. flood insurance / yr
- $473 – $860
Fire risk 1/10 · Minimal
- Est. fire insurance / yr
- $713 – $1,323
Heat risk 4/10 · Minor
- Hot days now (above 101°F)
- 7 days/yr
- Hot days in 30 yrs
- 18 days/yr
Wind risk 2/10 · Minimal
- Chance of severe wind over 30 yrs
- 1.0%
Air-quality risk 2/10 · Minimal
- Unhealthy air days now
- 0 days/yr
- Unhealthy air days in 30 yrs
- 1 days/yr
Risk factors via First Street. Map © Google.
Why this score? — see what drove the B grade
The composite is a weighted blend of 9 inputs, each scored 0–100. Each bar is that input's sub-score; the figure is the points it added to the 100-point composite (weight × sub-score).
- Cash flow +26.9/30.0
- ARV discount +15.0/15.0
- DSCR +9.3/10.0
- 1% rule +6.4/10.0
- Livability +4.0/5.0
- Schools +3.5/10.0
- Rent growth +2.5/5.0
- Condition / age +2.5/5.0
- Appreciation +0.0/10.0
$164,500
🖨 Deal sheet 📄 Offer letter ✓ Due diligence
Listing remarks MLS
Very cute home with lots of updates. Siding, windows, roof, electric have all been updated. Newer eat-in kitchen, laundry room off kitchen with exit to back yard. Laundry could be moved back into the basement, which is a walkout basement to back yard. 2 first floor bedrooms with one offering a half bath, 2 bedrooms on second floor. Lots goes past fenced yard, into the woods. This house does offer all first floor living, if needed.
Key facts
- Updated siding
- Updated windows
- Updated electric
Tags
Property features AI
Exterior
- Parking: Carport (1 space); Off-street paved parking
- Utilities: Public water; Public sewer
- Home design: Single-story main level with additional rooms on second floor; Updated/remodeled condition; Facade with vinyl and wood siding
- Construction: Built (year per assessor); Block foundation; Asphalt/fiberglass roof
- Exterior features: Front porch; Back yard; Partially wooded lot; Partial chain-link fencing
Interior
- Kitchen: Range; Dishwasher; Refrigerator
- Bedrooms: Two main-level bedrooms; Additional bedrooms on the second floor
- Flooring: Carpet in some upstairs bedrooms
- Bathrooms: One full bathroom; One half bathroom
- Heating & cooling: Forced air gas heating; Central air conditioning
- Interior features: Eat-in kitchen; Full unfinished walk-out basement
- Laundry & utility: Washer and dryer included; Main-level laundry (currently a bedroom used as laundry room that can be converted back)
Neighborhood map
What this means for you Summary
Snapshot
- This is a 4-bed/1.5-bath single-family listed at $164k.
Deal economics
- At list price, monthly cash flow is $453 ($5k/yr) — positive.
- The deal already cash-flows at list — no discount required.
- Meets the 1% rule at list price ($2k rent vs $164k).
- Recommended offer: $160k (3.0% below list) — sets the bar for market timing.
- Cap rate 9.6% vs local median 6.3% in Marietta — top-decile yield for the area; either an underpriced asset or a hidden risk that comps aren't pricing in. Stress-test before assuming the spread holds.
Location & tenants
- Location reads 80/100 on livability (#127 in OH, #1,845 nationally) — a professional / high-income tenant draw. Strengths: cost of living A+, housing A+, health & safety A+; Watch: commute F, employment D-.
- Marietta City (town): math 35% / reading 49% proficiency, ranked #534 of 656 in OH (top 81%) — families likely to look elsewhere, expect single-tenant / working-renter base with shorter leases.
- Market conditions: 118 active listings in the ZIP; 1 comparable units currently listed for rent nearby; 3 units permitted in Washington County in 2024 (0 in 5+ unit buildings).
- This rent runs 37% of the median local income ($60k/yr) — at the standard rent-burdened threshold; future hikes will face affordability resistance.
Forward outlook
- Local home prices are declining (-3.0%/yr); year-one equity from $1k of loan paydown is wiped out by about $5k of value loss. Plan a longer hold.
- Washington County population projected at -12% by 2050 — secular population decline; favor cash flow + early exit over multi-decade hold.
- At projected returns (-3.0% appreciation + 3.0% rent growth), your $46k cash investment doubles in ~10 years — after that, you're playing with house money.
Negotiation context
- It's been on market 34 days — a 3% lower offer ($160k) is reasonable based on typical stale-listing flexibility.
- 2 sale attempts since 7y ago with the ask held roughly flat each time — persistent listings suggest the price (not the market) is what's stuck; bring a comps-based counter.
- Current owner paid $99k; list at $164k implies a 66% gain — meaningful room to come down on a strong offer.
Risks & watch-outs
- Watch-outs: built in 1947 — expect roof / HVAC / electrical / plumbing capex.
Questions for the listing agent
- It's been on market 34 days. Have you received any prior offers? Is the seller open to a 3% concession, seller financing, or rate buy-down credit?
- Built in 1947 — when were the roof, HVAC, electrical panel, plumbing, and water heater last replaced?
- Is there a deadline driving the sale (1031 exchange, divorce, estate, relocation)? That informs how much negotiation room exists.
- Schools are B-rated — typically a magnet for longer-tenancy family renters. What's the average tenant stay here, and is there a school-zone premium baked into asking?
- What's the average days-on-market for RENTAL listings here right now (not sales)? A rising rental-DOM trend means longer vacancies and softer asking-rent achievability than the comps imply.
- What's the recent tenant-quality profile in this submarket — average credit score on applications, eviction rate, late-payment / NSF rate, and stable-employment percentage? A property-management company in the area should have these aggregated.
- How much new for-sale + rental construction is in the pipeline within 1–3 miles? Heavy new supply typically softens prices + rents 12–24 months out; constrained supply supports both.
Investment metrics
- 1% rule
- 1.14% ✓
- Cap rate
- 9.60%
- Cash-on-cash
- 11.81%
- DSCR
- 1.53
- GRM
- 7.3
CMA / ARV
- ARV (on-the-fly)
- $223,488
- Comps found
- 10
Show comp detail 10 sales within ~0.75 mi
| Address | Dist | Beds/Ba | Sqft | Sold | Price | $/sf | Match |
|---|---|---|---|---|---|---|---|
| 101 Coventry Rd | 0.13mi | 4/2.5 | 2,283 (-1%) | 12mo | $291,000 | $127 | 78 |
| 124 High St | 0.13mi | 4/2.5 | 2,020 (-12%) | 2mo | $250,000 | $124 | 68 |
| 106 Wyoming Rd | 0.34mi | 4/2.0 | 2,360 (+2%) | 16mo | $269,000 | $114 | 65 |
| 121 High St | 0.12mi | 5/4.0 (+1) | 2,224 (-4%) | 15mo | $275,000 | $124 | 62 |
| 117 Franklin St | 0.68mi | 3/1.5 (-1) | 2,312 (+0%) | 8mo | $195,000 | $84 | 56 |
| 203 Sacra Via | 0.74mi | 4/2.0 | 2,467 (+7%) | 9mo | $240,000 | $97 | 44 |
| 721 Front St | 0.66mi | 3/2.0 (-1) | 2,490 (+8%) | 6mo | $172,000 | $69 | 44 |
| 108 Knox St | 0.64mi | 4/2.5 | 2,407 (+4%) | 21mo | $138,000 | $57 | 41 |
| 726 Front St | 0.70mi | 4/1.5 | 2,160 (-6%) | 21mo | $155,000 | $72 | 40 |
| 711 Second St | 0.72mi | 4/2.5 | 2,024 (-12%) | 16mo | $165,000 | $82 | 29 |
Match score weights: distance 35% · size 25% · config 20% · recency 20%. Top-matched comps best support the ARV.
Projected returns pro-forma
-3.0% appreciation · 3.0% rent growth · sell at horizon
- IRR
- 1.2%
- Equity multiple
- 1.05×
- Total profit
- $2,184
- Equity at exit
- $24,527
- IRR
- 10.8%
- Equity multiple
- 1.85×
- Total profit
- $38,933
- Equity at exit
- $14,223
Cash invested: $46,060 (down + closing). Projections, not guarantees.
Landlord ↔ Tenant lean methodology
- Overall (STATE)
- 73 Landlord-Friendly
- State Ohio
- 73 Landlord-Friendly · R+6
- County
- — inherits STATE
- City
- — inherits STATE
ZIP-level market 45750
- Home prices YoY
- -32.4%
- Active inventory
- 118
- Price-to-rent
- 7.3×
Monthly cashflow live
- Estimated rent
- $1,877 medium interval (Pro) →
- Mortgage (P&I)
- −$863
- Tax from tax record
- −$98 /mo · $1,175/yr
- Insurance
- −$69
- HOA
- −$0
- Vacancy / Maint / Mgmt
- −$394
- Net cashflow
- $453
Break-even live
UW: 25.0% down · 7.5% · 30yr · 1.5% tax · 5.0% vac · 8.0% maint · 8.0% mgmt
Financing live
Cash to close
- Down payment
- $41,125
- Closing costs
- $4,935
- Reserves months
- —
- Total cash needed
- —
Loan-product check · same deal, 3 products live
Conventional
25% down · 7.5% · 30yr
- Down + closing
- —
- Monthly P&I
- —
- Monthly cashflow
- —
- DSCR
- —
- Eligible?
- —
Personal DTI + credit; lowest rate.
DSCR
20% down · 8.5% · 30yr
- Down + closing
- —
- Monthly P&I
- —
- Monthly cashflow
- —
- DSCR
- —
- Eligible?
- —
No personal income docs; deal must DSCR.
Hard money
10% down · 12.0% · 12mo
- Down + closing
- —
- Monthly P&I
- —
- Monthly cashflow
- —
- DSCR
- —
- Eligible?
- —
Short-term bridge; refi at stabilization.
Rent comps 1 comps
| Address | Beds | Baths | Sqft | Rent | $/sqft | DOM | Units | Dist |
|---|---|---|---|---|---|---|---|---|
| 803 3rd St Marietta, OH | 3.0 | 2.0 | 1659 | $2,000 | $1.21 | 43d | 1 | 0.84mi |
Listing history 11 events
-
2026-06-02status $164,500 Pending 34 DOM
-
2026-06-01days on market $164,500 Contingent 34 DOM
-
2026-05-31days on market $164,500 Contingent 33 DOM
-
2026-05-30days on market $164,500 Contingent 32 DOM
-
2026-04-29historical Contingent
-
2026-04-28$164,500 Active
-
2020-06-09soldstatus $99,000
-
2020-06-08soldstatus $99,000 434-char remark
Show marketing remark (434 chars)
Very cute home with lots of updates. Siding, windows, roof, electric have all been updated. Newer eat-in kitchen, laundry room off kitchen with exit to back yard. Laundry could be moved back into the basement, which is a walkout basement to back yard. 2 first floor bedrooms with one offering a half bath, 2 bedrooms on second floor. Lots goes past fenced yard, into the woods. This house does offer all first floor living, if needed.
-
2019-06-18$99,000 434-char remark
Show marketing remark (434 chars)
Very cute home with lots of updates. Siding, windows, roof, electric have all been updated. Newer eat-in kitchen, laundry room off kitchen with exit to back yard. Laundry could be moved back into the basement, which is a walkout basement to back yard. 2 first floor bedrooms with one offering a half bath, 2 bedrooms on second floor. Lots goes past fenced yard, into the woods. This house does offer all first floor living, if needed.
-
2005-11-07soldstatus $55,000
-
1998-12-21soldstatus $40,000
ⓘ Source: listings_history table (triggers on properties + properties_extension) + one-shot
backfill from property_details.listing_events for pre-trigger history.
Tax reassessment forecast OH · Partial reset (capped growth)
- Current annual tax
- $1,175 · $98/mo
- Projected year-2 tax
- $1,871 · $156/mo
- Expected delta
- +$696/yr (+$58/mo · 59.2%)
ⓘ Screening estimate from a state-policy table — verify with the county assessor before closing.
Climate risk First Street
- Flood 1/10 Low FEMA zone X (unshaded) · 0% chance over 30 yrs
- Wildfire 1/10 Low
- Heat 4/10 Moderate 7 d/yr ≥101°F today · 18 d/yr by 30 yrs out
- Wind 2/10 Low 100% chance of damaging wind over 30 yrs
- Air quality 2/10 Low 0 unhealthy d/yr today · 1 by 30 yrs out
Nearby sold comps map
Loading sold comps map…
Walkable amenities ~0.75 mi
Loading nearby amenities…
Taxation est. · year 1
- Rental income
- $22,520
- − Mortgage interest
- −$9,215
- − Property taxes
- −$1,175
- − Insurance
- −$822
- − Repairs & maintenance
- −$1,802
- − Management
- −$1,802
- − Depreciation
- −$4,785
- Taxable income
- $2,919
- Est. tax owed @ 24.0%
- −$701
- After-tax cash flow
- $4,740/yr
For passive investors: Depreciation is non-cash, so a rental often shows a tax loss while cash-flowing — sheltering income. Rental losses are passive: they offset passive income freely, and up to $25,000/yr can offset ordinary (W-2) income if you actively participate and your MAGI is under $100k (phasing out to $0 by $150k); unused losses carry forward. On sale, claimed depreciation is recaptured at up to 25%, and gains may owe capital-gains tax (a 1031 exchange can defer both). Figures are a year-1 estimate at your 24.0% rate — not tax advice; consult a CPA.
Schools (NCES district)
- District
- Marietta City
- NCES district ID
- 3910019
- Math proficiency
- 35% ▼ -20.00%
- Reading proficiency
- 49% ▼ -12.00%
- Median HH income
- $39,366
- Composite
- 35.08/100
- National rank
- #5025
- State rank
- #534 of 656 in OH
Livability — Marietta
- Score
- 80/100
- State rank
- #127
- US rank
- #1845
Category grades
Schools grade is shown separately in the Schools card above.
Census & demographics
- Census place
- Marietta, OH
- County
- Washington County · 26,420 people
- City population
- 26,420
- Metro
- Marietta, OH
- Population (ZIP)
- 26,420
- Household income
- $60,229
- Rent vs Own
- Severe rent burden
- 727.0
Population outlook (Washington County) Hauer SSP2
- Today (2025)
- 59,640 people
- By 2030
- 58,315 · -2.2%
- By 2040
- 55,186 · -7.5%
- By 2050
- 52,246 · -12.4%
- By 2075
- 45,893 · -23.0%
- By 2100
- 38,128 · -36.1%
Race, ethnicity, and origin ACS 2023
- Neighborhood character
- Predominantly White (94%)
- Race & ethnicity
- White 94% Two or more races 2% Asian 1% Black 1% Hispanic / Latino 1%
- Common ancestry
- Italian 2% Slovak 2% Romanian 2%
- Foreign-born
- 2% · Canada
- Languages at home
- 97% English-only · Tagalog/Filipino 1% Other Indo-European 1%
Political lean MEDSL · Washington
- 2024 margin
- Solid R (+43.8) · D 27.7% · R 71.5%
- 2008→2024 swing
- +40.2pp toward D · 2008: -83.9pp · 2024: -43.8pp
- All cycles
- 2024: R+43.8 2020: R+40.8 2016: R+41.6 2012: R+19.4 2008: R+83.9
Not yet ingested
- Civics
- —
Market trends
- HPI YoY
- ▼ -95.06%
- Current HPI
- 198.6235
- Rent YoY
- —
- Metro
- Marietta, OH
- State GDP YoY
- ▲ 1.98%
- F500 in state
- 48
Industry mix (Fortune 500 HQ in OH)
| Industry | F500 HQs | Revenue |
|---|---|---|
| Insurance | 3 | $145B |
|
||
| Industrial Machinery | 3 | $49B |
|
||
| Financial Services | 3 | $24B |
|
||
| Consumer Goods | 2 | $93B |
|
||
| Aerospace / Defense | 2 | $47B |
|
||
| Utilities | 2 | $33B |
|
||
Price history
+311.2% since first listed7 events — show timeline
- 2026-04-29 Contingent — MLSNOW
- 2026-04-28 Listed $164,500 MLSNOW
- 2020-06-09 Sold (Public Records) $99,000 Public Records
- 2020-06-08 Sold (MLS) $99,000 MLSNOW
- 2019-06-18 Listed $99,000 MLSNOW
- 2005-11-07 Sold (Public Records) $55,000 Public Records
- 1998-12-21 Sold (Public Records) $40,000 Public Records
Property tax history
+9.5%/yrLatest (2025): $1,175 · +6.7% YoY. Source: county tax records.
Cash-flow waterfall
monthlySold comps — $/sqft
last 12 mo · ≤1 miLoading sold comps…