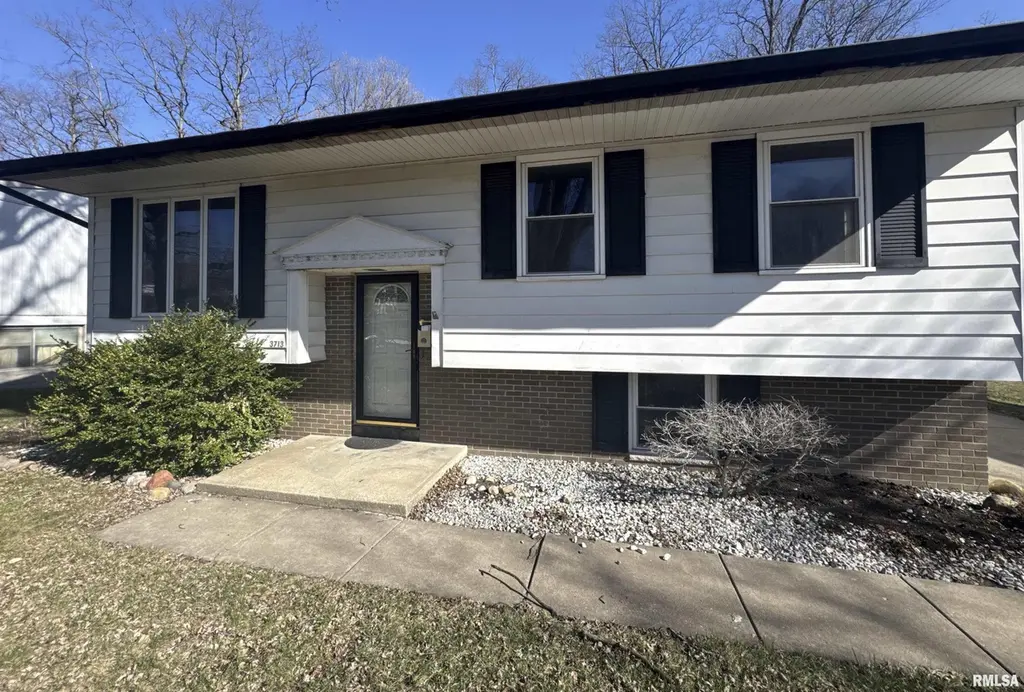
3713 W Pagewood Dr · Peoria, IL
Flood risk 1/10 · Minimal
- FEMA flood zone
- X
- Chance of flooding over 30 yrs
- 0.0%
- Est. flood insurance / yr
- $473 – $860
Fire risk 1/10 · Minimal
- Est. fire insurance / yr
- $804 – $1,492
Heat risk 3/10 · Minor
- Hot days now (above 104°F)
- 7 days/yr
- Hot days in 30 yrs
- 18 days/yr
Wind risk 2/10 · Minimal
- Chance of severe wind over 30 yrs
- 1.0%
Air-quality risk 2/10 · Minimal
- Unhealthy air days now
- 1 days/yr
- Unhealthy air days in 30 yrs
- 2 days/yr
Risk factors via First Street. Map © Google.
Why this score? — see what drove the B+ grade
The composite is a weighted blend of 9 inputs, each scored 0–100. Each bar is that input's sub-score; the figure is the points it added to the 100-point composite (weight × sub-score).
- Cash flow +30.0/30.0
- ARV discount +15.0/15.0
- DSCR +10.0/10.0
- 1% rule +9.0/10.0
- Appreciation +5.0/10.0
- Livability +3.7/5.0
- Rent growth +2.5/5.0
- Condition / age +2.5/5.0
- Schools +1.1/10.0
$92,900
🖨 Deal sheet 📄 Offer letter ✓ Due diligence
Listing remarks MLS
SOLD ONE-TIME SHOW. ROOM SIZES APPROXIMATE
Key facts
- Garage
- Built 1967
- Listed 29 days
Property features AI
Exterior
- Parking: Detached 1-car garage
- Utilities: No specific utility providers listed
- Home design: Single-family residence; Built in 1967; Total living area about 1,555 square feet
- Construction: Not new construction
- Exterior features: Shingle roof; Lot with ravine, wooded areas, and a creek; Lot dimensions approximately 110 x 82 x 120 x 60
Interior
- Kitchen: No appliances specified
- Bedrooms: 4 bedrooms total; Upper-level bedrooms: three with carpeted floors (approx. sizes 13x11, 11x10, 10x9) and egress windows; Lower-level bedroom: carpeted (approx. size 15x10) with egress window
- Flooring: Hardwood floors in living room and kitchen areas; Carpet in multiple bedrooms and recreation room
- Bathrooms: 1 full bathroom; 1 half bathroom
- Heating & cooling: Forced air heating; Central air conditioning
- Interior features: Basement present; No built-in appliances listed; No fireplaces
- Laundry & utility: No laundry appliances specified
Neighborhood map
What this means for you Summary
Snapshot
- This is a 2-bed/1.0-bath single-family listed at $93k.
Deal economics
- At list price, monthly cash flow is $350 ($4k/yr) — positive.
- The deal already cash-flows at list — no discount required.
- Meets the 1% rule at list price ($1k rent vs $93k).
- Recommended offer: $92k (1.5% below list) — sets the bar for market timing.
- Cap rate 10.8% vs local median 5.6% in Peoria — top-decile yield for the area; either an underpriced asset or a hidden risk that comps aren't pricing in. Stress-test before assuming the spread holds.
Location & tenants
- Location reads 73/100 on livability (#270 in IL) — a middle-class / working-renter tenant base. Strengths: commute A+, cost of living A+, housing A+; Watch: employment D+, crime F.
- Peoria SD 150 (urban): math 11% / reading 14% proficiency, ranked #554 of 620 in IL (top 89%) — low school quality limits family demand, transient renter base, plan for 1-2y turnover; 70% free/reduced lunch — lower-income household profile, screen leases tightly.
- Zoned schools: Richwoods High School (math 30% / reading 35%, grade F, #152 of 693 statewide, top 22%, 1,580 students, 0% FRL) — zoned schools average 0% FRL vs 70% district-wide (70 pts lower); this property's tenant base skews higher-income than the district average.
- Zoned-school proficiency averages 32% at this address vs 12% district-wide (+20 pts) — the actual schools serving this property are materially stronger than the Peoria SD 150 average implies; a family-tenant draw the district grade alone would hide.
- Market conditions: 1 active listings in the ZIP; 1 comparable units currently listed for rent nearby; 73 units permitted in Peoria County in 2024 (0 in 5+ unit buildings).
Forward outlook
- In year one you build about $3k of equity ($642 loan paydown + $3k appreciation (3.0% local appreciation)).
- Peoria County population projected at -11% by 2050 — secular population decline; favor cash flow + early exit over multi-decade hold.
- At projected returns (3.0% appreciation + 3.0% rent growth), your $26k cash investment doubles in ~4 years — after that, you're playing with house money.
- By year 10, paydown + projected appreciation supports a ~$33k cash-out refi (75% LTV) — recoverable capital for the next deal without selling this one.
Negotiation context
- It's been on market 29 days — a 2% lower offer ($92k) is reasonable based on typical stale-listing flexibility.
- 2 sale attempts since 23y ago with the ask held roughly flat each time — persistent listings suggest the price (not the market) is what's stuck; bring a comps-based counter.
- Current owner paid $75k; 24% above their basis — modest negotiation headroom, anchor on the comps not their cost.
Questions for the listing agent
- Built in 1967 — when were the roof, HVAC, electrical panel, plumbing, and water heater last replaced?
- Is there a deadline driving the sale (1031 exchange, divorce, estate, relocation)? That informs how much negotiation room exists.
- Schools are F-rated, which usually means shorter tenancies and higher turnover. Who's the typical renter profile here, and what's been the actual vacancy rate?
- Crime grade is F in this area — have there been break-ins, vandalism, or insurance claims at this property in the last 3 years? What carrier currently insures it and at what premium?
- What's the average days-on-market for RENTAL listings here right now (not sales)? A rising rental-DOM trend means longer vacancies and softer asking-rent achievability than the comps imply.
- What's the recent tenant-quality profile in this submarket — average credit score on applications, eviction rate, late-payment / NSF rate, and stable-employment percentage? A property-management company in the area should have these aggregated.
- How much new for-sale + rental construction is in the pipeline within 1–3 miles? Heavy new supply typically softens prices + rents 12–24 months out; constrained supply supports both.
Investment metrics
- 1% rule
- 1.40% ✓
- Cap rate
- 10.81%
- Cash-on-cash
- 16.12%
- DSCR
- 1.72
- GRM
- 6.0
CMA / ARV
- ARV (on-the-fly)
- $167,616
- Comps found
- 12
Show comp detail 12 sales within ~0.75 mi
| Address | Dist | Beds/Ba | Sqft | Sold | Price | $/sf | Match |
|---|---|---|---|---|---|---|---|
| 6602 N Randwick Rd | 0.10mi | 3/1.5 (+1) | 1,704 (-1%) | 10mo | $165,000 | $97 | 78 |
| 4314 W Lora Ann Ln | 0.41mi | 3/2.0 (+1) | 1,669 (-3%) | 1mo | $165,000 | $99 | 66 |
| 3625 W Compton Ct | 0.31mi | 3/1.5 (+1) | 1,678 (-3%) | 13mo | $137,000 | $82 | 63 |
| 4120 W Carrousel Ln | 0.32mi | 3/2.0 (+1) | 1,660 (-4%) | 11mo | $215,000 | $130 | 61 |
| 3702 W Creighton Ter | 0.28mi | 3/1.0 (+1) | 1,603 (-7%) | 12mo | $150,000 | $94 | 60 |
| 3201 W Wilshire Dr | 0.60mi | 3/2.5 (+1) | 1,740 (+1%) | 2mo | $238,500 | $137 | 59 |
| 6615 N Randwick Rd | 0.14mi | 3/1.5 (+1) | 1,950 (+13%) | 9mo | $155,000 | $79 | 58 |
| 3129 W Birkshire Dr | 0.58mi | 3/2.0 (+1) | 1,760 (+2%) | 6mo | $183,500 | $104 | 55 |
| 6713 N Fawndale Dr | 0.51mi | 3/2.5 (+1) | 1,710 (-1%) | 11mo | $155,000 | $91 | 55 |
| 6712 N Fawndale Dr | 0.47mi | 3/3.0 (+1) | 1,742 (+1%) | 14mo | $140,000 | $80 | 52 |
| 6403 N Talisman Ter | 0.74mi | 3/2.0 (+1) | 1,700 (-2%) | 4mo | $229,900 | $135 | 50 |
| 3813 W Brighton Ave | 0.43mi | 3/1.0 (+1) | 1,533 (-11%) | 11mo | $139,900 | $91 | 47 |
Match score weights: distance 35% · size 25% · config 20% · recency 20%. Top-matched comps best support the ARV.
Projected returns pro-forma
3.0% appreciation · 3.0% rent growth · sell at horizon
- IRR
- 22.7%
- Equity multiple
- 2.29×
- Total profit
- $33,494
- Equity at exit
- $41,772
- IRR
- 23.6%
- Equity multiple
- 4.39×
- Total profit
- $88,109
- Equity at exit
- $64,375
Cash invested: $26,012 (down + closing). Projections, not guarantees.
Landlord ↔ Tenant lean methodology
- Overall (STATE)
- 43 Moderately Tenant-Leaning
- State Illinois
- 43 Moderately Tenant-Leaning · D+7
- County
- — inherits STATE
- City
- — inherits STATE
ZIP-level market 61615-2520
- Active inventory
- 1
- Price-to-rent
- 6.0×
Monthly cashflow live
- Estimated rent
- $1,300 medium interval (Pro) →
- Mortgage (P&I)
- −$487
- Tax from tax record
- −$152 /mo · $1,819/yr
- Insurance
- −$39
- HOA
- −$0
- Vacancy / Maint / Mgmt
- −$273
- Net cashflow
- $350
Break-even live
UW: 25.0% down · 7.5% · 30yr · 1.5% tax · 5.0% vac · 8.0% maint · 8.0% mgmt
Financing live
Cash to close
- Down payment
- $23,225
- Closing costs
- $2,787
- Reserves months
- —
- Total cash needed
- —
Loan-product check · same deal, 3 products live
Conventional
25% down · 7.5% · 30yr
- Down + closing
- —
- Monthly P&I
- —
- Monthly cashflow
- —
- DSCR
- —
- Eligible?
- —
Personal DTI + credit; lowest rate.
DSCR
20% down · 8.5% · 30yr
- Down + closing
- —
- Monthly P&I
- —
- Monthly cashflow
- —
- DSCR
- —
- Eligible?
- —
No personal income docs; deal must DSCR.
Hard money
10% down · 12.0% · 12mo
- Down + closing
- —
- Monthly P&I
- —
- Monthly cashflow
- —
- DSCR
- —
- Eligible?
- —
Short-term bridge; refi at stabilization.
Rent comps 1 comps
| Address | Beds | Baths | Sqft | Rent | $/sqft | DOM | Units | Dist |
|---|---|---|---|---|---|---|---|---|
| 4105 W Hollow Creek Dr Peoria, IL | 2.0 | 2.0 | 1121 | $1,300 | $1.16 | 13d | 3 | 0.33mi |
Listing history 5 events
-
2026-05-01status Pending
-
2026-04-02$92,900 Active
-
2004-03-08soldstatus $75,000
-
2003-08-01soldstatus $70,000 42-char remark
Show marketing remark (42 chars)
SOLD ONE-TIME SHOW. ROOM SIZES APPROXIMATE
-
2003-08-01$70,000 42-char remark
Show marketing remark (42 chars)
SOLD ONE-TIME SHOW. ROOM SIZES APPROXIMATE
ⓘ Source: listings_history table (triggers on properties + properties_extension) + one-shot
backfill from property_details.listing_events for pre-trigger history.
Tax reassessment forecast IL · Partial reset (capped growth)
- Current annual tax
- $1,819 · $152/mo
- Projected year-2 tax
- $1,964 · $164/mo
- Expected delta
- +$145/yr (+$12/mo · 8.0%)
ⓘ Screening estimate from a state-policy table — verify with the county assessor before closing.
Climate risk First Street
- Flood 1/10 Low FEMA zone X · 0% chance over 30 yrs
- Wildfire 1/10 Low
- Heat 3/10 Moderate 7 d/yr ≥104°F today · 18 d/yr by 30 yrs out
- Wind 2/10 Low 100% chance of damaging wind over 30 yrs
- Air quality 2/10 Low 1 unhealthy d/yr today · 2 by 30 yrs out
Nearby sold comps map
Loading sold comps map…
Walkable amenities ~0.75 mi
Loading nearby amenities…
Taxation est. · year 1
- Rental income
- $15,600
- − Mortgage interest
- −$5,204
- − Property taxes
- −$1,819
- − Insurance
- −$464
- − Repairs & maintenance
- −$1,248
- − Management
- −$1,248
- − Depreciation
- −$2,703
- Taxable income
- $2,914
- Est. tax owed @ 24.0%
- −$699
- After-tax cash flow
- $3,495/yr
For passive investors: Depreciation is non-cash, so a rental often shows a tax loss while cash-flowing — sheltering income. Rental losses are passive: they offset passive income freely, and up to $25,000/yr can offset ordinary (W-2) income if you actively participate and your MAGI is under $100k (phasing out to $0 by $150k); unused losses carry forward. On sale, claimed depreciation is recaptured at up to 25%, and gains may owe capital-gains tax (a 1031 exchange can defer both). Figures are a year-1 estimate at your 24.0% rate — not tax advice; consult a CPA.
Schools (NCES district)
- District
- Peoria SD 150
- NCES district ID
- 1731230
- Math proficiency
- 11% ▼ -5.00%
- Reading proficiency
- 14% ▼ -4.00%
- Median HH income
- $41,951
- Composite
- 10.92/100
- National rank
- #9751
- State rank
- #554 of 620 in IL
Livability — Peoria
- Score
- 73/100
- State rank
- #270
- US rank
- #5096
Category grades
Schools grade is shown separately in the Schools card above.
Census & demographics
- Census place
- Peoria, IL
Population outlook (Peoria County) Hauer SSP2
- Today (2025)
- 183,007 people
- By 2030
- 179,643 · -1.8%
- By 2040
- 171,782 · -6.1%
- By 2050
- 163,508 · -10.7%
- By 2075
- 140,178 · -23.4%
- By 2100
- 114,493 · -37.4%
Not yet ingested
- Political lean
- —
- Race & ethnicity
- —
- Common origin
- —
- Civics
- —
Market trends
- HPI YoY
- —
- Current HPI
- —
- Rent YoY
- —
- Metro
- —
- State GDP YoY
- ▲ 1.59%
- F500 in state
- 60
Industry mix (Fortune 500 HQ in IL)
| Industry | F500 HQs | Revenue |
|---|---|---|
| Insurance | 4 | $201B |
|
||
| Consumer Goods | 4 | $87B |
|
||
| Industrial Machinery | 3 | $64B |
|
||
| Healthcare | 2 | $55B |
|
||
| Retail / Pharmacy | 1 | $148B |
|
||
| Agriculture / Food | 1 | $86B |
|
||
Price history
+32.7% since first listed5 events — show timeline
- 2026-05-01 Pending — RMLSA as Distributed by MLS Grid
- 2026-04-02 Listed $92,900 RMLSA as Distributed by MLS Grid
- 2004-03-08 Sold (Public Records) $75,000 Public Records
- 2003-08-01 Listed $70,000 RMLSA as Distributed by MLS Grid
- 2003-08-01 Sold (MLS) $70,000 RMLSA as Distributed by MLS Grid
Property tax history
-1.2%/yrLatest (2024): $1,819 · -30.9% YoY. Source: county tax records.
Cash-flow waterfall
monthlySold comps — $/sqft
last 12 mo · ≤1 miLoading sold comps…