 🏗️ New Construction
11614 Ruffian Dr · Conroe, TX
Flood risk No data
- FEMA flood zone
- —
- Chance of flooding over 30 yrs
- —
- Est. flood insurance / yr
- —
Fire risk No data
- Est. fire insurance / yr
- —
Heat risk No data
- Hot days now (above threshold)
- —
- Hot days in 30 yrs
- —
Wind risk No data
- Chance of severe wind over 30 yrs
- —
Air-quality risk No data
- Unhealthy air days now
- —
- Unhealthy air days in 30 yrs
- —
Risk factors via First Street. Map © Google.
Why this score? — see what drove the F grade
The composite is a weighted blend of 9 inputs, each scored 0–100. Each bar is that input's sub-score; the figure is the points it added to the 100-point composite (weight × sub-score).
- ARV discount +7.5/15.0
- Cash flow +6.8/30.0
- Condition / age +5.0/5.0
- Livability +3.7/5.0
- Schools +3.2/10.0
- 1% rule +2.1/10.0
- Rent growth +2.0/5.0
- DSCR +1.0/10.0
- Appreciation +0.0/10.0
$243,340
🖨 Deal sheet (PDF) 📄 Offer letter ✓ Due diligence
Listing remarks
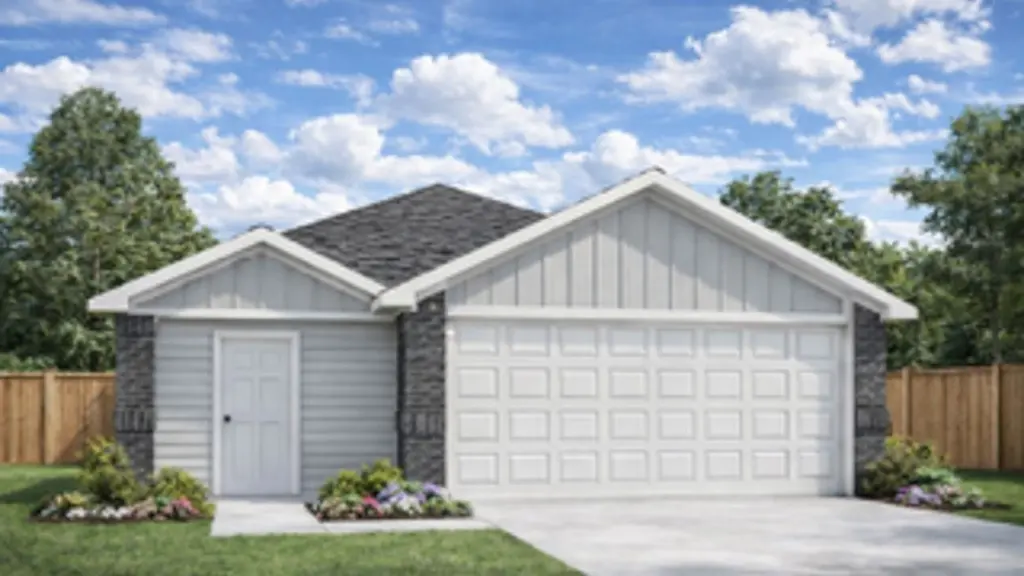
FANTASTIC BRAND NEW D. R. HORTON HOME IN LEXINGTON HEIGHTS! WONDERFUL COMMUNITY IN EXCELLENT LOCATION ON CORNER HOMESITE! Close to Lake Conroe and endless entertainment options! Charming one story with gourmet island kitchen! Includes quartz counter tops, quality cabinets, stainless steel appliances and an open concept floorplan with the kitchen flowing seamlessly into the dining room and living room! The main bedroom has an attractive ensuite bathroom that features a quartz vanity countertop! Enjoy additional storage with a spacious walk-in closet located off of the primary bathroom. Spacious secondary bedrooms! Water Softener & Filtration System Included! Fantastic outdoor space wi
Key facts
- Quality cabinets
- Quartz counter tops
- Ensuite bathroom
Tags
Property features AI
Finance
- HOA & community: Community association managed by ICM Management; Annual association fee of $795
Exterior
- Parking: Attached garage with garage door opener (2 spaces)
- Security: Prewired for security; Smoke detectors
- Utilities: Public water; Public sewer
- Home design: Residential property; Under construction (new construction); Slab foundation; Composition roof
- Construction: Built by D.R. Horton; Brick and cement siding; Year built: 2026
- Exterior features: Covered patio; Patio and deck; Private yard; Fence (back yard); Sprinkler/irrigation; Corner lot in a subdivision
Interior
- Kitchen: Dishwasher; Disposal; Gas oven; Gas range; Microwave; Pantry; Quartz counters
- Bedrooms: Primary bedroom on first floor (approx. 14x12); Bedroom on first floor (approx. 10x10); Bedroom on first floor (approx. 10x10)
- Flooring: Carpet; Plank; Vinyl
- Bathrooms: 2 full bathrooms
- Heating & cooling: Central heating (gas); Central air (electric)
- Interior features: High ceilings; Kitchen and family room combined; Kitchen and dining area combined; Living and dining room; Pantry; Quartz counters; Programmable thermostat; Low emissivity windows
- Laundry & utility: Washer hookup; Electric dryer hookup; Tankless water heater
Neighborhood map
What this means for you Summary
Snapshot
- This is a 3-bed/2.0-bath single-family listed at $243k. Condition is rated excellent.
Deal economics
- At list price, monthly cash flow is $-441 ($-5k/yr) — negative.
- To cash-flow at today's rent, offer at most $217k (11.0% below list).
- To meet the 1% rule (rent ≥ 1% of price), the offer needs to be $198k (18.7% below list).
- Recommended offer: $198k (18.7% below list) — sets the bar for 1% rule.
- Cap rate 4.4% vs local median 3.1% in Conroe — top-decile yield for the area; either an underpriced asset or a hidden risk that comps aren't pricing in. Stress-test before assuming the spread holds.
Location & tenants
- Location reads 74/100 on livability (#169 in TX, #4,447 nationally) — a middle-class / working-renter tenant base. Strengths: cost of living A+, housing A+, amenities B; Watch: commute F, health & safety F.
- Willis ISD (rural): math 33% / reading 40% proficiency, ranked #458 of 826 in TX (top 55%) — families likely to look elsewhere, expect single-tenant / working-renter base with shorter leases.
- Zoned schools: W Lloyd Meador El (math 45% / reading 44%, grade F, #1,155 of 4,322 statewide, top 29%, 617 students, 43% FRL); Robert P Brabham Middle (math 33% / reading 41%, grade F, #756 of 1,662 statewide, top 47%, 1,117 students, 52% FRL); Willis H S (math 19% / reading 46%, grade F, #1,029 of 1,632 statewide, top 64%, 2,521 students, 57% FRL).
- Market conditions: Rents soft (-2.1%/yr); 1199 active listings in the ZIP; 5 comparable units currently listed for rent nearby; rentals at typical pace (median 21d on market — plan ~3-4 weeks tenant-placement turnaround); solid renter incomes; 13,259 units permitted in Montgomery County in 2024 (1,402 in 5+ unit buildings).
Forward outlook
- Local home prices are declining (-3.0%/yr); year-one equity from $2k of loan paydown is wiped out by about $8k of value loss. Plan a longer hold.
- Montgomery County population projected at +65% by 2050 — long-run rental-demand tailwind backs the buy-and-hold thesis.
Negotiation context
- It's been on market 45 days — a 3% lower offer ($236k) is reasonable based on typical stale-listing flexibility.
- 2 sale attempts with the ask held roughly flat each time — persistent listings suggest the price (not the market) is what's stuck; bring a comps-based counter.
Questions for the listing agent
- What do current leases actually rent for vs. the listed asking? Can we see a recent rent roll and the last 12 months of T-12 income?
- It's been on market 45 days. Have you received any prior offers? Is the seller open to a 19% concession, seller financing, or rate buy-down credit?
- What does the HOA fee cover, when was the last increase, and are there any pending special assessments or reserve-fund shortfalls?
- Is there a deadline driving the sale (1031 exchange, divorce, estate, relocation)? That informs how much negotiation room exists.
- Schools are D-rated, which usually means shorter tenancies and higher turnover. Who's the typical renter profile here, and what's been the actual vacancy rate?
- The area grade is low — what's the realistic commute time and amenity access for the typical tenant pool here? Any planned neighborhood developments (good or bad) we should know about?
- What's the average days-on-market for RENTAL listings here right now (not sales)? A rising rental-DOM trend means longer vacancies and softer asking-rent achievability than the comps imply.
- What's the recent tenant-quality profile in this submarket — average credit score on applications, eviction rate, late-payment / NSF rate, and stable-employment percentage? A property-management company in the area should have these aggregated.
- How much new for-sale + rental construction is in the pipeline within 1–3 miles? Heavy new supply typically softens prices + rents 12–24 months out; constrained supply supports both.
Investment metrics
- 1% rule
- 0.71% ✗
- Cap rate
- 4.41%
- Cash-on-cash
- -6.74%
- DSCR
- 0.70
- GRM
- 11.8
CMA / ARV
- ARV (median comp)
- $280,270
- List price
- $243,340
- Delta
- -13.18%
- Verdict
- UNDERPRICED
- Comps
- 20 within 1.0 mi
Show comp detail 12 sales within ~0.75 mi
| Address | Dist | Beds/Ba | Sqft | Sold | Price | $/sf | Match |
|---|---|---|---|---|---|---|---|
| 11631 Ruffian Dr | 0.02mi | 3/2.5 | 1,470 (+2%) | 1mo | $241,990 | $165 | 92 |
| 11993 Barbaro Dr | 0.14mi | 3/2.0 | 1,328 (-7%) | 2mo | $255,990 | $193 | 80 |
| 11814 Serena's Song Dr | 0.26mi | 3/2.0 | 1,572 (+10%) | 0mo | $276,490 | $176 | 72 |
| 11783 Ruffian Dr | 0.67mi | 3/2.0 | 1,434 (0%) | 0mo | $234,990 | $164 | 68 |
| 11703 Ruffian Dr | 0.67mi | 3/2.0 | 1,434 (0%) | 1mo | $237,990 | $166 | 68 |
| 11810 Serena's Song Dr | 0.46mi | 4/2.0 (+1) | 1,476 (+3%) | 1mo | $263,990 | $179 | 68 |
| 11683 Ruffian Dr | 0.67mi | 3/2.0 | 1,434 (0%) | 3mo | $234,990 | $164 | 66 |
| 11779 Ruffian Dr | 0.67mi | 3/2.5 | 1,470 (+2%) | 4mo | $239,990 | $163 | 60 |
| 11953 Barbaro Dr | 0.67mi | 4/2.0 (+1) | 1,476 (+3%) | 1mo | $251,990 | $171 | 58 |
| 12011 Curlin Dr | 0.67mi | 3/2.0 | 1,328 (-7%) | 1mo | $245,990 | $185 | 55 |
| 11671 Ruffian Dr | 0.67mi | 3/2.0 | 1,280 (-11%) | 1mo | $231,990 | $181 | 50 |
| 11695 Ruffian Dr | 0.67mi | 4/2.0 (+1) | 1,573 (+10%) | 1mo | $243,990 | $155 | 47 |
Match score weights: distance 35% · size 25% · config 20% · recency 20%. Top-matched comps best support the ARV.
Projected returns pro-forma
-3.0% appreciation · 0.0% rent growth · sell at horizon
- IRR
- -31.5%
- Equity multiple
- -0.01×
- Total profit
- $-79,203
- Equity at exit
- $41,789
- IRR
- -57.0%
- Equity multiple
- -0.62×
- Total profit
- $-127,214
- Equity at exit
- $24,233
Cash invested: $78,475 (down + closing). Projections, not guarantees.
Landlord ↔ Tenant lean methodology
- Overall (STATE)
- 87 Strongly Landlord-Friendly
- State Texas
- 87 Strongly Landlord-Friendly · R+5
- County
- — inherits STATE
- City
- — inherits STATE
ZIP-level market 77318
- Home prices YoY
- -32.7%
- Rents YoY
- -2.1%
- Active inventory
- 1199
- Price-to-rent
- 10.3×
Monthly cashflow live
- Estimated rent
- $1,978 high interval (Pro) →
- Mortgage (P&I)
- −$1,470
- Tax est. 1.5%
- −$350 /mo · $4,204/yr
- Insurance
- −$117
- HOA
- −$66
- Vacancy / Maint / Mgmt
- −$415
- Net cashflow
- $-441
Break-even live
Sensitivity live
| Price | -10% $-247 | -5% $-344 | +0% $-441 | +5% $-537 | +10% $-634 |
|---|---|---|---|---|---|
| Rent | -10% $-597 | -5% $-519 | +0% $-441 | +5% $-362 | +10% $-284 |
| Rate | -1.0pp $-299 | -0.5pp $-369 | base $-441 | +0.5pp $-513 | +1.0pp $-587 |
UW: 25.0% down · 7.5% · 30yr · 1.5% tax · 5.0% vac · 8.0% maint · 8.0% mgmt
Financing live
Cash to close
- Down payment
- $70,067
- Closing costs
- $8,408
- Reserves months
- —
- Total cash needed
- —
Loan-product check · same deal, 3 products live
Conventional
25% down · 7.5% · 30yr
- Down + closing
- —
- Monthly P&I
- —
- Monthly cashflow
- —
- DSCR
- —
- Eligible?
- —
Personal DTI + credit; lowest rate.
DSCR
20% down · 8.5% · 30yr
- Down + closing
- —
- Monthly P&I
- —
- Monthly cashflow
- —
- DSCR
- —
- Eligible?
- —
No personal income docs; deal must DSCR.
Hard money
10% down · 12.0% · 12mo
- Down + closing
- —
- Monthly P&I
- —
- Monthly cashflow
- —
- DSCR
- —
- Eligible?
- —
Short-term bridge; refi at stabilization.
Rent comps 5 comps
| Address | Beds | Baths | Sqft | Rent | $/sqft | DOM | Units | Dist |
|---|---|---|---|---|---|---|---|---|
| 11848 Whirlaway Dr Willis, TX | 3.0 | 2.0 | 1388 | $1,695 | $1.22 | 26d | 1 | 0.46mi |
| 11962 Wisteria Meadows Dr Willis, TX | 3.0 | 2.0 | 1675 | $1,785 | $1.07 | 45d | 1 | 0.49mi |
| 11962 Sunshine Park Dr N Willis, TX | 3.0 | 2.0 | 1390 | $1,925 | $1.38 | 20d | 1 | 1.06mi |
| 11971 Sunshine Park Dr N Willis, TX | 3.0 | 2.0 | 1443 | $1,965 | $1.36 | 7d | 1 | 1.09mi |
| 11114 N Lake Mist Ln Willis, TX | 4.0 | 2.0 | 1313 | $1,799 | $1.37 | 14d | 1 | 1.34mi |
HOA detail
- Monthly dues
- $66 · $792/yr
- Likely covers
- water
Listing history 16 events
-
2026-06-21days on market $243,340 Active 45 DOM
-
2026-06-18days on market $243,340 Active 42 DOM
-
2026-06-17pricestatus $243,340 Active 41 DOM
-
2026-06-17days on market $237,990 Active Under Contract 41 DOM
-
2026-06-16days on market $237,990 Active Under Contract 40 DOM
-
2026-06-15days on market $237,990 Active Under Contract 39 DOM
-
2026-06-13days on market $237,990 Active Under Contract 37 DOM
-
2026-06-09days on market $237,990 Active Under Contract 33 DOM
-
2026-06-08days on market $237,990 Active Under Contract 32 DOM
-
2026-06-07days on market $237,990 Active Under Contract 31 DOM
-
2026-06-04days on market $237,990 Active Under Contract 28 DOM
-
2026-06-03days on market $237,990 Active Under Contract 27 DOM
-
2026-06-02days on market $237,990 Active Under Contract 26 DOM
-
2026-06-01days on market $237,990 Active Under Contract 25 DOM
-
2026-05-31days on market $237,990 Active Under Contract 24 DOM
-
2026-05-07$237,990 Active 791-char remark
ⓘ Source: listings_history table (triggers on properties + properties_extension) + one-shot
backfill from property_details.listing_events for pre-trigger history.
Nearby sold comps map
Loading sold comps map…
Walkable amenities ~0.75 mi
Loading nearby amenities…
Taxation est. · year 1
- Rental income
- $23,731
- − Mortgage interest
- −$15,699
- − Property taxes
- −$4,204
- − Insurance
- −$1,401
- − Repairs & maintenance
- −$1,898
- − Management
- −$1,898
- − HOA
- −$792
- − Depreciation
- −$8,153
- Taxable loss
- −$10,316
- Est. tax savings @ 24.0%
- +$2,476
- After-tax cash flow
- $-2,811/yr
For passive investors: Depreciation is non-cash, so a rental often shows a tax loss while cash-flowing — sheltering income. Rental losses are passive: they offset passive income freely, and up to $25,000/yr can offset ordinary (W-2) income if you actively participate and your MAGI is under $100k (phasing out to $0 by $150k); unused losses carry forward. On sale, claimed depreciation is recaptured at up to 25%, and gains may owe capital-gains tax (a 1031 exchange can defer both). Figures are a year-1 estimate at your 24.0% rate — not tax advice; consult a CPA.
Condition & rehab AI · 4 photos
This brand new D.R. Horton home in Lexington Heights is move-in ready with a modern kitchen, spacious living areas, and a well-maintained exterior. It offers excellent curb appeal and is located in an excellent location with access to Lake Conroe and entertainment options.
Value-add opportunities
- Both Landscaping improvements — Enhances curb appeal and adds value for both resale and rental.
- Both Painting exterior trim — Fresh paint can improve the home's curb appeal and value.
- Both Add smart home features — Modernizes the home and adds value for both resale and rental.
- Both Install smart thermostat — Saves on energy costs and adds value for both resale and rental.
- Both Add smart security system — Enhances safety and adds value for both resale and rental.
Renovation cost estimate screening
Value-add ROI direction
- Both Landscaping improvements — Enhances curb appeal and adds value for both resale and rental. ↑
- Both Painting exterior trim — Fresh paint can improve the home's curb appeal and value. ↑
- Both Add smart home features — Modernizes the home and adds value for both resale and rental. ↑
- Both Install smart thermostat — Saves on energy costs and adds value for both resale and rental. ↑
- Both Add smart security system — Enhances safety and adds value for both resale and rental. ↑
ⓘ Cost ranges are severity-bucket heuristics (US national rule-of-thumb). Get contractor quotes + a written scope before underwriting a rehab budget.
Schools (NCES district)
- District
- Willis ISD
- NCES district ID
- 4845900
- Math proficiency
- 33% ▼ -15.00%
- Reading proficiency
- 40% ▼ -2.00%
- Median HH income
- $57,828
- Composite
- 32.32/100
- National rank
- #5746
- State rank
- #458 of 826 in TX
Livability — Conroe
- Score
- 74/100
- State rank
- #169
- US rank
- #4447
Category grades
Schools grade is shown separately in the Schools card above.
Census & demographics
- County
- Montgomery County · 663,713 people
- City population
- 205,417
- Metro
- Houston-The Woodlands-Sugar Land, TX
- Population (ZIP)
- 20,792
- Household income
- $92,415
- Rent vs Own
- Severe rent burden
- 279.0
Population outlook (Montgomery County) Hauer SSP2
- Today (2025)
- 713,896 people
- By 2030
- 805,263 · +12.8%
- By 2040
- 992,708 · +39.1%
- By 2050
- 1,179,590 · +65.2%
- By 2075
- 1,628,084 · +128.1%
- By 2100
- 1,937,880 · +171.5%
Race, ethnicity, and origin ACS 2023
- Neighborhood character
- Predominantly White (72%)
- Race & ethnicity
- White 72% Hispanic / Latino 17% Two or more races 14% Black 3%
- Hispanic origin (detail)
- Mexican 12%
- Common ancestry
- Lithuanian 4% Slovak 2% Serbian 2%
- Foreign-born
- 6% · Canada, Jamaica
- Languages at home
- 88% English-only · Spanish 10%
Political lean MEDSL · Montgomery
- 2024 margin
- Solid R (+45.5) · D 26.8% · R 72.3%
- 2008→2024 swing
- +7.2pp toward D · 2008: -52.7pp · 2024: -45.5pp
- All cycles
- 2024: R+45.5 2020: R+43.8 2016: R+51.4 2012: R+60.7 2008: R+52.7
Not yet ingested
- Civics
- —
Market trends
- HPI YoY
- ▼ -114.58%
- Current HPI
- 236.256
- Rent YoY
- ▼ -2.09%
- Metro
- Houston-The Woodlands-Sugar Land, TX
- State GDP YoY
- ▲ 3.95%
- F500 in state
- 110
Industry mix (Fortune 500 HQ in TX)
| Industry | F500 HQs | Revenue |
|---|---|---|
| Energy | 16 | $1,198B |
|
||
| Technology | 5 | $198B |
|
||
| Engineering / Construction | 4 | $72B |
|
||
| Energy Services | 3 | $60B |
|
||
| Utilities | 3 | $41B |
|
||
| Healthcare | 2 | $330B |
|
||
Price history
+2.2% since first listed4 events — show timeline
- 2026-06-17 Relisted — HARMLS
- 2026-06-17 Price Changed $243,340 HARMLS
- 2026-05-29 Contingent — HARMLS
- 2026-05-07 Listed $237,990 HARMLS
Cash-flow waterfall
monthlySold comps — $/sqft
last 12 mo · ≤1 miLoading sold comps…