 Fourplex
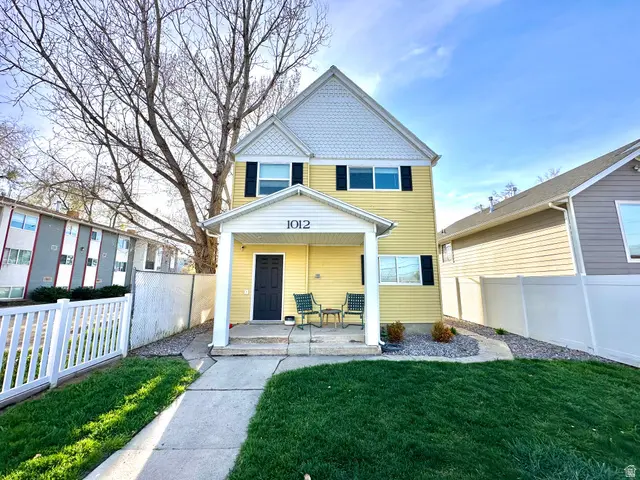
1012 S West Temple · Salt Lake City, UT
Flood risk 8/10 · Major
- FEMA flood zone
- X (unshaded)
- Chance of flooding over 30 yrs
- 0.99%
- Est. flood insurance / yr
- $507 – $1,088
Fire risk 1/10 · Minimal
- Est. fire insurance / yr
- $453 – $841
Heat risk 4/10 · Minor
- Hot days now (above 96°F)
- 7 days/yr
- Hot days in 30 yrs
- 19 days/yr
Wind risk 1/10 · Minimal
- Chance of severe wind over 30 yrs
- —
Air-quality risk 4/10 · Minor
- Unhealthy air days now
- 5 days/yr
- Unhealthy air days in 30 yrs
- 6 days/yr
Risk factors via First Street. Map © Google.
Why this score? — see what drove the B grade
The composite is a weighted blend of 9 inputs, each scored 0–100. Each bar is that input's sub-score; the figure is the points it added to the 100-point composite (weight × sub-score).
- Cash flow +30.0/30.0
- 1% rule +10.0/10.0
- DSCR +10.0/10.0
- ARV discount +7.5/15.0
- Appreciation +4.8/10.0
- Livability +3.8/5.0
- Rent growth +3.2/5.0
- Schools +2.9/10.0
- Condition / age +2.5/5.0
$875,000
🖨 Deal sheet (PDF) 📄 Offer letter ✓ Due diligence
Multi-family units
County records classify this as Multi-Family (5+ Unit). Listing-text estimate: 4 units. estimate disagrees with records
5+ unit building — per-unit beds/baths from public records are typically unavailable; the breakdown below (if shown) is an estimate from the listing text.
Listing remarks MLS
There are no remarks available.
Key facts
- New kitchens
- Updated lvp flooring
- Fresh interior paint
Tags
Property features AI
Finance
- Other: Total units on site: 4
- Financial info: Four rental units with current rents reported: $1,389; $1,200; $1,175; $1,450
- HOA & community: No HOA or community details provided
Exterior
- Parking: Uncovered/open parking
- Security: No security details provided
- Utilities: Natural gas connected; Electricity connected; Public sewer; Water connected
- Home design: 2-story multi-family property; Zoned RMF-35 (multi-family); Property used for residential purposes
- Construction: Built in 1994; Property is built and standing; Asphalt roof
- Exterior features: Open porch; Exterior lighting; Landscaping: full
Interior
- Kitchen: No specific kitchen appliance details provided
- Bedrooms: Four 1-bedroom units (each unit listed as 1 bed)
- Flooring: Carpet; Tile
- Bathrooms: Four 1-bath units (each unit listed as 1 bath)
- Heating & cooling: No heating or cooling details provided
- Interior features: Window blinds; Carpet and tile flooring
- Laundry & utility: No laundry/utility details provided
Neighborhood map
What this means for you Summary
Snapshot
- This is a 4 × 4-bed/4.0-bath units multifamily listed at $875k.
Deal economics
- At list price, monthly cash flow is $6k ($70k/yr) — positive. Per door: $1k/mo.
- The deal already cash-flows at list — no discount required.
- Meets the 1% rule at list price ($14k rent vs $875k).
- Recommended offer: $849k (3.0% below list) — sets the bar for market timing.
Location & tenants
- Location reads 75/100 on livability (#64 in UT, #3,994 nationally) — a middle-class / working-renter tenant base. Strengths: amenities A+, commute A+, housing A; Watch: cost of living D+, crime F.
- Salt Lake District (urban): math 30% / reading 37% proficiency, ranked #65 of 80 in UT (top 81%) — families likely to look elsewhere, expect single-tenant / working-renter base with shorter leases.
- Zoned schools: Liberty School (math 12% / reading 12%, grade F, #572 of 585 statewide, top 98%, 391 students, 100% FRL); Clayton Middle (math 47% / reading 50%, grade C-, #35 of 138 statewide, top 26%, 634 students, 24% FRL); Highland High (math 21% / reading 54%, grade F, #76 of 171 statewide, top 45%, 1,980 students, 30% FRL).
- Market conditions: Rents rising (+2.8%/yr); 63 active listings in the ZIP; 4,970 units permitted in Salt Lake County in 2024 (1,963 in 5+ unit buildings).
- At $14,056/mo this rent would consume 232% of the median local household income ($73k/yr) (locally 557% of renters already pay >50% of income on rent) — very limited rent-growth headroom before tenants either downsize or default.
Forward outlook
- In year one you build about $3k of equity ($6k loan paydown + $-3k appreciation (-0.3% local appreciation)).
- Salt Lake County population projected at +37% by 2050 — long-run rental-demand tailwind backs the buy-and-hold thesis.
- At projected returns (-0.3% appreciation + 2.8% rent growth), your $245k cash investment doubles in ~4 years — after that, you're playing with house money.
- By year 9, paydown + projected appreciation supports a ~$55k cash-out refi (75% LTV) — recoverable capital for the next deal without selling this one.
Negotiation context
- It's been on market 47 days — a 3% lower offer ($849k) is reasonable based on typical stale-listing flexibility.
- 3 sale attempts since 3y ago; this cycle's ask has dropped $74k (8%) from the opening price — seller is motivated, your offer sets the floor, not the list.
Risks & watch-outs
- Watch-outs: flood insurance adds $66/mo; built in 1897 — expect roof / HVAC / electrical / plumbing capex.
- Climate carrying-cost: severe flood risk — expect insurance premiums to compound above CPI over the hold.
Questions for the listing agent
- It's been on market 47 days. Have you received any prior offers? Is the seller open to a 3% concession, seller financing, or rate buy-down credit?
- Can we see the unit-by-unit rent roll, current vacancy, and any below-market leases? What's the average tenancy length?
- What capital expenditures (roof, boiler, parking lot, exteriors) have been made in the last 5 years, and what's planned in the next 2?
- Built in 1897 — when were the roof, HVAC, electrical panel, plumbing, and water heater last replaced?
- What's the actual annual flood-insurance premium (NFIP or private), and is the property in a SFHA with mandatory coverage?
- Is there a deadline driving the sale (1031 exchange, divorce, estate, relocation)? That informs how much negotiation room exists.
- Crime grade is F in this area — have there been break-ins, vandalism, or insurance claims at this property in the last 3 years? What carrier currently insures it and at what premium?
- What's the average days-on-market for RENTAL listings here right now (not sales)? A rising rental-DOM trend means longer vacancies and softer asking-rent achievability than the comps imply.
- What's the recent tenant-quality profile in this submarket — average credit score on applications, eviction rate, late-payment / NSF rate, and stable-employment percentage? A property-management company in the area should have these aggregated.
- How much new apartment / multifamily construction is in the pipeline within 1–3 miles? Heavy new supply (>2% of stock underway) typically softens rents 12–24 months out; light construction supports rent growth.
Investment metrics
- 1% rule
- 1.61% ✓
- Cap rate
- 14.39%
- Cash-on-cash
- 28.90%
- DSCR
- 2.29
- GRM
- 5.2
CMA / ARV
No comps found within radius.
Projected returns pro-forma
-0.33% appreciation · 2.75% rent growth · sell at horizon
- IRR
- 28.1%
- Equity multiple
- 2.34×
- Total profit
- $328,630
- Equity at exit
- $239,610
- IRR
- 32.1%
- Equity multiple
- 4.46×
- Total profit
- $848,864
- Equity at exit
- $276,720
Cash invested: $245,000 (down + closing). Projections, not guarantees.
Landlord ↔ Tenant lean methodology
- Overall (STATE)
- 86 Strongly Landlord-Friendly
- State Utah
- 86 Strongly Landlord-Friendly · R+15
- County
- — inherits STATE
- City
- — inherits STATE
ZIP-level market 84101
- Home prices YoY
- -0.1%
- Rents YoY
- 2.8%
- Active inventory
- 63
- Price-to-rent
- 20.8×
Monthly cashflow live
- Estimated rent
- $14,056 high interval (Pro) →
- Mortgage (P&I)
- −$4,589
- Tax from tax record
- −$250 /mo · $2,999/yr
- Insurance
- −$365
- Flood insurance flood zone
- −$66 /mo · $798/yr
- HOA
- −$0
- Vacancy / Maint / Mgmt
- −$2,952
- Net cashflow
- $5,835
Break-even live
Sensitivity live
| Price | -10% $6,330 | -5% $6,082 | +0% $5,835 | +5% $5,587 | +10% $5,339 |
|---|---|---|---|---|---|
| Rent | -10% $4,724 | -5% $5,279 | +0% $5,835 | +5% $6,390 | +10% $6,945 |
| Rate | -1.0pp $6,275 | -0.5pp $6,057 | base $5,835 | +0.5pp $5,608 | +1.0pp $5,377 |
4-unit breakdown (identical units grouped — click to expand)
| Units | Beds | Baths | Est. rent |
|---|---|---|---|
| 4× units | 4 | 4 | $14,056 |
| #1 | 4 | 4 | $3,514 |
| #2 | 4 | 4 | $3,514 |
| #3 | 4 | 4 | $3,514 |
| #4 | 4 | 4 | $3,514 |
| Total (4 units) | $14,056 | ||
UW: 25.0% down · 7.5% · 30yr · 1.5% tax · 5.0% vac · 8.0% maint · 8.0% mgmt
Financing live
Cash to close
- Down payment
- $218,750
- Closing costs
- $26,250
- Reserves months
- —
- Total cash needed
- —
Loan-product check · same deal, 3 products live
Conventional
25% down · 7.5% · 30yr
- Down + closing
- —
- Monthly P&I
- —
- Monthly cashflow
- —
- DSCR
- —
- Eligible?
- —
Personal DTI + credit; lowest rate.
DSCR
20% down · 8.5% · 30yr
- Down + closing
- —
- Monthly P&I
- —
- Monthly cashflow
- —
- DSCR
- —
- Eligible?
- —
No personal income docs; deal must DSCR.
Hard money
10% down · 12.0% · 12mo
- Down + closing
- —
- Monthly P&I
- —
- Monthly cashflow
- —
- DSCR
- —
- Eligible?
- —
Short-term bridge; refi at stabilization.
Listing history 13 events
-
2026-06-21days on market $875,000 Active 47 DOM
-
2026-06-18days on market $875,000 Active 44 DOM
-
2026-06-17days on market $875,000 Active 43 DOM
-
2026-06-16days on market $875,000 Active 42 DOM
-
2026-06-15days on market $875,000 Active 41 DOM
-
2026-06-13days on market $875,000 Active 39 DOM
-
2026-06-13days on market $875,000 Active 38 DOM
-
2026-06-09days on market $875,000 Active 35 DOM
-
2026-06-08days on market $875,000 Active 34 DOM
-
2026-06-07days on market $875,000 Active 33 DOM
-
2026-06-05days on market $875,000 Active 30 DOM
-
2026-06-03remarks 699-char remark
-
2026-06-03$875,000 Active 29 DOM
ⓘ Source: listings_history table (triggers on properties + properties_extension) + one-shot
backfill from property_details.listing_events for pre-trigger history.
Tax reassessment forecast UT · Resets to sale price
- Current annual tax
- $2,999 · $250/mo
- Projected year-2 tax
- $5,775 · $481/mo
- Expected delta
- +$2,776/yr (+$231/mo · 92.6%)
ⓘ Screening estimate from a state-policy table — verify with the county assessor before closing.
Climate risk First Street
- Flood 8/10 Severe FEMA zone X (unshaded) · 99% chance over 30 yrs
- Wildfire 1/10 Low
- Heat 4/10 Moderate 7 d/yr ≥96°F today · 19 d/yr by 30 yrs out
- Wind 1/10 Low
- Air quality 4/10 Moderate 5 unhealthy d/yr today · 6 by 30 yrs out
Nearby sold comps map
Loading sold comps map…
Walkable amenities ~0.75 mi
Loading nearby amenities…
Taxation est. · year 1
- Rental income
- $168,672
- − Mortgage interest
- −$49,014
- − Property taxes
- −$2,999
- − Insurance
- −$5,172
- − Repairs & maintenance
- −$13,494
- − Management
- −$13,494
- − Depreciation
- −$25,455
- Taxable income
- $59,045
- Est. tax owed @ 24.0%
- −$14,171
- After-tax cash flow
- $55,846/yr
For passive investors: Depreciation is non-cash, so a rental often shows a tax loss while cash-flowing — sheltering income. Rental losses are passive: they offset passive income freely, and up to $25,000/yr can offset ordinary (W-2) income if you actively participate and your MAGI is under $100k (phasing out to $0 by $150k); unused losses carry forward. On sale, claimed depreciation is recaptured at up to 25%, and gains may owe capital-gains tax (a 1031 exchange can defer both). Figures are a year-1 estimate at your 24.0% rate — not tax advice; consult a CPA.
Schools (NCES district)
- District
- Salt Lake District
- NCES district ID
- 4900870
- Math proficiency
- 30% ▼ -13.00%
- Reading proficiency
- 37% ▼ -6.00%
- Median HH income
- $47,550
- Composite
- 28.85/100
- National rank
- #6645
- State rank
- #65 of 80 in UT
Livability — Salt Lake City
- Score
- 75/100
- State rank
- #64
- US rank
- #3994
Category grades
Schools grade is shown separately in the Schools card above.
Census & demographics
- Census place
- Salt Lake City, UT
- County
- Salt Lake County · 1,195,750 people
- City population
- 172,615
- Metro
- Salt Lake City, UT
- Population (ZIP)
- 9,381
- Household income
- $72,735
- Rent vs Own
- Severe rent burden
- 557.0
Population outlook (Salt Lake County) Hauer SSP2
- Today (2025)
- 1,305,860 people
- By 2030
- 1,402,611 · +7.4%
- By 2040
- 1,594,533 · +22.1%
- By 2050
- 1,787,244 · +36.9%
- By 2075
- 2,224,138 · +70.3%
- By 2100
- 2,551,390 · +95.4%
Race, ethnicity, and origin ACS 2023
- Neighborhood character
- Predominantly White (66%)
- Race & ethnicity
- White 66% Hispanic / Latino 19% Two or more races 7% Asian 6% Black 2% Pacific Islander 1%
- Hispanic origin (detail)
- Mexican 14%
- Common ancestry
- Swedish 4% Lithuanian 3% Slovak 3%
- Foreign-born
- 16% · Canada, China
- Languages at home
- 79% English-only · Spanish 10% Other Asian/Pacific 5% Other Indo-European 4%
Political lean MEDSL · Salt Lake
- 2024 margin
- D (+10.2) · D 53.7% · R 43.5% · Other 2.8%
- 2008→2024 swing
- +10.1pp toward D · 2008: 0.1pp · 2024: 10.2pp
- All cycles
- 2024: D+10.2 2020: D+11.0 2016: D+10.2 2012: R+19.3 2008: D+0.1
Not yet ingested
- Civics
- —
Market trends
- HPI YoY
- ▼ -0.33%
- Current HPI
- 253.5063
- Rent YoY
- ▲ 2.75%
- Metro
- Salt Lake City, UT
- State GDP YoY
- ▲ 3.54%
- F500 in state
- 2
Industry mix (Fortune 500 HQ in UT)
| Industry | F500 HQs | Revenue |
|---|---|---|
| Financial Services | 1 | $3B |
|
||
Price history
+59.1% since first listed9 events — show timeline
- 2026-06-03 Relisted — WFRMLS
- 2026-06-03 Price Changed $875,000 WFRMLS
- 2026-04-29 Listing Removed — WFRMLS
- 2026-04-01 Listed $949,000 WFRMLS
- 2025-10-17 Sold (Public Records) — Public Records
- 2024-02-08 Sold (Public Records) — Public Records
- 2024-02-05 Sold (MLS) — WFRMLS
- 2023-12-14 Pending — WFRMLS
- 2023-12-05 Listed $550,000 WFRMLS
Property tax history
+7.9%/yrLatest (2025): $2,999 · +112.0% YoY. Source: county tax records.
Cash-flow waterfall
monthlySold comps — $/sqft
last 12 mo · ≤1 miLoading sold comps…