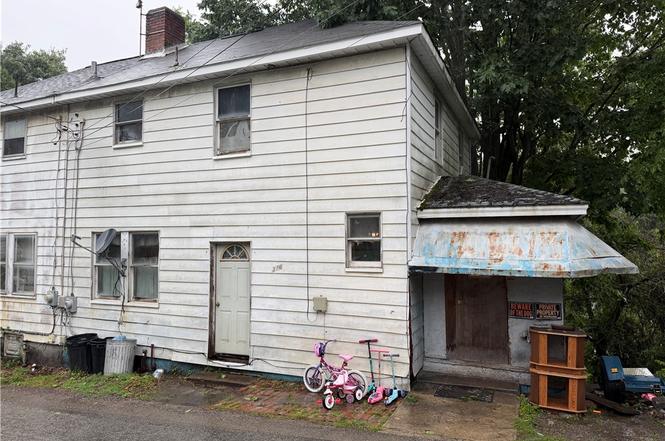
376 Sherman Ave · Cumberland, PA
Flood risk 1/10 · Minimal
- FEMA flood zone
- X (unshaded)
- Chance of flooding over 30 yrs
- 0.0%
- Est. flood insurance / yr
- $473 – $860
Fire risk 1/10 · Minimal
- Est. fire insurance / yr
- $511 – $949
Heat risk 3/10 · Minor
- Hot days now (above 98°F)
- 7 days/yr
- Hot days in 30 yrs
- 18 days/yr
Wind risk 2/10 · Minimal
- Chance of severe wind over 30 yrs
- —
Air-quality risk 2/10 · Minimal
- Unhealthy air days now
- 1 days/yr
- Unhealthy air days in 30 yrs
- 2 days/yr
Risk factors via First Street. Map © Google.
Why this score? — see what drove the B grade
The composite is a weighted blend of 9 inputs, each scored 0–100. Each bar is that input's sub-score; the figure is the points it added to the 100-point composite (weight × sub-score).
- Cash flow +30.0/30.0
- 1% rule +10.0/10.0
- DSCR +10.0/10.0
- ARV discount +7.5/15.0
- Appreciation +5.0/10.0
- Rent growth +2.5/5.0
- Livability +2.5/5.0
- Condition / age +2.5/5.0
- Schools +2.2/10.0
$30,000
🖨 Deal sheet 📄 Offer letter ✓ Due diligence
Listing remarks
Large 2-story home offering strong upside potential with 3 bedrooms and 1 full bath. Features include a spacious living room, formal dining area, large kitchen, hardwood floors, rear deck, and private wooded backyard. Interior is currently livable but would benefit from cosmetic updating and modernization. Exterior requires deferred maintenance including siding, deck, and site improvements. Excellent value-add opportunity for a rental portfolio, fix-and-flip project, or owner-occupant renovation. Property offers generous room sizes, a functional layout, and significant equity potential after improvements.
Key facts
- Large kitchen
- Formal dining area
- Rear deck
Tags
Property features AI
Exterior
- Parking: Off-street parking
- Utilities: Public water; Public sewer
- Home design: Resale property
- Construction: Frame construction; Asphalt roof
- Exterior features: Off-street parking; Public transportation nearby
Interior
- Bathrooms: 1 full bathroom
- Heating & cooling: Gas heating; Electric cooling
- Interior features: Walk-up basement
Neighborhood map
What this means for you Summary
Snapshot
- This is a 3-bed/1.0-bath single-family listed at $30k.
Deal economics
- At list price, monthly cash flow is $557 ($7k/yr) — positive.
- The deal already cash-flows at list — no discount required.
- Meets the 1% rule at list price ($967 rent vs $30k).
Location & tenants
- Location reads: area grade B — affects rentability + tenant quality, not the cash-flow math above.
- Carmichaels Area SD (rural): math 17% / reading 36% proficiency, ranked #465 of 539 in PA (top 86%) — low school quality limits family demand, transient renter base, plan for 1-2y turnover.
- Market conditions: 1 active listings in the ZIP; 30 units permitted in Greene County in 2024 (0 in 5+ unit buildings).
Forward outlook
- In year one you build about $1k of equity ($207 loan paydown + $900 appreciation (3.0% local appreciation)).
- Greene County population projected at -20% by 2050 — secular population decline; favor cash flow + early exit over multi-decade hold.
- At projected returns (3.0% appreciation + 3.0% rent growth), your $8k cash investment doubles in ~2 years — after that, you're playing with house money.
Negotiation context
- Only 1 days on market — expect competitive offers; lowballing is unlikely to land.
- 2 sale attempts with the ask held roughly flat each time — persistent listings suggest the price (not the market) is what's stuck; bring a comps-based counter.
Risks & watch-outs
- Watch-outs: built in 1919 — expect roof / HVAC / electrical / plumbing capex.
Questions for the listing agent
- Built in 1919 — when were the roof, HVAC, electrical panel, plumbing, and water heater last replaced?
- Is there a deadline driving the sale (1031 exchange, divorce, estate, relocation)? That informs how much negotiation room exists.
- What's the average days-on-market for RENTAL listings here right now (not sales)? A rising rental-DOM trend means longer vacancies and softer asking-rent achievability than the comps imply.
- What's the recent tenant-quality profile in this submarket — average credit score on applications, eviction rate, late-payment / NSF rate, and stable-employment percentage? A property-management company in the area should have these aggregated.
- How much new for-sale + rental construction is in the pipeline within 1–3 miles? Heavy new supply typically softens prices + rents 12–24 months out; constrained supply supports both.
Investment metrics
- 1% rule
- 3.22% ✓
- Cap rate
- 28.57%
- Cash-on-cash
- 79.55%
- DSCR
- 4.54
- GRM
- 2.6
CMA / ARV
- ARV (on-the-fly)
- $91,872
- Comps found
- 4
Show comp detail 4 sales within ~0.75 mi
| Address | Dist | Beds/Ba | Sqft | Sold | Price | $/sf | Match |
|---|---|---|---|---|---|---|---|
| 289 Sheridan Ln | 0.37mi | 3/1.0 | 1,056 (0%) | 8mo | $32,500 | $31 | 76 |
| 76 Foch Cir | 0.57mi | 3/1.5 | 1,031 (-2%) | 6mo | $149,484 | $145 | 62 |
| 29 Wood St | 0.58mi | 2/1.0 (-1) | 978 (-7%) | 2mo | $85,000 | $87 | 54 |
| 81 Pershing Blvd | 0.47mi | 3/2.0 | 960 (-9%) | 7mo | $45,000 | $47 | 53 |
Match score weights: distance 35% · size 25% · config 20% · recency 20%. Top-matched comps best support the ARV.
Projected returns pro-forma
3.0% appreciation · 3.0% rent growth · sell at horizon
- IRR
- 84.0%
- Equity multiple
- 5.65×
- Total profit
- $39,093
- Equity at exit
- $13,489
- IRR
- 83.5%
- Equity multiple
- 11.65×
- Total profit
- $89,490
- Equity at exit
- $20,789
Cash invested: $8,400 (down + closing). Projections, not guarantees.
Landlord ↔ Tenant lean methodology
- Overall (STATE)
- 62 Landlord-Friendly
- State Pennsylvania
- 62 Landlord-Friendly · EVEN
- County
- — inherits STATE
- City
- — inherits STATE
ZIP-level market 15351
- Active inventory
- 1
- Price-to-rent
- 2.6×
Monthly cashflow live
- Estimated rent
- $967 medium interval (Pro) →
- Mortgage (P&I)
- −$157
- Tax est. 1.5%
- −$38 /mo · $450/yr
- Insurance
- −$12
- HOA
- −$0
- Vacancy / Maint / Mgmt
- −$203
- Net cashflow
- $557
Break-even live
UW: 25.0% down · 7.5% · 30yr · 1.5% tax · 5.0% vac · 8.0% maint · 8.0% mgmt
Financing live
Cash to close
- Down payment
- $7,500
- Closing costs
- $900
- Reserves months
- —
- Total cash needed
- —
Loan-product check · same deal, 3 products live
Conventional
25% down · 7.5% · 30yr
- Down + closing
- —
- Monthly P&I
- —
- Monthly cashflow
- —
- DSCR
- —
- Eligible?
- —
Personal DTI + credit; lowest rate.
DSCR
20% down · 8.5% · 30yr
- Down + closing
- —
- Monthly P&I
- —
- Monthly cashflow
- —
- DSCR
- —
- Eligible?
- —
No personal income docs; deal must DSCR.
Hard money
10% down · 12.0% · 12mo
- Down + closing
- —
- Monthly P&I
- —
- Monthly cashflow
- —
- DSCR
- —
- Eligible?
- —
Short-term bridge; refi at stabilization.
Listing history 2 events
-
2026-06-17remarks 612-char remark
-
2026-06-17$30,000 Active 1 DOM
ⓘ Source: listings_history table (triggers on properties + properties_extension) + one-shot
backfill from property_details.listing_events for pre-trigger history.
Climate risk First Street
- Flood 1/10 Low FEMA zone X (unshaded) · 0% chance over 30 yrs
- Wildfire 1/10 Low
- Heat 3/10 Moderate 7 d/yr ≥98°F today · 18 d/yr by 30 yrs out
- Wind 2/10 Low
- Air quality 2/10 Low 1 unhealthy d/yr today · 2 by 30 yrs out
Nearby sold comps map
Loading sold comps map…
Walkable amenities ~0.75 mi
Loading nearby amenities…
Taxation est. · year 1
- Rental income
- $11,607
- − Mortgage interest
- −$1,680
- − Property taxes
- −$450
- − Insurance
- −$150
- − Repairs & maintenance
- −$929
- − Management
- −$929
- − Depreciation
- −$873
- Taxable income
- $6,597
- Est. tax owed @ 24.0%
- −$1,583
- After-tax cash flow
- $5,099/yr
For passive investors: Depreciation is non-cash, so a rental often shows a tax loss while cash-flowing — sheltering income. Rental losses are passive: they offset passive income freely, and up to $25,000/yr can offset ordinary (W-2) income if you actively participate and your MAGI is under $100k (phasing out to $0 by $150k); unused losses carry forward. On sale, claimed depreciation is recaptured at up to 25%, and gains may owe capital-gains tax (a 1031 exchange can defer both). Figures are a year-1 estimate at your 24.0% rate — not tax advice; consult a CPA.
Schools (NCES district)
- District
- Carmichaels Area SD
- NCES district ID
- 4205070
- Math proficiency
- 17% ▼ -19.00%
- Reading proficiency
- 36% ▼ -20.00%
- Median HH income
- $39,060
- Composite
- 22.18/100
- National rank
- #8164
- State rank
- #465 of 539 in PA
Livability — Cumberland
No livability data for this city. (Only ~50 U.S. cities are tracked.)
Census & demographics
- Census place
- Nemacolin, PA
- Population (ZIP)
- 1,107
Population outlook (Greene County) Hauer SSP2
- Today (2025)
- 34,975 people
- By 2030
- 33,554 · -4.1%
- By 2040
- 30,615 · -12.5%
- By 2050
- 27,819 · -20.5%
- By 2075
- 21,678 · -38.0%
- By 2100
- 16,318 · -53.3%
Race, ethnicity, and origin ACS 2023
- Neighborhood character
- Predominantly White (96%)
- Race & ethnicity
- White 96% Two or more races 4%
- Common ancestry
- Polish 10% Slovak 7% Romanian 2%
Political lean MEDSL · Greene
- 2024 margin
- Solid R (+44.8) · D 26.6% · R 71.5% · Other 1.9%
- 2008→2024 swing
- -44.4pp toward R · 2008: -0.4pp · 2024: -44.8pp
- All cycles
- 2024: R+44.8 2020: R+43.4 2016: R+41.7 2012: R+17.6 2008: R+0.4
Not yet ingested
- Civics
- —
Market trends
- HPI YoY
- —
- Current HPI
- —
- Rent YoY
- —
- Metro
- —
- State GDP YoY
- ▲ 1.68%
- F500 in state
- 34
Industry mix (Fortune 500 HQ in PA)
| Industry | F500 HQs | Revenue |
|---|---|---|
| Healthcare | 2 | $309B |
|
||
| Insurance | 2 | $27B |
|
||
| Telecommunications / Media | 1 | $124B |
|
||
| Industrial Distribution | 1 | $22B |
|
||
| Financial Services | 1 | $20B |
|
||
| Chemicals / Materials | 1 | $18B |
|
||
Price history
-57.1% since first listed9 events — show timeline
- 2026-06-17 Listed $30,000 West Penn MLS
- 2025-08-18 Listing Removed — BRIGHT MLS
- 2025-08-15 Price Changed $29,900 BRIGHT MLS
- 2025-08-14 Price Changed $34,900 BRIGHT MLS
- 2025-08-08 Price Changed $39,900 BRIGHT MLS
- 2025-08-04 Price Changed $44,900 BRIGHT MLS
- 2025-07-30 Price Changed $49,900 BRIGHT MLS
- 2025-07-29 Price Changed $63,900 BRIGHT MLS
- 2025-07-21 Listed $69,900 BRIGHT MLS
Cash-flow waterfall
monthlySold comps — $/sqft
last 12 mo · ≤1 miLoading sold comps…