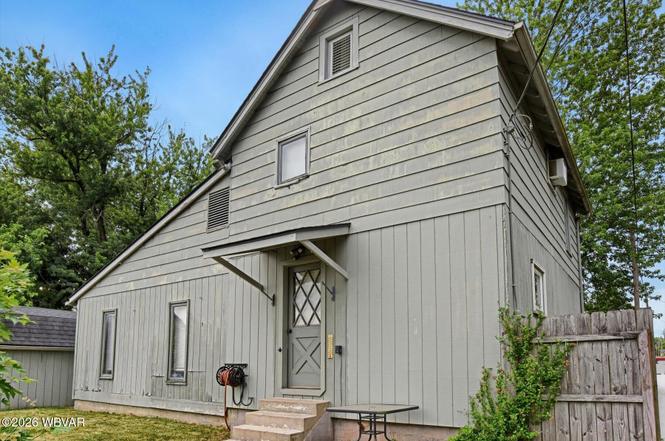
1210 Blehl Aly · Williamsport, PA
Flood risk 1/10 · Minimal
- FEMA flood zone
- X
- Chance of flooding over 30 yrs
- 0.0%
- Est. flood insurance / yr
- $507 – $1,088
Fire risk 1/10 · Minimal
- Est. fire insurance / yr
- $511 – $949
Heat risk 4/10 · Minor
- Hot days now (above 97°F)
- 7 days/yr
- Hot days in 30 yrs
- 16 days/yr
Wind risk 2/10 · Minimal
- Chance of severe wind over 30 yrs
- 1.0%
Air-quality risk 2/10 · Minimal
- Unhealthy air days now
- 0 days/yr
- Unhealthy air days in 30 yrs
- 1 days/yr
Risk factors via First Street. Map © Google.
Why this score? — see what drove the C grade
The composite is a weighted blend of 9 inputs, each scored 0–100. Each bar is that input's sub-score; the figure is the points it added to the 100-point composite (weight × sub-score).
- Cash flow +17.8/30.0
- ARV discount +15.0/15.0
- DSCR +5.6/10.0
- 1% rule +4.8/10.0
- Livability +3.7/5.0
- Rent growth +3.6/5.0
- Schools +3.5/10.0
- Condition / age +2.5/5.0
- Appreciation +0.0/10.0
$149,900
🖨 Deal sheet 📄 Offer letter ✓ Due diligence
Listing remarks MLS
New Roof, New Heating System, some fresh paint and some new carpet. If you are looking to downsize with privacy, then take a look at this single family home. Fenced in patio, large detached shed, and off street parking. Please call Frank Schemery at 570-323-5019 for your private showings.
Key facts
- Storage shed
- Private setting
- Main-floor laundry
Tags
Property features AI
Exterior
- Parking: No formal garage (gravel parking with alley access)
- Utilities: 200+ amp electric service
- Home design: Residential property
- Construction: Frame construction with wood siding; Shingle roof; Block foundation; Built area approximately 1,648 above grade
- Exterior features: Patio; Level lot; Shed(s)
Interior
- Kitchen: Dishwasher; Range; Refrigerator
- Bedrooms: 7 total rooms (includes bedrooms and living spaces)
- Flooring: Vinyl flooring; Carpet
- Bathrooms: 1 full bathroom
- Heating & cooling: Propane heating; Central air conditioning
- Interior features: Built-in bar; Partial basement
- Laundry & utility: Washer; Dryer
Neighborhood map
What this means for you Summary
Snapshot
- This is a 3-bed/1.0-bath single-family listed at $150k.
Deal economics
- At list price, monthly cash flow is $122 ($1k/yr) — positive.
- The deal already cash-flows at list — no discount required.
- To meet the 1% rule (rent ≥ 1% of price), the offer needs to be $147k (1.8% below list).
- Recommended offer: $147k (1.8% below list) — sets the bar for 1% rule.
- Cap rate 7.3% vs local median 5.6% in Williamsport — meaningfully above typical; check what's discounted (condition, days-on-market, listing class) to confirm the premium yield is real.
Location & tenants
- Location reads 74/100 on livability (#523 in PA, #4,841 nationally) — a middle-class / working-renter tenant base. Strengths: cost of living A+, housing A+, health & safety A+; Watch: crime C-, employment D, amenities F.
- Williamsport Area SD (urban): math 38% / reading 45% proficiency, ranked #349 of 539 in PA (top 65%) — families likely to look elsewhere, expect single-tenant / working-renter base with shorter leases.
- Market conditions: Rents rising fast (+4.4%/yr); 188 active listings in the ZIP; 5 comparable units currently listed for rent nearby; rentals lingering (median 44d on market — plan ~5-8 weeks vacancy on turnover, expect pricing pressure); 80% of comp listings sitting > 30 days — soft ceiling on asking rent; 73 units permitted in Lycoming County in 2024 (15 in 5+ unit buildings).
- This rent runs 33% of the median local income ($53k/yr) — at the standard rent-burdened threshold; future hikes will face affordability resistance.
Forward outlook
- Local home prices are declining (-3.0%/yr); year-one equity from $1k of loan paydown is wiped out by about $4k of value loss. Plan a longer hold.
- Lycoming County population projected to shrink 10% by 2050 — rents likely to lag national; underwrite the cash flow, not the appreciation.
Negotiation context
- Only 3 days on market — expect competitive offers; lowballing is unlikely to land.
- 2 sale attempts since 8y ago with the ask held roughly flat each time — persistent listings suggest the price (not the market) is what's stuck; bring a comps-based counter.
- Current owner paid $65k; list at $150k implies a 129% gain — meaningful room to come down on a strong offer.
Risks & watch-outs
- Watch-outs: built in 1901 — expect roof / HVAC / electrical / plumbing capex.
Questions for the listing agent
- Built in 1901 — when were the roof, HVAC, electrical panel, plumbing, and water heater last replaced?
- Is there a deadline driving the sale (1031 exchange, divorce, estate, relocation)? That informs how much negotiation room exists.
- What's the average days-on-market for RENTAL listings here right now (not sales)? A rising rental-DOM trend means longer vacancies and softer asking-rent achievability than the comps imply.
- What's the recent tenant-quality profile in this submarket — average credit score on applications, eviction rate, late-payment / NSF rate, and stable-employment percentage? A property-management company in the area should have these aggregated.
- How much new for-sale + rental construction is in the pipeline within 1–3 miles? Heavy new supply typically softens prices + rents 12–24 months out; constrained supply supports both.
Investment metrics
- 1% rule
- 0.98% ✗
- Cap rate
- 7.27%
- Cash-on-cash
- 3.50%
- DSCR
- 1.16
- GRM
- 8.5
CMA / ARV
- ARV (on-the-fly)
- $213,408
- Comps found
- 7
Show comp detail 7 sales within ~0.75 mi
| Address | Dist | Beds/Ba | Sqft | Sold | Price | $/sf | Match |
|---|---|---|---|---|---|---|---|
| 1629 Marlin Pkwy | 0.41mi | 3/1.0 | 1,215 (-3%) | 8mo | $189,900 | $156 | 70 |
| 1625 Marlin Pkwy | 0.42mi | 3/1.0 | 1,350 (+8%) | 7mo | $170,000 | $126 | 61 |
| 1316 Mansel Ave | 0.31mi | 3/1.5 | 1,143 (-8%) | 12mo | $219,500 | $192 | 59 |
| 1617 Marlin Pkwy | 0.44mi | 3/1.5 | 1,148 (-8%) | 10mo | $210,000 | $183 | 55 |
| 1621 Warren Ave | 0.41mi | 3/1.0 | 1,165 (-7%) | 19mo | $199,999 | $172 | 54 |
| 1320 Mansel Ave | 0.32mi | 3/1.5 | 1,344 (+8%) | 22mo | $230,000 | $171 | 52 |
| 417 Pearson Ave | 0.74mi | 3/1.0 | 1,360 (+9%) | 3mo | $215,000 | $158 | 48 |
Match score weights: distance 35% · size 25% · config 20% · recency 20%. Top-matched comps best support the ARV.
Projected returns pro-forma
-3.0% appreciation · 4.43% rent growth · sell at horizon
- IRR
- -9.2%
- Equity multiple
- 0.66×
- Total profit
- $-14,322
- Equity at exit
- $22,351
- IRR
- 2.1%
- Equity multiple
- 1.16×
- Total profit
- $6,745
- Equity at exit
- $12,961
Cash invested: $41,972 (down + closing). Projections, not guarantees.
Landlord ↔ Tenant lean methodology
- Overall (STATE)
- 62 Landlord-Friendly
- State Pennsylvania
- 62 Landlord-Friendly · EVEN
- County
- — inherits STATE
- City
- — inherits STATE
ZIP-level market 17701
- Rents YoY
- 4.4%
- Active inventory
- 188
- Price-to-rent
- 8.5×
Monthly cashflow live
- Estimated rent
- $1,472 medium interval (Pro) →
- Mortgage (P&I)
- −$786
- Tax from tax record
- −$192 /mo · $2,305/yr
- Insurance
- −$62
- HOA
- −$0
- Vacancy / Maint / Mgmt
- −$309
- Net cashflow
- $122
Break-even live
UW: 25.0% down · 7.5% · 30yr · 1.5% tax · 5.0% vac · 8.0% maint · 8.0% mgmt
Financing live
Cash to close
- Down payment
- $37,475
- Closing costs
- $4,497
- Reserves months
- —
- Total cash needed
- —
Loan-product check · same deal, 3 products live
Conventional
25% down · 7.5% · 30yr
- Down + closing
- —
- Monthly P&I
- —
- Monthly cashflow
- —
- DSCR
- —
- Eligible?
- —
Personal DTI + credit; lowest rate.
DSCR
20% down · 8.5% · 30yr
- Down + closing
- —
- Monthly P&I
- —
- Monthly cashflow
- —
- DSCR
- —
- Eligible?
- —
No personal income docs; deal must DSCR.
Hard money
10% down · 12.0% · 12mo
- Down + closing
- —
- Monthly P&I
- —
- Monthly cashflow
- —
- DSCR
- —
- Eligible?
- —
Short-term bridge; refi at stabilization.
Rent comps 5 comps
| Address | Beds | Baths | Sqft | Rent | $/sqft | DOM | Units | Dist |
|---|---|---|---|---|---|---|---|---|
| 1539 Northway Rd Unit NW455 Williamsport, PA | 2.0 | 1.0 | 700 | $850 | $1.21 | 43d | 1 | 0.76mi |
| 300 Valley Heights Dr Williamsport, PA | 1.0–3.0 | 1.0–2.0 | 1195 | $3,476 | $2.91 | 14d | 1 | 0.92mi |
| 215 E 3rd St Unit 3D Williamsport, PA | 2.0 | 1.0 | 1300 | $2,500 | $1.92 | 43d | 1 | 1.04mi |
| 475 E 5th Ave Unit 6 South Williamsport, PA | 2.0 | 1.0 | 900 | $1,180 | $1.31 | 43d | 1 | 1.23mi |
| 480 E 5th Ave Unit 4 South Williamsport, PA | 2.0 | 1.0 | 900 | $1,200 | $1.33 | 43d | 1 | 1.25mi |
Listing history 4 events
-
2026-06-19days on market $149,900 Active 3 DOM
-
2026-06-18days on market $149,900 Active 2 DOM
-
2026-06-17remarks 556-char remark
-
2026-06-17$149,900 Active 1 DOM
ⓘ Source: listings_history table (triggers on properties + properties_extension) + one-shot
backfill from property_details.listing_events for pre-trigger history.
Tax reassessment forecast PA · Partial reset (capped growth)
- Current annual tax
- $2,305 · $192/mo
- Projected year-2 tax
- $2,337 · $195/mo
- Expected delta
- +$32/yr (+$3/mo · 1.4%)
ⓘ Screening estimate from a state-policy table — verify with the county assessor before closing.
Climate risk First Street
- Flood 1/10 Low FEMA zone X · 0% chance over 30 yrs
- Wildfire 1/10 Low
- Heat 4/10 Moderate 7 d/yr ≥97°F today · 16 d/yr by 30 yrs out
- Wind 2/10 Low 100% chance of damaging wind over 30 yrs
- Air quality 2/10 Low 0 unhealthy d/yr today · 1 by 30 yrs out
Nearby sold comps map
Loading sold comps map…
Walkable amenities ~0.75 mi
Loading nearby amenities…
Taxation est. · year 1
- Rental income
- $17,666
- − Mortgage interest
- −$8,397
- − Property taxes
- −$2,305
- − Insurance
- −$750
- − Repairs & maintenance
- −$1,413
- − Management
- −$1,413
- − Depreciation
- −$4,361
- Taxable loss
- −$972
- Est. tax savings @ 24.0%
- +$233
- After-tax cash flow
- $1,702/yr
For passive investors: Depreciation is non-cash, so a rental often shows a tax loss while cash-flowing — sheltering income. Rental losses are passive: they offset passive income freely, and up to $25,000/yr can offset ordinary (W-2) income if you actively participate and your MAGI is under $100k (phasing out to $0 by $150k); unused losses carry forward. On sale, claimed depreciation is recaptured at up to 25%, and gains may owe capital-gains tax (a 1031 exchange can defer both). Figures are a year-1 estimate at your 24.0% rate — not tax advice; consult a CPA.
Schools (NCES district)
- District
- Williamsport Area SD
- NCES district ID
- 4226460
- Math proficiency
- 38% ▼ -9.00%
- Reading proficiency
- 45% ▼ -12.00%
- Median HH income
- $38,637
- Composite
- 34.63/100
- National rank
- #5150
- State rank
- #349 of 539 in PA
Livability — Williamsport
- Score
- 74/100
- State rank
- #523
- US rank
- #4841
Category grades
Schools grade is shown separately in the Schools card above.
Census & demographics
- Census place
- Williamsport, PA
- County
- Lycoming County · 43,104 people
- City population
- 43,104
- Metro
- Williamsport, PA
- Population (ZIP)
- 43,104
- Household income
- $53,237
- Rent vs Own
- Severe rent burden
- 2178.0
Population outlook (Lycoming County) Hauer SSP2
- Today (2025)
- 114,164 people
- By 2030
- 112,221 · -1.7%
- By 2040
- 107,613 · -5.7%
- By 2050
- 102,950 · -9.8%
- By 2075
- 92,987 · -18.5%
- By 2100
- 80,924 · -29.1%
Race, ethnicity, and origin ACS 2023
- Neighborhood character
- Predominantly White (80%)
- Race & ethnicity
- White 80% Black 10% Two or more races 7% Hispanic / Latino 3% Asian 1%
- Common ancestry
- Romanian 3% Lithuanian 2% Slovak 2%
- Foreign-born
- 2% · Canada
- Languages at home
- 96% English-only · Spanish 1% French/Haitian/Cajun 1% German/W. Germanic 1%
Political lean MEDSL · Lycoming
- 2024 margin
- Solid R (+41.5) · D 28.8% · R 70.3%
- 2008→2024 swing
- -17.3pp toward R · 2008: -24.2pp · 2024: -41.5pp
- All cycles
- 2024: R+41.5 2020: R+41.3 2016: R+44.8 2012: R+33.3 2008: R+24.2
Not yet ingested
- Civics
- —
Market trends
- HPI YoY
- ▼ -142.61%
- Current HPI
- 216.7203
- Rent YoY
- ▲ 4.43%
- Metro
- Williamsport, PA
- State GDP YoY
- ▲ 1.68%
- F500 in state
- 34
Industry mix (Fortune 500 HQ in PA)
| Industry | F500 HQs | Revenue |
|---|---|---|
| Healthcare | 2 | $309B |
|
||
| Insurance | 2 | $27B |
|
||
| Telecommunications / Media | 1 | $124B |
|
||
| Industrial Distribution | 1 | $22B |
|
||
| Financial Services | 1 | $20B |
|
||
| Chemicals / Materials | 1 | $18B |
|
||
Price history
+132.8% since first listed4 events — show timeline
- 2026-06-13 Listed $149,900 WBVAR
- 2018-12-04 Sold (Public Records) $65,400 Public Records
- 2018-11-30 Sold (MLS) — WBVAR
- 2018-08-28 Listed $64,400 WBVAR
Property tax history
+2.0%/yrLatest (2026): $2,305 · +2.5% YoY. Source: county tax records.
Cash-flow waterfall
monthlySold comps — $/sqft
last 12 mo · ≤1 miLoading sold comps…