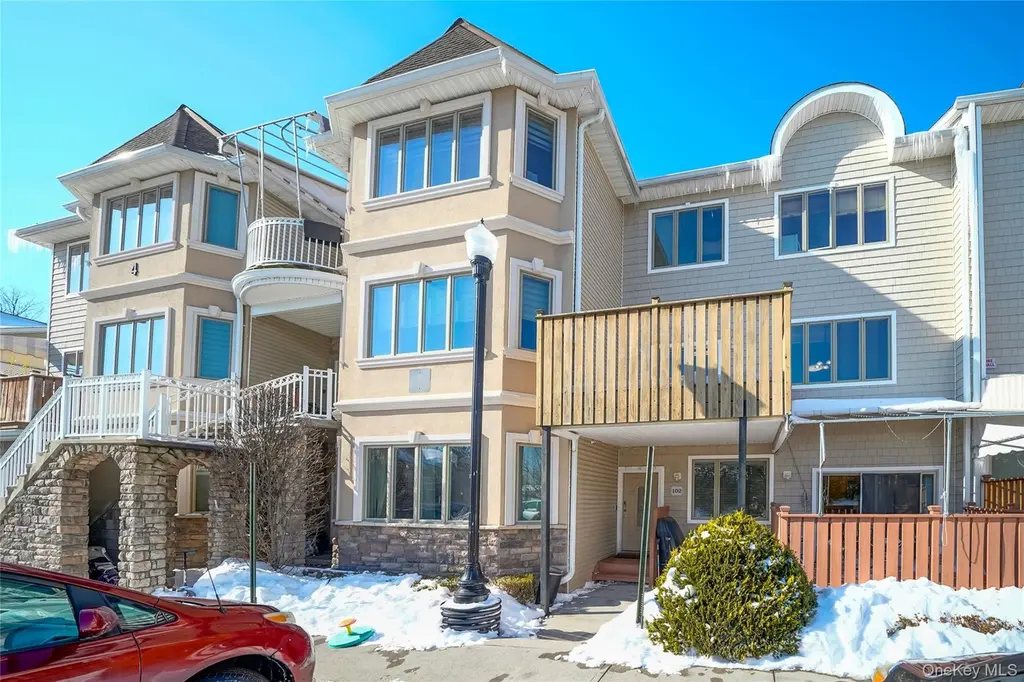
4 Rose Garden Way #102 · Monsey, NY
Flood risk 6/10 · Moderate
- FEMA flood zone
- X (unshaded)
- Chance of flooding over 30 yrs
- 0.27%
- Est. flood insurance / yr
- $473 – $860
Fire risk 2/10 · Minimal
- Est. fire insurance / yr
- $691 – $1,283
Heat risk 5/10 · Moderate
- Hot days now (above 97°F)
- 7 days/yr
- Hot days in 30 yrs
- 15 days/yr
Wind risk 4/10 · Minor
- Chance of severe wind over 30 yrs
- 22.0%
Air-quality risk 3/10 · Minor
- Unhealthy air days now
- 2 days/yr
- Unhealthy air days in 30 yrs
- 4 days/yr
Risk factors via First Street. Map © Google.
Why this score? — see what drove the C+ grade
The composite is a weighted blend of 9 inputs, each scored 0–100. Each bar is that input's sub-score; the figure is the points it added to the 100-point composite (weight × sub-score).
- Cash flow +26.8/30.0
- ARV discount +10.8/15.0
- DSCR +9.2/10.0
- 1% rule +7.6/10.0
- Livability +3.1/5.0
- Schools +2.6/10.0
- Rent growth +2.5/5.0
- Condition / age +2.2/5.0
- Appreciation +0.0/10.0
$949,000
🖨 Deal sheet 📄 Offer letter ✓ Due diligence
Listing remarks MLS
LOCATION, LOCATION, LOCATION! A RARE FIND LOCATED IN THE VERY HEART OF MONSEY. WALK TO SUPERMARKETS, DOZENS OF SHOPS, PUBLIC TRANSPORTATION, AND MORE. CLOSE TO MAJOR HIGHWAYS. THIS MINT CONDITION GARDEN CONDO FEATURES A GOURMET STYLE KITCHEN WITH GRANITE COUNTERS, STAINLESS STEEL APPLIANCES, PLUMBING FOR HOLIDAY KITCHEN, 4/5 BEDROOM, 2.5 BOUTIQUE BATHROOMS. THIS WALK-IN GARDEN APARTMENT HAS AN ADDITIONAL FINISHED SUPER-SIZED BASEMENT AND LARGE DECK. IT IS ON A LEVEL LOT FOR YOUR COMFORT AND CONVENIENCE. READY FOR YOU TO MOVE RIGHT IN. CONDO SIZE, LOT SIZE, AND TAXES ARE APPROXIMATE. THE HOUSE IS CURRENTLY RENTED FOR $3800.
Key facts
- Walk to supermarkets
- Granite counters
- $325 HOA
Tags
Neighborhood map
What this means for you Summary
Snapshot
- This is a 4-bed/2.5-bath condo listed at $949k. Condition is rated fair.
Deal economics
- At list price, monthly cash flow is $3k ($31k/yr) — positive.
- The deal already cash-flows at list — no discount required.
- Meets the 1% rule at list price ($12k rent vs $949k).
- Recommended offer: $835k (12.0% below list) — sets the bar for market timing.
- Cap rate 9.6% vs local median 1.7% in Monsey — top-decile yield for the area; either an underpriced asset or a hidden risk that comps aren't pricing in. Stress-test before assuming the spread holds.
Location & tenants
- Location reads 62/100 on livability (#862 in NY) — a middle-class / working-renter tenant base. Strengths: health & safety A-, crime B; Watch: employment D+, schools D, amenities D.
- East Ramapo Central School District (Spring Valley) (suburban): math 22% / reading 34% proficiency, ranked #576 of 590 in NY (top 98%) — low school quality limits family demand, transient renter base, plan for 1-2y turnover; 68% free/reduced lunch — lower-income household profile, screen leases tightly.
- Market conditions: 153 active listings in the ZIP; 1 comparable units currently listed for rent nearby; 429 units permitted in Rockland County in 2024 (231 in 5+ unit buildings).
Forward outlook
- Local home prices are declining (-3.0%/yr); year-one equity from $7k of loan paydown is wiped out by about $28k of value loss. Plan a longer hold.
- Rockland County population projected at +7% by 2050 — modest demand growth; plan on rents tracking national, not racing it.
- At projected returns (-3.0% appreciation + 3.0% rent growth), your $266k cash investment doubles in ~10 years — after that, you're playing with house money.
Negotiation context
- It's been on market 134 days — a 12% lower offer ($835k) is reasonable based on typical stale-listing flexibility.
Risks & watch-outs
- Climate carrying-cost: major flood risk; extreme-heat days projected 7→15/yr by 2055 (HVAC capex compounding) — expect insurance premiums to compound above CPI over the hold.
Questions for the listing agent
- It's been on market 134 days. Have you received any prior offers? Is the seller open to a 12% concession, seller financing, or rate buy-down credit?
- Have any recent inspections been done? Can we get a copy of the seller's disclosures and any deferred-maintenance estimates?
- What does the HOA fee cover, when was the last increase, and are there any pending special assessments or reserve-fund shortfalls?
- Any open or pending special assessments — roof, HVAC, plumbing, elevator, façade? What's the per-unit balance and payoff schedule, and is the seller paying it off at close or rolling it to the buyer?
- Why hasn't it sold? Are there any deal-killer items the seller is aware of (foundation, flood, title, zoning, code violations)?
- Is there a deadline driving the sale (1031 exchange, divorce, estate, relocation)? That informs how much negotiation room exists.
- Schools are D-rated, which usually means shorter tenancies and higher turnover. Who's the typical renter profile here, and what's been the actual vacancy rate?
- What's the average days-on-market for RENTAL listings here right now (not sales)? A rising rental-DOM trend means longer vacancies and softer asking-rent achievability than the comps imply.
- What's the recent tenant-quality profile in this submarket — average credit score on applications, eviction rate, late-payment / NSF rate, and stable-employment percentage? A property-management company in the area should have these aggregated.
- How much new apartment / multifamily construction is in the pipeline within 1–3 miles? Heavy new supply (>2% of stock underway) typically softens rents 12–24 months out; light construction supports rent growth.
Investment metrics
- 1% rule
- 1.26% ✓
- Cap rate
- 9.58%
- Cash-on-cash
- 11.73%
- DSCR
- 1.52
- GRM
- 6.6
CMA / ARV
- ARV (median comp)
- $1,022,939
- List price
- $949,000
- Delta
- -7.23%
- Verdict
- FAIR
- Comps
- 20 within 1.0 mi
Projected returns pro-forma
-3.0% appreciation · 3.0% rent growth · sell at horizon
- IRR
- 1.2%
- Equity multiple
- 1.05×
- Total profit
- $11,986
- Equity at exit
- $141,499
- IRR
- 10.8%
- Equity multiple
- 1.85×
- Total profit
- $224,942
- Equity at exit
- $82,052
Cash invested: $265,720 (down + closing). Projections, not guarantees.
Landlord ↔ Tenant lean methodology
- Overall (STATE)
- 15 Strongly Tenant-Friendly
- State New York
- 15 Strongly Tenant-Friendly · D+10
- County
- — inherits STATE
- City
- — inherits STATE
ZIP-level market 10952
- Active inventory
- 153
- Price-to-rent
- 6.6×
Monthly cashflow live
- Estimated rent
- $12,000 medium interval (Pro) →
- Mortgage (P&I)
- −$4,977
- Tax est. 1.5%
- −$1,186 /mo · $14,235/yr
- Insurance
- −$395
- HOA
- −$325
- Vacancy / Maint / Mgmt
- −$2,520
- Net cashflow
- $2,597
Break-even live
UW: 25.0% down · 7.5% · 30yr · 1.5% tax · 5.0% vac · 8.0% maint · 8.0% mgmt
Financing live
Cash to close
- Down payment
- $237,250
- Closing costs
- $28,470
- Reserves months
- —
- Total cash needed
- —
Loan-product check · same deal, 3 products live
Conventional
25% down · 7.5% · 30yr
- Down + closing
- —
- Monthly P&I
- —
- Monthly cashflow
- —
- DSCR
- —
- Eligible?
- —
Personal DTI + credit; lowest rate.
DSCR
20% down · 8.5% · 30yr
- Down + closing
- —
- Monthly P&I
- —
- Monthly cashflow
- —
- DSCR
- —
- Eligible?
- —
No personal income docs; deal must DSCR.
Hard money
10% down · 12.0% · 12mo
- Down + closing
- —
- Monthly P&I
- —
- Monthly cashflow
- —
- DSCR
- —
- Eligible?
- —
Short-term bridge; refi at stabilization.
Rent comps 1 comps
| Address | Beds | Baths | Sqft | Rent | $/sqft | DOM | Units | Dist |
|---|---|---|---|---|---|---|---|---|
| 9 E Stemmer Ln Suffern, NY | 5.0 | 3.0 | 2432 | $12,000 | $4.93 | 1d | 1 | 1.26mi |
HOA detail condo
- Monthly dues
- $325 · $3,900/yr
- Assessments
- None detected in remarks — confirm with the listing agent.
Listing history 16 events
-
2026-06-18days on market $949,000 Active 134 DOM
-
2026-06-17days on market $949,000 Active 133 DOM
-
2026-06-16days on market $949,000 Active 132 DOM
-
2026-06-15days on market $949,000 Active 131 DOM
-
2026-06-13days on market $949,000 Active 129 DOM
-
2026-06-13days on market $949,000 Active 128 DOM
-
2026-06-09days on market $949,000 Active 125 DOM
-
2026-06-08days on market $949,000 Active 124 DOM
-
2026-06-07days on market $949,000 Active 123 DOM
-
2026-06-04days on market $949,000 Active 120 DOM
-
2026-06-03days on market $949,000 Active 119 DOM
-
2026-06-02days on market $949,000 Active 118 DOM
-
2026-06-01days on market $949,000 Active 117 DOM
-
2026-05-31days on market $949,000 Active 116 DOM
-
2026-04-13price $949,000 634-char remark
Show marketing remark (634 chars)
LOCATION, LOCATION, LOCATION! A RARE FIND LOCATED IN THE VERY HEART OF MONSEY. WALK TO SUPERMARKETS, DOZENS OF SHOPS, PUBLIC TRANSPORTATION, AND MORE. CLOSE TO MAJOR HIGHWAYS. THIS MINT CONDITION GARDEN CONDO FEATURES A GOURMET STYLE KITCHEN WITH GRANITE COUNTERS, STAINLESS STEEL APPLIANCES, PLUMBING FOR HOLIDAY KITCHEN, 4/5 BEDROOM, 2.5 BOUTIQUE BATHROOMS. THIS WALK-IN GARDEN APARTMENT HAS AN ADDITIONAL FINISHED SUPER-SIZED BASEMENT AND LARGE DECK. IT IS ON A LEVEL LOT FOR YOUR COMFORT AND CONVENIENCE. READY FOR YOU TO MOVE RIGHT IN. CONDO SIZE, LOT SIZE, AND TAXES ARE APPROXIMATE. THE HOUSE IS CURRENTLY RENTED FOR $3800.
-
2026-02-04$979,000 Active 634-char remark
Show marketing remark (634 chars)
LOCATION, LOCATION, LOCATION! A RARE FIND LOCATED IN THE VERY HEART OF MONSEY. WALK TO SUPERMARKETS, DOZENS OF SHOPS, PUBLIC TRANSPORTATION, AND MORE. CLOSE TO MAJOR HIGHWAYS. THIS MINT CONDITION GARDEN CONDO FEATURES A GOURMET STYLE KITCHEN WITH GRANITE COUNTERS, STAINLESS STEEL APPLIANCES, PLUMBING FOR HOLIDAY KITCHEN, 4/5 BEDROOM, 2.5 BOUTIQUE BATHROOMS. THIS WALK-IN GARDEN APARTMENT HAS AN ADDITIONAL FINISHED SUPER-SIZED BASEMENT AND LARGE DECK. IT IS ON A LEVEL LOT FOR YOUR COMFORT AND CONVENIENCE. READY FOR YOU TO MOVE RIGHT IN. CONDO SIZE, LOT SIZE, AND TAXES ARE APPROXIMATE. THE HOUSE IS CURRENTLY RENTED FOR $3800.
ⓘ Source: listings_history table (triggers on properties + properties_extension) + one-shot
backfill from property_details.listing_events for pre-trigger history.
Climate risk First Street
- Flood 6/10 Major FEMA zone X (unshaded) · 27% chance over 30 yrs
- Wildfire 2/10 Low
- Heat 5/10 Major 7 d/yr ≥97°F today · 15 d/yr by 30 yrs out
- Wind 4/10 Moderate 22% chance of damaging wind over 30 yrs
- Air quality 3/10 Moderate 2 unhealthy d/yr today · 4 by 30 yrs out
Nearby sold comps map
Loading sold comps map…
Walkable amenities ~0.75 mi
Loading nearby amenities…
Taxation est. · year 1
- Rental income
- $144,000
- − Mortgage interest
- −$53,159
- − Property taxes
- −$14,235
- − Insurance
- −$4,745
- − Repairs & maintenance
- −$11,520
- − Management
- −$11,520
- − HOA
- −$3,900
- − Depreciation
- −$27,607
- Taxable income
- $17,314
- Est. tax owed @ 24.0%
- −$4,155
- After-tax cash flow
- $27,005/yr
For passive investors: Depreciation is non-cash, so a rental often shows a tax loss while cash-flowing — sheltering income. Rental losses are passive: they offset passive income freely, and up to $25,000/yr can offset ordinary (W-2) income if you actively participate and your MAGI is under $100k (phasing out to $0 by $150k); unused losses carry forward. On sale, claimed depreciation is recaptured at up to 25%, and gains may owe capital-gains tax (a 1031 exchange can defer both). Figures are a year-1 estimate at your 24.0% rate — not tax advice; consult a CPA.
Condition & rehab AI · 12 photos
This garden condo requires moderate repairs and maintenance to improve its condition and value. Paint and siding updates, along with landscaping, would significantly enhance its appeal.
Repairs flagged
- Moderate Exterior siding — Weathered appearance
- Minor Paint on interior walls — Slight fading
Value-add opportunities
- Resale Paint interior walls — Fresh paint enhances curb appeal and interior aesthetics
- Resale Replace exterior siding — New siding improves curb appeal and durability
- Both Landscaping improvements — Enhances curb appeal and adds value
- Rental HVAC maintenance — Ensures comfort and energy efficiency
Renovation cost estimate screening
| Repair item | Severity | Est. cost |
|---|---|---|
| Exterior siding · Weathered appearance | Moderate | $3,000–15,000 |
| Paint on interior walls · Slight fading | Minor | $500–3,000 |
| Total estimated repair cost · 2 items | $3,500–18,000 |
Value-add ROI direction
- Resale Paint interior walls — Fresh paint enhances curb appeal and interior aesthetics ↑
- Resale Replace exterior siding — New siding improves curb appeal and durability ↑
- Both Landscaping improvements — Enhances curb appeal and adds value ↑
- Rental HVAC maintenance — Ensures comfort and energy efficiency ↑
ⓘ Cost ranges are severity-bucket heuristics (US national rule-of-thumb). Get contractor quotes + a written scope before underwriting a rehab budget.
Schools (NCES district)
- District
- East Ramapo Central School District (Spring Valley)
- NCES district ID
- 3627810
- Math proficiency
- 22% ▼ -10.00%
- Reading proficiency
- 34% ▼ -2.00%
- Median HH income
- $61,547
- Composite
- 25.6/100
- National rank
- #7418
- State rank
- #576 of 590 in NY
Livability — Monsey
- Score
- 62/100
- State rank
- #862
- US rank
- #16633
Category grades
Schools grade is shown separately in the Schools card above.
Census & demographics
- Census place
- Monsey, NY
- City population
- 47,169
- Population (ZIP)
- 47,169
Population outlook (Rockland County) Hauer SSP2
- Today (2025)
- 339,642 people
- By 2030
- 345,987 · +1.9%
- By 2040
- 357,178 · +5.2%
- By 2050
- 362,456 · +6.7%
- By 2075
- 367,281 · +8.1%
- By 2100
- 328,211 · -3.4%
Race, ethnicity, and origin ACS 2023
- Neighborhood character
- Predominantly White (88%)
- Race & ethnicity
- White 88% Black 6% Hispanic / Latino 4% Two or more races 3%
- Common ancestry
- Romanian 7% Italian 5% Hispanic 5%
- Foreign-born
- 12% · Canada
- Languages at home
- 34% English-only · German/W. Germanic 55% French/Haitian/Cajun 5% Spanish 2%
Political lean MEDSL · Rockland
- 2024 margin
- R (+11.8) · D 44.1% · R 55.9%
- 2008→2024 swing
- -17.7pp toward R · 2008: 5.9pp · 2024: -11.8pp
- All cycles
- 2024: R+11.8 2020: D+1.7 2016: D+5.1 2012: D+6.6 2008: D+5.9
Not yet ingested
- Civics
- —
Market trends
- HPI YoY
- ▼ -671.35%
- Current HPI
- 399.2068
- Rent YoY
- —
- Metro
- —
- State GDP YoY
- ▲ 2.60%
- F500 in state
- 92
Industry mix (Fortune 500 HQ in NY)
| Industry | F500 HQs | Revenue |
|---|---|---|
| Financial Services | 10 | $950B |
|
||
| Consumer Goods | 9 | $162B |
|
||
| Insurance | 4 | $225B |
|
||
| Telecommunications | 2 | $144B |
|
||
| Pharmaceuticals | 2 | $112B |
|
||
| Media / Entertainment | 2 | $69B |
|
||
Price history
-3.1% since first listed2 events — show timeline
- 2026-04-13 Price Changed $949,000 OneKey® MLS as Distributed by MLS Grid
- 2026-02-04 Listed $979,000 OneKey® MLS as Distributed by MLS Grid
Cash-flow waterfall
monthlySold comps — $/sqft
last 12 mo · ≤1 miLoading sold comps…