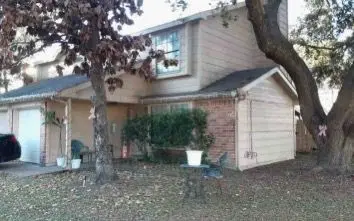
 Duplex
10113 Spring Place Dr · Houston, TX
Flood risk 6/10 · Moderate
- FEMA flood zone
- X (shaded)
- Chance of flooding over 30 yrs
- 0.71%
- Est. flood insurance / yr
- $507 – $1,088
Fire risk 1/10 · Minimal
- Est. fire insurance / yr
- $1,222 – $2,270
Heat risk 9/10 · Severe
- Hot days now (above 110°F)
- 7 days/yr
- Hot days in 30 yrs
- 23 days/yr
Wind risk 8/10 · Major
- Chance of severe wind over 30 yrs
- 99.0%
Air-quality risk 3/10 · Minor
- Unhealthy air days now
- 2 days/yr
- Unhealthy air days in 30 yrs
- 3 days/yr
Risk factors via First Street. Map © Google.
Why this score? — see what drove the C- grade
The composite is a weighted blend of 9 inputs, each scored 0–100. Each bar is that input's sub-score; the figure is the points it added to the 100-point composite (weight × sub-score).
- Cash flow +16.9/30.0
- ARV discount +9.2/15.0
- 1% rule +5.6/10.0
- DSCR +5.3/10.0
- Schools +4.4/10.0
- Livability +3.7/5.0
- Rent growth +2.7/5.0
- Condition / age +2.5/5.0
- Appreciation +0.0/10.0
$309,000
🖨 Deal sheet 📄 Offer letter ✓ Due diligence
Multi-family units
County records classify this as Multi-Family (2-4 Unit). Listing-text estimate: 2 units. confirmed
Listing remarks MLS
BACK ON THE MARKET!! PRICE REDUCED!! I have a copy of an appraisal that was done in June, 2025. We have an existing survey, tenants been on property for roughly a decade. Tenants pay utilities. NO gas lines. NEW roof in November, 2024
Key facts
- 6,380 sq ft lot
- Built 1983
- Listed 158 days
Neighborhood map
What this means for you Summary
Snapshot
- This is a 2 × 3-bed/?-bath units multifamily listed at $309k.
Deal economics
- At list price, monthly cash flow is $206 ($2k/yr) — positive. Per door: $103/mo.
- The deal already cash-flows at list — no discount required.
- Meets the 1% rule at list price ($3k rent vs $309k).
- Recommended offer: $272k (12.0% below list) — sets the bar for market timing.
- Cap rate 7.1% vs local median 3.2% in Houston — top-decile yield for the area; either an underpriced asset or a hidden risk that comps aren't pricing in. Stress-test before assuming the spread holds.
Location & tenants
- Location reads 74/100 on livability (#184 in TX, #4,771 nationally) — a middle-class / working-renter tenant base. Strengths: amenities A+, cost of living A+, housing A+; Watch: schools D, crime F.
- Cypress-Fairbanks ISD (suburban): math 45% / reading 52% proficiency, ranked #161 of 826 in TX (top 20%) — families likely to look elsewhere, expect single-tenant / working-renter base with shorter leases.
- Market conditions: Rents flat; 235 active listings in the ZIP; solid renter incomes; 29,883 units permitted in Harris County in 2024 (8,621 in 5+ unit buildings).
- At $3,276/mo this rent would consume 51% of the median local household income ($77k/yr) (locally 2924% of renters already pay >50% of income on rent) — very limited rent-growth headroom before tenants either downsize or default.
Forward outlook
- Local home prices are declining (-3.0%/yr); year-one equity from $2k of loan paydown is wiped out by about $9k of value loss. Plan a longer hold.
- Harris County population projected at +47% by 2050 — long-run rental-demand tailwind backs the buy-and-hold thesis.
Negotiation context
- It's been on market 158 days — a 12% lower offer ($272k) is reasonable based on typical stale-listing flexibility.
- 18 sale attempts since 15y ago; this cycle's ask has dropped $21k (6%) from the opening price — seller is motivated, your offer sets the floor, not the list.
- Current owner paid $86k; list at $309k implies a 259% gain — meaningful room to come down on a strong offer.
Risks & watch-outs
- Climate carrying-cost: major flood risk; severe wind risk, 99% chance of damaging wind over 30y; extreme-heat days projected 7→23/yr by 2055 (HVAC capex compounding) — expect insurance premiums to compound above CPI over the hold.
Questions for the listing agent
- It's been on market 158 days. Have you received any prior offers? Is the seller open to a 12% concession, seller financing, or rate buy-down credit?
- Can we see the unit-by-unit rent roll, current vacancy, and any below-market leases? What's the average tenancy length?
- What capital expenditures (roof, boiler, parking lot, exteriors) have been made in the last 5 years, and what's planned in the next 2?
- Why hasn't it sold? Are there any deal-killer items the seller is aware of (foundation, flood, title, zoning, code violations)?
- Is there a deadline driving the sale (1031 exchange, divorce, estate, relocation)? That informs how much negotiation room exists.
- Schools are D-rated, which usually means shorter tenancies and higher turnover. Who's the typical renter profile here, and what's been the actual vacancy rate?
- Crime grade is F in this area — have there been break-ins, vandalism, or insurance claims at this property in the last 3 years? What carrier currently insures it and at what premium?
- What's the average days-on-market for RENTAL listings here right now (not sales)? A rising rental-DOM trend means longer vacancies and softer asking-rent achievability than the comps imply.
- What's the recent tenant-quality profile in this submarket — average credit score on applications, eviction rate, late-payment / NSF rate, and stable-employment percentage? A property-management company in the area should have these aggregated.
- How much new apartment / multifamily construction is in the pipeline within 1–3 miles? Heavy new supply (>2% of stock underway) typically softens rents 12–24 months out; light construction supports rent growth.
Investment metrics
- 1% rule
- 1.06% ✓
- Cap rate
- 7.09%
- Cash-on-cash
- 2.86%
- DSCR
- 1.13
- GRM
- 7.9
CMA / ARV
- ARV (median comp)
- $320,907
- List price
- $309,000
- Delta
- -3.71%
- Verdict
- FAIR
- Comps
- 7 within 1.0 mi
Show comp detail 3 sales within ~0.75 mi
| Address | Dist | Beds/Ba | Sqft | Sold | Price | $/sf | Match |
|---|---|---|---|---|---|---|---|
| 10033 Emerald Creek Dr | 0.09mi | 6/4.0 | 2,576 (0%) | 14mo | $330,000 | $128 | 81 |
| 10040 Spring Place Dr | 0.08mi | 6/4.0 | 2,576 (0%) | 16mo | $330,000 | $128 | 78 |
| 10012 Spring Place Dr | 0.16mi | 6/2.0 | 2,507 (-3%) | 18mo | $330,000 | $132 | 61 |
Match score weights: distance 35% · size 25% · config 20% · recency 20%. Top-matched comps best support the ARV.
Projected returns pro-forma
-3.0% appreciation · 0.91% rent growth · sell at horizon
- IRR
- -14.3%
- Equity multiple
- 0.50×
- Total profit
- $-43,493
- Equity at exit
- $46,073
- IRR
- -9.8%
- Equity multiple
- 0.46×
- Total profit
- $-46,709
- Equity at exit
- $26,717
Cash invested: $86,520 (down + closing). Projections, not guarantees.
Landlord ↔ Tenant lean methodology
- Overall (STATE)
- 87 Strongly Landlord-Friendly
- State Texas
- 87 Strongly Landlord-Friendly · R+5
- County
- — inherits STATE
- City
- — inherits STATE
ZIP-level market 77070
- Rents YoY
- 0.9%
- Active inventory
- 235
- Price-to-rent
- 15.7×
Monthly cashflow live
- Estimated rent
- $3,276 high interval (Pro) →
- Mortgage (P&I)
- −$1,620
- Tax from tax record
- −$633 /mo · $7,593/yr
- Insurance
- −$129
- HOA
- −$0
- Vacancy / Maint / Mgmt
- −$688
- Net cashflow
- $206
Break-even live
2-unit breakdown (identical units grouped — click to expand)
| Units | Beds | Baths | Est. rent |
|---|---|---|---|
| 2× units | 3 | — | $3,276 |
| #1 | 3 | — | $1,638 |
| #2 | 3 | — | $1,638 |
| Total (2 units) | $3,276 | ||
UW: 25.0% down · 7.5% · 30yr · 1.5% tax · 5.0% vac · 8.0% maint · 8.0% mgmt
Financing live
Cash to close
- Down payment
- $77,250
- Closing costs
- $9,270
- Reserves months
- —
- Total cash needed
- —
Loan-product check · same deal, 3 products live
Conventional
25% down · 7.5% · 30yr
- Down + closing
- —
- Monthly P&I
- —
- Monthly cashflow
- —
- DSCR
- —
- Eligible?
- —
Personal DTI + credit; lowest rate.
DSCR
20% down · 8.5% · 30yr
- Down + closing
- —
- Monthly P&I
- —
- Monthly cashflow
- —
- DSCR
- —
- Eligible?
- —
No personal income docs; deal must DSCR.
Hard money
10% down · 12.0% · 12mo
- Down + closing
- —
- Monthly P&I
- —
- Monthly cashflow
- —
- DSCR
- —
- Eligible?
- —
Short-term bridge; refi at stabilization.
Listing history 50 events
-
2026-06-18days on market $309,000 Active 158 DOM
-
2026-06-17days on market $309,000 Active 157 DOM
-
2026-06-16days on market $309,000 Active 156 DOM
-
2026-06-15price $309,000 Active 155 DOM
-
2026-06-15days on market $310,500 Active 155 DOM
-
2026-06-13days on market $310,500 Active 153 DOM
-
2026-06-13days on market $310,500 Active 152 DOM
-
2026-06-09days on market $310,500 Active 149 DOM
-
2026-06-08days on market $310,500 Active 148 DOM
-
2026-06-07days on market $310,500 Active 147 DOM
-
2026-06-04days on market $310,500 Active 144 DOM
-
2026-06-03days on market $310,500 Active 143 DOM
-
2026-06-02days on market $310,500 Active 142 DOM
-
2026-06-02days on market $310,500 Active 141 DOM
-
2026-05-31days on market $310,500 Active 140 DOM
-
2026-05-15price $310,500 234-char remark
Show marketing remark (234 chars)
BACK ON THE MARKET!! PRICE REDUCED!! I have a copy of an appraisal that was done in June, 2025. We have an existing survey, tenants been on property for roughly a decade. Tenants pay utilities. NO gas lines. NEW roof in November, 2024
-
2026-05-15status Active 234-char remark
Show marketing remark (234 chars)
BACK ON THE MARKET!! PRICE REDUCED!! I have a copy of an appraisal that was done in June, 2025. We have an existing survey, tenants been on property for roughly a decade. Tenants pay utilities. NO gas lines. NEW roof in November, 2024
-
2026-05-15historical 234-char remark
Show marketing remark (234 chars)
BACK ON THE MARKET!! PRICE REDUCED!! I have a copy of an appraisal that was done in June, 2025. We have an existing survey, tenants been on property for roughly a decade. Tenants pay utilities. NO gas lines. NEW roof in November, 2024
-
2026-05-01price $311,000 234-char remark
Show marketing remark (234 chars)
BACK ON THE MARKET!! PRICE REDUCED!! I have a copy of an appraisal that was done in June, 2025. We have an existing survey, tenants been on property for roughly a decade. Tenants pay utilities. NO gas lines. NEW roof in November, 2024
-
2026-04-22status Active 234-char remark
Show marketing remark (234 chars)
BACK ON THE MARKET!! PRICE REDUCED!! I have a copy of an appraisal that was done in June, 2025. We have an existing survey, tenants been on property for roughly a decade. Tenants pay utilities. NO gas lines. NEW roof in November, 2024
-
2026-04-22historical 234-char remark
Show marketing remark (234 chars)
BACK ON THE MARKET!! PRICE REDUCED!! I have a copy of an appraisal that was done in June, 2025. We have an existing survey, tenants been on property for roughly a decade. Tenants pay utilities. NO gas lines. NEW roof in November, 2024
-
2026-04-21price $314,000 234-char remark
Show marketing remark (234 chars)
BACK ON THE MARKET!! PRICE REDUCED!! I have a copy of an appraisal that was done in June, 2025. We have an existing survey, tenants been on property for roughly a decade. Tenants pay utilities. NO gas lines. NEW roof in November, 2024
-
2026-03-23historical 234-char remark
Show marketing remark (234 chars)
BACK ON THE MARKET!! PRICE REDUCED!! I have a copy of an appraisal that was done in June, 2025. We have an existing survey, tenants been on property for roughly a decade. Tenants pay utilities. NO gas lines. NEW roof in November, 2024
-
2026-03-23status Active 234-char remark
Show marketing remark (234 chars)
BACK ON THE MARKET!! PRICE REDUCED!! I have a copy of an appraisal that was done in June, 2025. We have an existing survey, tenants been on property for roughly a decade. Tenants pay utilities. NO gas lines. NEW roof in November, 2024
-
2026-03-08status Active 234-char remark
Show marketing remark (234 chars)
BACK ON THE MARKET!! PRICE REDUCED!! I have a copy of an appraisal that was done in June, 2025. We have an existing survey, tenants been on property for roughly a decade. Tenants pay utilities. NO gas lines. NEW roof in November, 2024
-
2026-03-08historical 234-char remark
Show marketing remark (234 chars)
BACK ON THE MARKET!! PRICE REDUCED!! I have a copy of an appraisal that was done in June, 2025. We have an existing survey, tenants been on property for roughly a decade. Tenants pay utilities. NO gas lines. NEW roof in November, 2024
-
2026-03-07price $314,900 234-char remark
Show marketing remark (234 chars)
BACK ON THE MARKET!! PRICE REDUCED!! I have a copy of an appraisal that was done in June, 2025. We have an existing survey, tenants been on property for roughly a decade. Tenants pay utilities. NO gas lines. NEW roof in November, 2024
-
2026-02-28price $327,500 234-char remark
Show marketing remark (234 chars)
BACK ON THE MARKET!! PRICE REDUCED!! I have a copy of an appraisal that was done in June, 2025. We have an existing survey, tenants been on property for roughly a decade. Tenants pay utilities. NO gas lines. NEW roof in November, 2024
-
2026-01-12$329,900 Active 234-char remark
Show marketing remark (234 chars)
BACK ON THE MARKET!! PRICE REDUCED!! I have a copy of an appraisal that was done in June, 2025. We have an existing survey, tenants been on property for roughly a decade. Tenants pay utilities. NO gas lines. NEW roof in November, 2024
-
2025-12-30historical
-
2025-09-29status Active
-
2025-09-28historical
-
2025-09-18price $334,000
-
2025-08-30status Active
-
2025-08-14historical
-
2025-08-08price $334,500
-
2025-08-05status Active
-
2025-07-08
-
2025-06-27historical
-
2025-06-19status Active
-
2025-06-18historical
-
2025-04-25price $335,000
-
2025-04-17status Active
-
2025-04-17historical
-
2025-04-09price $337,500
-
2025-03-27$339,000 Active
-
2024-04-14historical
-
2024-04-05price $339,900
-
2024-03-16status Active
-
2024-03-16historical
ⓘ Source: listings_history table (triggers on properties + properties_extension) + one-shot
backfill from property_details.listing_events for pre-trigger history.
Tax reassessment forecast TX · Resets to sale price
- Current annual tax
- $7,593 · $633/mo
- Projected year-2 tax
- $7,593 · $633/mo
- Expected delta
- $0/yr ($0/mo · 0.0%)
ⓘ Screening estimate from a state-policy table — verify with the county assessor before closing.
Climate risk First Street
- Flood 6/10 Major FEMA zone X (shaded) · 71% chance over 30 yrs
- Wildfire 1/10 Low
- Heat 9/10 Extreme 7 d/yr ≥110°F today · 23 d/yr by 30 yrs out
- Wind 8/10 Severe 99% chance of damaging wind over 30 yrs
- Air quality 3/10 Moderate 2 unhealthy d/yr today · 3 by 30 yrs out
Nearby sold comps map
Loading sold comps map…
Walkable amenities ~0.75 mi
Loading nearby amenities…
Taxation est. · year 1
- Rental income
- $39,312
- − Mortgage interest
- −$17,309
- − Property taxes
- −$7,593
- − Insurance
- −$1,545
- − Repairs & maintenance
- −$3,145
- − Management
- −$3,145
- − Depreciation
- −$8,989
- Taxable loss
- −$2,414
- Est. tax savings @ 24.0%
- +$579
- After-tax cash flow
- $3,053/yr
For passive investors: Depreciation is non-cash, so a rental often shows a tax loss while cash-flowing — sheltering income. Rental losses are passive: they offset passive income freely, and up to $25,000/yr can offset ordinary (W-2) income if you actively participate and your MAGI is under $100k (phasing out to $0 by $150k); unused losses carry forward. On sale, claimed depreciation is recaptured at up to 25%, and gains may owe capital-gains tax (a 1031 exchange can defer both). Figures are a year-1 estimate at your 24.0% rate — not tax advice; consult a CPA.
Schools (NCES district)
- District
- Cypress-Fairbanks ISD
- NCES district ID
- 4816110
- Math proficiency
- 45% ▼ -12.00%
- Reading proficiency
- 52% ▼ -2.00%
- Median HH income
- $72,025
- Composite
- 43.63/100
- National rank
- #2968
- State rank
- #161 of 826 in TX
Livability — Houston
- Score
- 74/100
- State rank
- #184
- US rank
- #4771
Category grades
Schools grade is shown separately in the Schools card above.
Census & demographics
- County
- Harris County · 4,702,590 people
- City population
- 3,226,434
- Metro
- Houston-The Woodlands-Sugar Land, TX
- Population (ZIP)
- 58,229
- Household income
- $77,397
- Rent vs Own
- Severe rent burden
- 2924.0
Population outlook (Harris County) Hauer SSP2
- Today (2025)
- 5,571,493 people
- By 2030
- 6,089,821 · +9.3%
- By 2040
- 7,142,806 · +28.2%
- By 2050
- 8,185,864 · +46.9%
- By 2075
- 10,574,329 · +89.8%
- By 2100
- 12,109,958 · +117.4%
Race, ethnicity, and origin ACS 2023
- Neighborhood character
- Highly diverse neighborhood (Simpson 0.73)
- Race & ethnicity
- White 35% Hispanic / Latino 31% Black 19% Two or more races 16% Asian 11% Native American 1%
- Hispanic origin (detail)
- Mexican 20% Cuban 1%
- Common ancestry
- Lithuanian 2% Slovak 1% Romanian 1%
- Foreign-born
- 23% · Canada, Vietnam, Jamaica
- Languages at home
- 64% English-only · Spanish 24% Vietnamese 4% Other Indo-European 2%
Political lean MEDSL · Harris
- 2024 margin
- Lean D (+5.5) · D 52.0% · R 46.4% · Other 1.6%
- 2008→2024 swing
- +3.9pp toward D · 2008: 1.6pp · 2024: 5.5pp
- All cycles
- 2024: D+5.5 2020: D+13.3 2016: D+12.4 2012: D+0.1 2008: D+1.6
Not yet ingested
- Civics
- —
Market trends
- HPI YoY
- ▼ -130.95%
- Current HPI
- 232.3128
- Rent YoY
- ▲ 0.91%
- Metro
- Houston-The Woodlands-Sugar Land, TX
- State GDP YoY
- ▲ 3.95%
- F500 in state
- 110
Industry mix (Fortune 500 HQ in TX)
| Industry | F500 HQs | Revenue |
|---|---|---|
| Energy | 16 | $1,198B |
|
||
| Technology | 5 | $198B |
|
||
| Engineering / Construction | 4 | $72B |
|
||
| Energy Services | 3 | $60B |
|
||
| Utilities | 3 | $41B |
|
||
| Healthcare | 2 | $330B |
|
||
Price history
+261.0% since first listed50 events — show timeline
- 2026-05-15 Price Changed $310,500 HARMLS
- 2026-05-15 Relisted — HARMLS
- 2026-05-15 Listing Removed — HARMLS
- 2026-05-01 Price Changed $311,000 HARMLS
- 2026-04-22 Relisted — HARMLS
- 2026-04-22 Listing Removed — HARMLS
- 2026-04-21 Price Changed $314,000 HARMLS
- 2026-03-23 Listing Removed — HARMLS
- 2026-03-23 Relisted — HARMLS
- 2026-03-08 Relisted — HARMLS
- 2026-03-08 Listing Removed — HARMLS
- 2026-03-07 Price Changed $314,900 HARMLS
- 2026-02-28 Price Changed $327,500 HARMLS
- 2026-01-12 Listed $329,900 HARMLS
- 2025-12-30 Listing Removed — HARMLS
- 2025-09-29 Relisted — HARMLS
- 2025-09-28 Listing Removed — HARMLS
- 2025-09-18 Price Changed $334,000 HARMLS
- 2025-08-30 Relisted — HARMLS
- 2025-08-14 Listing Removed — HARMLS
- 2025-08-08 Price Changed $334,500 HARMLS
- 2025-08-05 Relisted — HARMLS
- 2025-07-08 Listed for Rent — HARMLS
- 2025-06-27 Listing Removed — HARMLS
- 2025-06-19 Relisted — HARMLS
- 2025-06-18 Listing Removed — HARMLS
- 2025-04-25 Price Changed $335,000 HARMLS
- 2025-04-17 Relisted — HARMLS
- 2025-04-17 Listing Removed — HARMLS
- 2025-04-09 Price Changed $337,500 HARMLS
- 2025-03-27 Listed $339,000 HARMLS
- 2024-04-14 Listing Removed — HARMLS
- 2024-04-05 Price Changed $339,900 HARMLS
- 2024-03-16 Relisted — HARMLS
- 2024-03-16 Listing Removed — HARMLS
- 2024-03-12 Price Changed $345,500 HARMLS
- 2024-03-04 Relisted — HARMLS
- 2024-03-03 Listing Removed — HARMLS
- 2024-02-16 Price Changed $347,500 HARMLS
- 2024-01-26 Price Changed $349,900 HARMLS
- 2024-01-26 Relisted — HARMLS
- 2023-12-19 Listing Removed — HARMLS
- 2023-12-07 Listed $359,900 HARMLS
- 2015-09-23 Listing Removed — HARMLS
- 2015-07-25 Listed $175,000 HARMLS
- 2012-04-16 Sold (Public Records) — Public Records
- 2012-04-05 Sold (MLS) — HARMLS
- 2011-12-02 Listing Removed — HARMLS
- 2011-09-29 Listed $130,000 HARMLS
- 1996-11-01 Sold (Public Records) $86,000 Public Records
Property tax history
+4.3%/yrLatest (2025): $7,593 · +15.8% YoY. Source: county tax records.
Cash-flow waterfall
monthlySold comps — $/sqft
last 12 mo · ≤1 miLoading sold comps…