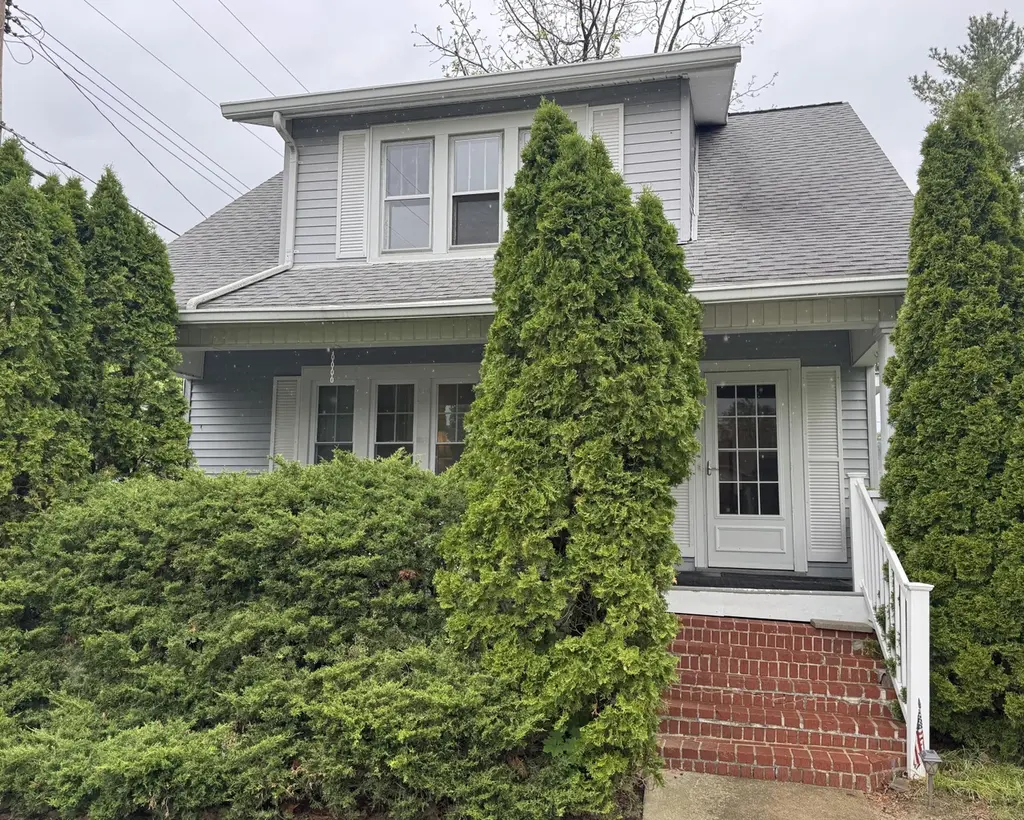
118 Hampton Pl · Springfield, OH
Flood risk 1/10 · Minimal
- FEMA flood zone
- X (unshaded)
- Chance of flooding over 30 yrs
- 0.0%
- Est. flood insurance / yr
- $473 – $860
Fire risk 1/10 · Minimal
- Est. fire insurance / yr
- $713 – $1,323
Heat risk 3/10 · Minor
- Hot days now (above 100°F)
- 7 days/yr
- Hot days in 30 yrs
- 18 days/yr
Wind risk 2/10 · Minimal
- Chance of severe wind over 30 yrs
- —
Air-quality risk 3/10 · Minor
- Unhealthy air days now
- 2 days/yr
- Unhealthy air days in 30 yrs
- 3 days/yr
Risk factors via First Street. Map © Google.
Why this score? — see what drove the D grade
The composite is a weighted blend of 9 inputs, each scored 0–100. Each bar is that input's sub-score; the figure is the points it added to the 100-point composite (weight × sub-score).
- ARV discount +15.0/15.0
- Cash flow +11.1/30.0
- 1% rule +3.5/10.0
- DSCR +3.2/10.0
- Livability +2.8/5.0
- Rent growth +2.5/5.0
- Condition / age +2.5/5.0
- Schools +1.9/10.0
- Appreciation +0.0/10.0
$150,000
🖨 Deal sheet 📄 Offer letter ✓ Due diligence
Listing remarks
ONSITE PUBLIC AUCTION - Thursday, May 28 at 12noon. This Ridgewood home has all the charm and character you could ask for. Home features modern updates with old style charm that newer homes just don't have! Updated kitchen with granite countertops and stainless steel appliances, off kitchen is cute finished back patio, updated half bath off kitchen with granite, large living room open to dining room with built in bench & closet, some replacement windows, furnace 2024, central air, upstairs has full bath & 2 bedrooms with lots of closet space, front porch, & 20' x 20' detached garage. Great home in a great neighborhood. Appraised at $150,000. Terms - 10% of the purchase pr
Key facts
- Updated half bath
- Large living room
- Updated kitchen
Tags
Property features AI
Exterior
- Parking: 2-car garage
- Utilities: Supplied water; Public sewer
- Home design: Single family residence; Residential property; Built in 1916; Located in the Ridgewood subdivision
- Construction: Vinyl siding; Block foundation
- Exterior features: Residential lot; Lot dimensions approximately 53 x 121 (0.14 acre)
Interior
- Kitchen: Cooktop; Range; Refrigerator
- Bathrooms: 2 total bathrooms; 1 full bathroom; 1 half bathroom
- Heating & cooling: Central air conditioning; Forced air heating (natural gas)
- Interior features: Cooktop, Range, Refrigerator; Full unfinished basement
Neighborhood map
What this means for you Summary
Snapshot
- This is a 2-bed/1.5-bath single-family listed at $150k.
Deal economics
- At list price, monthly cash flow is $-61 ($-732/yr) — negative.
- To cash-flow at today's rent, offer at most $139k (7.2% below list).
- To meet the 1% rule (rent ≥ 1% of price), the offer needs to be $127k (15.4% below list).
- Recommended offer: $127k (15.4% below list) — sets the bar for 1% rule.
- Cap rate 5.8% vs local median 4.8% in Springfield — meaningfully above typical; check what's discounted (condition, days-on-market, listing class) to confirm the premium yield is real.
Location & tenants
- Location reads 56/100 on livability (#1,108 in OH) — a working-class tenant base; expect higher turnover. Strengths: cost of living A+, housing A+; Watch: crime F, amenities F, commute F.
- Springfield City School District (urban): math 20% / reading 27% proficiency, ranked #616 of 656 in OH (top 94%) — low school quality limits family demand, transient renter base, plan for 1-2y turnover; 75% free/reduced lunch — lower-income household profile, screen leases tightly.
- Market conditions: 93 active listings in the ZIP; 232 units permitted in Clark County in 2024 (116 in 5+ unit buildings).
Forward outlook
- Local home prices are declining (-3.0%/yr); year-one equity from $1k of loan paydown is wiped out by about $4k of value loss. Plan a longer hold.
- Clark County population projected at -16% by 2050 — secular population decline; favor cash flow + early exit over multi-decade hold.
Negotiation context
- It's been on market 27 days — a 2% lower offer ($148k) is reasonable based on typical stale-listing flexibility.
Risks & watch-outs
- Watch-outs: built in 1916 — expect roof / HVAC / electrical / plumbing capex.
Questions for the listing agent
- What do current leases actually rent for vs. the listed asking? Can we see a recent rent roll and the last 12 months of T-12 income?
- Built in 1916 — when were the roof, HVAC, electrical panel, plumbing, and water heater last replaced?
- Is there a deadline driving the sale (1031 exchange, divorce, estate, relocation)? That informs how much negotiation room exists.
- Crime grade is F in this area — have there been break-ins, vandalism, or insurance claims at this property in the last 3 years? What carrier currently insures it and at what premium?
- The area grade is low — what's the realistic commute time and amenity access for the typical tenant pool here? Any planned neighborhood developments (good or bad) we should know about?
- What's the average days-on-market for RENTAL listings here right now (not sales)? A rising rental-DOM trend means longer vacancies and softer asking-rent achievability than the comps imply.
- What's the recent tenant-quality profile in this submarket — average credit score on applications, eviction rate, late-payment / NSF rate, and stable-employment percentage? A property-management company in the area should have these aggregated.
- How much new for-sale + rental construction is in the pipeline within 1–3 miles? Heavy new supply typically softens prices + rents 12–24 months out; constrained supply supports both.
Investment metrics
- 1% rule
- 0.85% ✗
- Cap rate
- 5.80%
- Cash-on-cash
- -1.74%
- DSCR
- 0.92
- GRM
- 9.8
CMA / ARV
- ARV (median comp)
- $210,393
- List price
- $150,000
- Delta
- -28.70%
- Verdict
- UNDERPRICED
- Comps
- 20 within 1.0 mi
Show comp detail 12 sales within ~0.75 mi
| Address | Dist | Beds/Ba | Sqft | Sold | Price | $/sf | Match |
|---|---|---|---|---|---|---|---|
| 132 S Kensington Pl | 0.20mi | 3/1.5 (+1) | 1,585 (+2%) | 6mo | $225,000 | $142 | 78 |
| 141 S Kensington Pl | 0.18mi | 3/1.5 (+1) | 1,668 (+7%) | 2mo | $193,500 | $116 | 74 |
| 232 Ardmore Rd | 0.31mi | 2/2.0 | 1,684 (+8%) | 6mo | $259,900 | $154 | 66 |
| 1718 Northpoint Ln | 0.37mi | 3/2.0 (+1) | 1,475 (-5%) | 2mo | $289,900 | $197 | 65 |
| 1710 Northpoint Rd | 0.39mi | 3/2.0 (+1) | 1,475 (-5%) | 4mo | $275,000 | $186 | 63 |
| 259 N Broadmoor Blvd | 0.42mi | 3/2.0 (+1) | 1,612 (+3%) | 7mo | $275,000 | $171 | 62 |
| 264 S Broadmoor Blvd | 0.41mi | 3/1.5 (+1) | 1,416 (-9%) | 2mo | $274,900 | $194 | 59 |
| 271 S Broadmoor Blvd | 0.41mi | 3/1.5 (+1) | 1,721 (+10%) | 4mo | $259,900 | $151 | 56 |
| 1330 Garfield Ave | 0.45mi | 3/2.0 (+1) | 1,381 (-12%) | 2mo | $227,500 | $165 | 51 |
| 260 Glendale Dr | 0.49mi | 3/2.5 (+1) | 1,373 (-12%) | 8mo | $270,000 | $197 | 42 |
| 504 Dover Rd | 0.63mi | 3/2.5 (+1) | 1,706 (+9%) | 7mo | $265,000 | $155 | 40 |
| 330 W 1st St | 0.71mi | 3/1.0 (+1) | 1,362 (-13%) | 1mo | $160,000 | $117 | 38 |
Match score weights: distance 35% · size 25% · config 20% · recency 20%. Top-matched comps best support the ARV.
Projected returns pro-forma
-3.0% appreciation · 3.0% rent growth · sell at horizon
- IRR
- -19.1%
- Equity multiple
- 0.33×
- Total profit
- $-28,157
- Equity at exit
- $22,365
- IRR
- -11.7%
- Equity multiple
- 0.30×
- Total profit
- $-29,377
- Equity at exit
- $12,969
Cash invested: $42,000 (down + closing). Projections, not guarantees.
Landlord ↔ Tenant lean methodology
- Overall (STATE)
- 73 Landlord-Friendly
- State Ohio
- 73 Landlord-Friendly · R+6
- County
- — inherits STATE
- City
- — inherits STATE
ZIP-level market 45504
- Active inventory
- 93
- Price-to-rent
- 9.8×
Monthly cashflow live
- Estimated rent
- $1,269 medium interval (Pro) →
- Mortgage (P&I)
- −$787
- Tax from tax record
- −$214 /mo · $2,574/yr
- Insurance
- −$62
- HOA
- −$0
- Vacancy / Maint / Mgmt
- −$267
- Net cashflow
- $-61
Break-even live
UW: 25.0% down · 7.5% · 30yr · 1.5% tax · 5.0% vac · 8.0% maint · 8.0% mgmt
Financing live
Cash to close
- Down payment
- $37,500
- Closing costs
- $4,500
- Reserves months
- —
- Total cash needed
- —
Loan-product check · same deal, 3 products live
Conventional
25% down · 7.5% · 30yr
- Down + closing
- —
- Monthly P&I
- —
- Monthly cashflow
- —
- DSCR
- —
- Eligible?
- —
Personal DTI + credit; lowest rate.
DSCR
20% down · 8.5% · 30yr
- Down + closing
- —
- Monthly P&I
- —
- Monthly cashflow
- —
- DSCR
- —
- Eligible?
- —
No personal income docs; deal must DSCR.
Hard money
10% down · 12.0% · 12mo
- Down + closing
- —
- Monthly P&I
- —
- Monthly cashflow
- —
- DSCR
- —
- Eligible?
- —
Short-term bridge; refi at stabilization.
Listing history 1 events
-
2026-05-01$150,000 Active 942-char remark
ⓘ Source: listings_history table (triggers on properties + properties_extension) + one-shot
backfill from property_details.listing_events for pre-trigger history.
Tax reassessment forecast OH · Partial reset (capped growth)
- Current annual tax
- $2,574 · $214/mo
- Projected year-2 tax
- $2,574 · $214/mo
- Expected delta
- $0/yr ($0/mo · 0.0%)
ⓘ Screening estimate from a state-policy table — verify with the county assessor before closing.
Climate risk First Street
- Flood 1/10 Low FEMA zone X (unshaded) · 0% chance over 30 yrs
- Wildfire 1/10 Low
- Heat 3/10 Moderate 7 d/yr ≥100°F today · 18 d/yr by 30 yrs out
- Wind 2/10 Low
- Air quality 3/10 Moderate 2 unhealthy d/yr today · 3 by 30 yrs out
Nearby sold comps map
Loading sold comps map…
Walkable amenities ~0.75 mi
Loading nearby amenities…
Taxation est. · year 1
- Rental income
- $15,229
- − Mortgage interest
- −$8,402
- − Property taxes
- −$2,574
- − Insurance
- −$750
- − Repairs & maintenance
- −$1,218
- − Management
- −$1,218
- − Depreciation
- −$4,364
- Taxable loss
- −$3,297
- Est. tax savings @ 24.0%
- +$791
- After-tax cash flow
- $59/yr
For passive investors: Depreciation is non-cash, so a rental often shows a tax loss while cash-flowing — sheltering income. Rental losses are passive: they offset passive income freely, and up to $25,000/yr can offset ordinary (W-2) income if you actively participate and your MAGI is under $100k (phasing out to $0 by $150k); unused losses carry forward. On sale, claimed depreciation is recaptured at up to 25%, and gains may owe capital-gains tax (a 1031 exchange can defer both). Figures are a year-1 estimate at your 24.0% rate — not tax advice; consult a CPA.
Schools (NCES district)
- District
- Springfield City School District
- NCES district ID
- 3904481
- Math proficiency
- 20% ▼ -16.00%
- Reading proficiency
- 27% ▼ -12.00%
- Median HH income
- $32,541
- Composite
- 19.12/100
- National rank
- #8834
- State rank
- #616 of 656 in OH
Livability — Springfield
- Score
- 56/100
- State rank
- #1108
- US rank
- #22551
Category grades
Schools grade is shown separately in the Schools card above.
Census & demographics
- Census place
- Springfield, OH
- County
- Clark · 134,280 people
- City population
- 33,261
- Metro
- Springfield, OH
- Population (ZIP)
- 16,654
- Household income
- $67,334
- Rent vs Own
- Severe rent burden
- 6.4
Population outlook (Clark County) Hauer SSP2
- Today (2025)
- 130,703 people
- By 2030
- 126,952 · -2.9%
- By 2040
- 118,344 · -9.5%
- By 2050
- 109,590 · -16.2%
- By 2075
- 89,464 · -31.6%
- By 2100
- 68,810 · -47.4%
Race, ethnicity, and origin ACS 2023
- Neighborhood character
- Predominantly White (85%)
- Race & ethnicity
- White 85% Two or more races 7% Black 5% Hispanic / Latino 3%
- Common ancestry
- Lithuanian 2% Slovak 2% Italian 1%
- Foreign-born
- 2% · Canada, China
- Languages at home
- 97% English-only · Spanish 2%
Political lean MEDSL · Clark
- 2024 margin
- Strong R (+29.5) · D 34.8% · R 64.3%
- 2008→2024 swing
- -27.0pp toward R · 2008: -2.5pp · 2024: -29.5pp
- All cycles
- 2024: R+29.5 2020: R+23.3 2016: R+19.5 2012: R+1.8 2008: R+2.5
Not yet ingested
- Civics
- —
Market trends
- HPI YoY
- ▼ -138.72%
- Current HPI
- 240.7049
- Rent YoY
- —
- Metro
- —
- State GDP YoY
- ▲ 1.98%
- F500 in state
- 48
Industry mix (Fortune 500 HQ in OH)
| Industry | F500 HQs | Revenue |
|---|---|---|
| Insurance | 3 | $145B |
|
||
| Industrial Machinery | 3 | $49B |
|
||
| Financial Services | 3 | $24B |
|
||
| Consumer Goods | 2 | $93B |
|
||
| Aerospace / Defense | 2 | $47B |
|
||
| Utilities | 2 | $33B |
|
||
Price history
2 events — show timeline
- 2026-05-28 Pending — WRIST
- 2026-05-01 Listed $150,000 WRIST
Property tax history
+2.4%/yrLatest (2025): $2,574 · +25.7% YoY. Source: county tax records.
Cash-flow waterfall
monthlySold comps — $/sqft
last 12 mo · ≤1 miLoading sold comps…