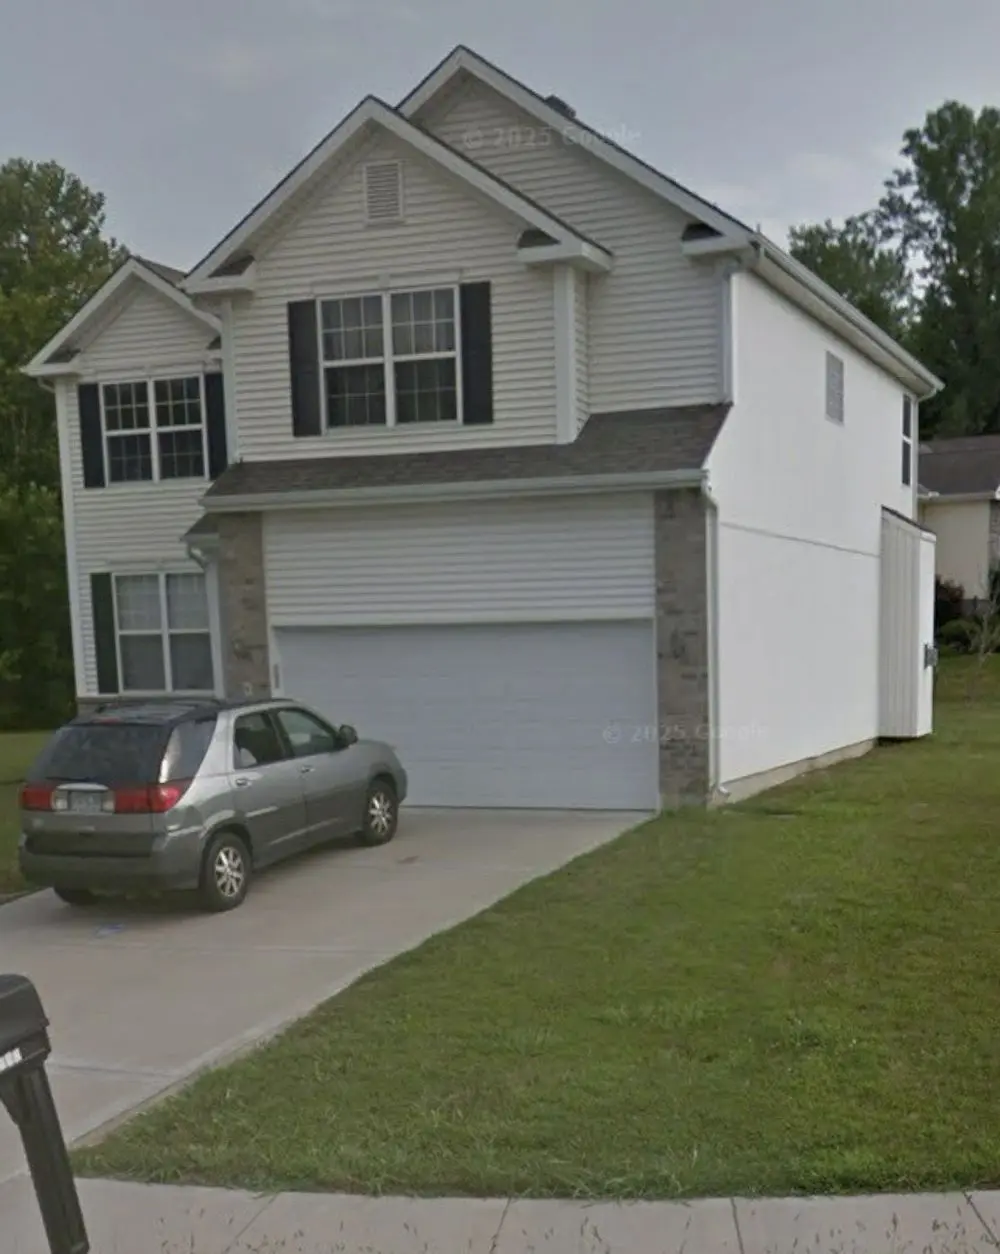
5062 NW Woodside Ct · Riverside, MO
Flood risk 1/10 · Minimal
- FEMA flood zone
- X (unshaded)
- Chance of flooding over 30 yrs
- 0.0%
- Est. flood insurance / yr
- $473 – $860
Fire risk 1/10 · Minimal
- Est. fire insurance / yr
- $1,054 – $1,958
Heat risk 4/10 · Minor
- Hot days now (above 108°F)
- 7 days/yr
- Hot days in 30 yrs
- 17 days/yr
Wind risk 2/10 · Minimal
- Chance of severe wind over 30 yrs
- —
Air-quality risk 3/10 · Minor
- Unhealthy air days now
- 2 days/yr
- Unhealthy air days in 30 yrs
- 3 days/yr
Risk factors via First Street. Map © Google.
Why this score? — see what drove the C grade
The composite is a weighted blend of 9 inputs, each scored 0–100. Each bar is that input's sub-score; the figure is the points it added to the 100-point composite (weight × sub-score).
- Cash flow +18.6/30.0
- ARV discount +15.0/15.0
- DSCR +5.9/10.0
- 1% rule +5.3/10.0
- Schools +4.5/10.0
- Livability +2.8/5.0
- Rent growth +2.5/5.0
- Condition / age +2.5/5.0
- Appreciation +0.0/10.0
$200,000
🖨 Deal sheet 📄 Offer letter ✓ Due diligence
Listing remarks
4 BR 2 1/2 BA 2 Story Home Serious buyers only! Great deal for experienced cash investors. The home is In need of a complete rehab. It is being sold as is with no warranties/repairs. It is a large home on a large lot in a desirable neighborhood and area. Minutes from several major highways Park Hill Schools Our loss is your gain - Make the repairs and get the equity! Property is priced to sell and being sold as is! Repairs needed include but not limited to: - Carpet removed/replaced throughout - Sheet rock repaired/replaced - Walls cleaned and painted throughout - Plumbing repairs - Damage from burst pipe in master bathroom - HVAC system needs to be serviced - has not being used in s
Key facts
- 0.25 acre lot
- Built 2006
- Listed 14 days
Property features AI
Exterior
- Home design: House
- Exterior features: Lot of approximately 10,890 sq ft
Neighborhood map
What this means for you Summary
Snapshot
- This is a 3-bed/2.0-bath single-family listed at $200k.
Deal economics
- At list price, monthly cash flow is $195 ($2k/yr) — positive.
- The deal already cash-flows at list — no discount required.
- Meets the 1% rule at list price ($2k rent vs $200k).
- Cap rate 7.5% vs local median 0.3% in Riverside — top-decile yield for the area; either an underpriced asset or a hidden risk that comps aren't pricing in. Stress-test before assuming the spread holds.
Location & tenants
- Location reads 55/100 on livability (#723 in MO) — a working-class tenant base; expect higher turnover. Strengths: cost of living A+, schools B; Watch: housing C-, crime F, amenities F.
- Park Hill (urban): math 47% / reading 54% proficiency, ranked #26 of 324 in MO (top 8%) — acceptable for families but not a draw, mixed tenant base, ~2y average lease.
- Market conditions: 63 active listings in the ZIP; 3 comparable units currently listed for rent nearby; rentals at typical pace (median 20d on market — plan ~3-4 weeks tenant-placement turnaround); 234 units permitted in Platte County in 2024 (0 in 5+ unit buildings).
- This rent runs 42% of the median local income ($59k/yr) — at the standard rent-burdened threshold; future hikes will face affordability resistance.
Forward outlook
- Local home prices are declining (-3.0%/yr); year-one equity from $1k of loan paydown is wiped out by about $6k of value loss. Plan a longer hold.
- Platte County population projected at +31% by 2050 — long-run rental-demand tailwind backs the buy-and-hold thesis.
Negotiation context
- Only 14 days on market — expect competitive offers; lowballing is unlikely to land.
Questions for the listing agent
- Is there a deadline driving the sale (1031 exchange, divorce, estate, relocation)? That informs how much negotiation room exists.
- Schools are B-rated — typically a magnet for longer-tenancy family renters. What's the average tenant stay here, and is there a school-zone premium baked into asking?
- Crime grade is F in this area — have there been break-ins, vandalism, or insurance claims at this property in the last 3 years? What carrier currently insures it and at what premium?
- What's the average days-on-market for RENTAL listings here right now (not sales)? A rising rental-DOM trend means longer vacancies and softer asking-rent achievability than the comps imply.
- What's the recent tenant-quality profile in this submarket — average credit score on applications, eviction rate, late-payment / NSF rate, and stable-employment percentage? A property-management company in the area should have these aggregated.
- How much new for-sale + rental construction is in the pipeline within 1–3 miles? Heavy new supply typically softens prices + rents 12–24 months out; constrained supply supports both.
Investment metrics
- 1% rule
- 1.03% ✓
- Cap rate
- 7.46%
- Cash-on-cash
- 4.17%
- DSCR
- 1.19
- GRM
- 8.1
CMA / ARV
- ARV (on-the-fly)
- $324,972
- Comps found
- 12
Show comp detail 12 sales within ~0.75 mi
| Address | Dist | Beds/Ba | Sqft | Sold | Price | $/sf | Match |
|---|---|---|---|---|---|---|---|
| 3412 NW 50th St | 0.25mi | 4/3.0 (+1) | 2,016 (+0%) | 7mo | $425,000 | $211 | 72 |
| 5508 NW Meadowvale Dr | 0.57mi | 3/2.0 | 2,034 (+1%) | 2mo | $265,000 | $130 | 69 |
| 5043 NW Woodside Dr | 0.03mi | 4/3.0 (+1) | 2,104 (+5%) | 22mo | $365,000 | $173 | 63 |
| 5601 NW Platte Purchase Dr | 0.69mi | 3/2.0 | 2,010 (+0%) | 10mo | $292,000 | $145 | 59 |
| 5029 NW Timberline Dr | 0.12mi | 4/3.0 (+1) | 2,115 (+5%) | 22mo | $429,000 | $203 | 58 |
| 2021 NW 50th Ter | 0.66mi | 3/2.0 | 1,908 (-5%) | 7mo | $200,000 | $105 | 55 |
| 5317 Waukomis Dr | 0.68mi | 3/2.0 | 1,828 (-9%) | 1mo | $329,900 | $180 | 53 |
| 5613 N Mayview Ave | 0.74mi | 3/2.5 | 1,906 (-5%) | 6mo | $299,999 | $157 | 50 |
| 3601 NW 56th St | 0.74mi | 3/2.5 | 1,931 (-4%) | 9mo | $312,000 | $162 | 50 |
| 4953 NW High Dr | 0.45mi | 4/2.5 (+1) | 2,220 (+11%) | 7mo | $519,950 | $234 | 49 |
| 3202 NW Cerrito Ln | 0.36mi | 3/3.0 | 2,252 (+12%) | 17mo | $300,000 | $133 | 44 |
| 5452 NW Venetian Dr | 0.51mi | 4/2.0 (+1) | 1,726 (-14%) | 19mo | $270,000 | $156 | 32 |
Match score weights: distance 35% · size 25% · config 20% · recency 20%. Top-matched comps best support the ARV.
Projected returns pro-forma
-3.0% appreciation · 3.0% rent growth · sell at horizon
- IRR
- -9.7%
- Equity multiple
- 0.64×
- Total profit
- $-19,958
- Equity at exit
- $29,821
- IRR
- -0.3%
- Equity multiple
- 0.98×
- Total profit
- $-1,188
- Equity at exit
- $17,292
Cash invested: $56,000 (down + closing). Projections, not guarantees.
Landlord ↔ Tenant lean methodology
- Overall (STATE)
- 81 Strongly Landlord-Friendly
- State Missouri
- 81 Strongly Landlord-Friendly · R+10
- County
- — inherits STATE
- City
- — inherits STATE
ZIP-level market 64150
- Home prices YoY
- -20.3%
- Active inventory
- 63
- Price-to-rent
- 8.1×
Monthly cashflow live
- Estimated rent
- $2,050 medium interval (Pro) →
- Mortgage (P&I)
- −$1,049
- Tax from tax record
- −$293 /mo · $3,513/yr
- Insurance
- −$83
- HOA
- −$0
- Vacancy / Maint / Mgmt
- −$431
- Net cashflow
- $195
Break-even live
UW: 25.0% down · 7.5% · 30yr · 1.5% tax · 5.0% vac · 8.0% maint · 8.0% mgmt
Financing live
Cash to close
- Down payment
- $50,000
- Closing costs
- $6,000
- Reserves months
- —
- Total cash needed
- —
Loan-product check · same deal, 3 products live
Conventional
25% down · 7.5% · 30yr
- Down + closing
- —
- Monthly P&I
- —
- Monthly cashflow
- —
- DSCR
- —
- Eligible?
- —
Personal DTI + credit; lowest rate.
DSCR
20% down · 8.5% · 30yr
- Down + closing
- —
- Monthly P&I
- —
- Monthly cashflow
- —
- DSCR
- —
- Eligible?
- —
No personal income docs; deal must DSCR.
Hard money
10% down · 12.0% · 12mo
- Down + closing
- —
- Monthly P&I
- —
- Monthly cashflow
- —
- DSCR
- —
- Eligible?
- —
Short-term bridge; refi at stabilization.
Rent comps 3 comps
| Address | Beds | Baths | Sqft | Rent | $/sqft | DOM | Units | Dist |
|---|---|---|---|---|---|---|---|---|
| 2200 NW 56th Ter Kansas City, MO | 3.0 | 2.0 | 1464 | $1,899 | $1.30 | 43d | 1 | 0.95mi |
| 5709 N Harden Ave Kansas City, MO | 3.0 | 2.0 | 2100 | $2,145 | $1.02 | 20d | 1 | 1.05mi |
| 5630 NW Hillside Dr Kansas City, MO | 3.0 | 1.0 | 1600 | $1,750 | $1.09 | 3d | 1 | 1.08mi |
Listing history 10 events
-
2026-06-18days on market $200,000 Active 14 DOM
-
2026-06-17days on market $200,000 Active 13 DOM
-
2026-06-16days on market $200,000 Active 12 DOM
-
2026-06-15days on market $200,000 Active 11 DOM
-
2026-06-13days on market $200,000 Active 9 DOM
-
2026-06-13days on market $200,000 Active 8 DOM
-
2026-06-09days on market $200,000 Active 5 DOM
-
2026-06-08days on market $200,000 Active 4 DOM
-
2026-06-07remarks 699-char remark
-
2026-06-07$200,000 Active 3 DOM
ⓘ Source: listings_history table (triggers on properties + properties_extension) + one-shot
backfill from property_details.listing_events for pre-trigger history.
Tax reassessment forecast MO · Resets to sale price
- Current annual tax
- $3,513 · $293/mo
- Projected year-2 tax
- $3,513 · $293/mo
- Expected delta
- $0/yr ($0/mo · 0.0%)
ⓘ Screening estimate from a state-policy table — verify with the county assessor before closing.
Climate risk First Street
- Flood 1/10 Low FEMA zone X (unshaded) · 0% chance over 30 yrs
- Wildfire 1/10 Low
- Heat 4/10 Moderate 7 d/yr ≥108°F today · 17 d/yr by 30 yrs out
- Wind 2/10 Low
- Air quality 3/10 Moderate 2 unhealthy d/yr today · 3 by 30 yrs out
Nearby sold comps map
Loading sold comps map…
Walkable amenities ~0.75 mi
Loading nearby amenities…
Taxation est. · year 1
- Rental income
- $24,600
- − Mortgage interest
- −$11,203
- − Property taxes
- −$3,513
- − Insurance
- −$1,000
- − Repairs & maintenance
- −$1,968
- − Management
- −$1,968
- − Depreciation
- −$5,818
- Taxable loss
- −$870
- Est. tax savings @ 24.0%
- +$209
- After-tax cash flow
- $2,544/yr
For passive investors: Depreciation is non-cash, so a rental often shows a tax loss while cash-flowing — sheltering income. Rental losses are passive: they offset passive income freely, and up to $25,000/yr can offset ordinary (W-2) income if you actively participate and your MAGI is under $100k (phasing out to $0 by $150k); unused losses carry forward. On sale, claimed depreciation is recaptured at up to 25%, and gains may owe capital-gains tax (a 1031 exchange can defer both). Figures are a year-1 estimate at your 24.0% rate — not tax advice; consult a CPA.
Schools (NCES district)
- District
- Park Hill
- NCES district ID
- 2923550
- Math proficiency
- 47% ▼ -3.00%
- Reading proficiency
- 54% ▼ -3.00%
- Median HH income
- $67,616
- Composite
- 44.86/100
- National rank
- #2723
- State rank
- #26 of 324 in MO
Livability — Riverside
- Score
- 55/100
- State rank
- #723
- US rank
- #23098
Category grades
Schools grade is shown separately in the Schools card above.
Census & demographics
- Census place
- Riverside, MO
- County
- Platte County · 100,198 people
- City population
- 4,463
- Metro
- Kansas City, MO-KS
- Population (ZIP)
- 4,463
- Household income
- $58,846
- Rent vs Own
- Severe rent burden
- 122.0
Population outlook (Platte County) Hauer SSP2
- Today (2025)
- 111,772 people
- By 2030
- 119,173 · +6.6%
- By 2040
- 133,326 · +19.3%
- By 2050
- 146,617 · +31.2%
- By 2075
- 178,626 · +59.8%
- By 2100
- 195,638 · +75.0%
Race, ethnicity, and origin ACS 2023
- Neighborhood character
- Predominantly White (71%)
- Race & ethnicity
- White 71% Black 16% Hispanic / Latino 9% Two or more races 4% Asian 2%
- Hispanic origin (detail)
- Mexican 7%
- Common ancestry
- English 4% Romanian 2% Italian 1%
- Foreign-born
- 13% · Canada, South Korea
- Languages at home
- 85% English-only · Spanish 4% Other Indo-European 1% Korean 1%
Political lean MEDSL · Platte
- 2024 margin
- Toss-up / Even · D 47.7% · R 50.8% · Other 1.4%
- 2008→2024 swing
- +3.2pp toward D · 2008: -6.4pp · 2024: -3.1pp
- All cycles
- 2024: R+3.1 2020: R+3.0 2016: R+13.0 2012: R+14.2 2008: R+6.4
Not yet ingested
- Civics
- —
Market trends
- HPI YoY
- ▼ -61.70%
- Current HPI
- 241.9356
- Rent YoY
- —
- Metro
- Kansas City, MO-KS
- State GDP YoY
- ▲ 1.84%
- F500 in state
- 20
Industry mix (Fortune 500 HQ in MO)
| Industry | F500 HQs | Revenue |
|---|---|---|
| Healthcare | 1 | $163B |
|
||
| Insurance | 1 | $21B |
|
||
| Industrial Technology | 1 | $17B |
|
||
| Retail | 1 | $16B |
|
||
| Industrial Distribution | 1 | $10B |
|
||
| Utilities | 1 | $9B |
|
||
Price history
1 event — show timeline
- 2026-06-04 Listed $200,000 ForSaleByOwner.com
Property tax history
+2.5%/yrLatest (2025): $3,513 · +13.1% YoY. Source: county tax records.
Cash-flow waterfall
monthlySold comps — $/sqft
last 12 mo · ≤1 miLoading sold comps…