10736 Oak Bend Dr · Ruskin, FL
Flood risk No data
- FEMA flood zone
- —
- Chance of flooding over 30 yrs
- —
- Est. flood insurance / yr
- —
Fire risk No data
- Est. fire insurance / yr
- —
Heat risk No data
- Hot days now (above threshold)
- —
- Hot days in 30 yrs
- —
Wind risk No data
- Chance of severe wind over 30 yrs
- —
Air-quality risk No data
- Unhealthy air days now
- —
- Unhealthy air days in 30 yrs
- —
Risk factors via First Street. Map © Google.
Why this score? — see what drove the D- grade
The composite is a weighted blend of 9 inputs, each scored 0–100. Each bar is that input's sub-score; the figure is the points it added to the 100-point composite (weight × sub-score).
- Cash flow +11.9/30.0
- Condition / age +5.0/5.0
- Schools +4.4/10.0
- ARV discount +3.9/15.0
- Livability +3.6/5.0
- DSCR +3.5/10.0
- 1% rule +2.9/10.0
- Rent growth +2.3/5.0
- Appreciation +0.0/10.0
$374,990
🖨 Deal sheet 📄 Offer letter ✓ Due diligence
Listing remarks
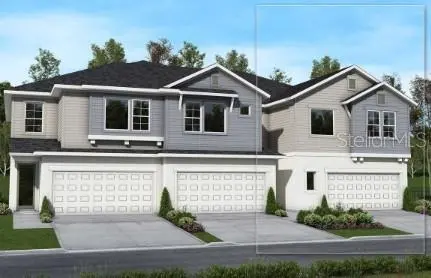
Pre-Construction. To be built. Our largest 4 bedroom 3 bathroom townhome also featuring a loft bonus space is located in the highly sought-after North River Ranch community in Parrish, Florida. This end unit townhome provides extra privacy, and oversized 2 car garage and enhanced curb appeal. The open-concept main level is flooded with natural light thanks to an abundance of oversized windows, seamlessly connecting the gourmet kitchen, dining area, and family room to create a bright, airy atmosphere ideal for entertaining and everyday living. Upstairs, the luxurious owner’s suite offers a serene retreat with an en-suite bath and walk-in closet, while two additiona
Key facts
- End unit townhome
- Swimming pools
- Gourmet kitchen
Tags
Property features AI
Finance
- Other: CDD (Community Development District) applies; Lease restrictions apply
- HOA & community: HOA managed by Access Management; Monthly HOA dues approximately $152.67 (total annual fees $1,832); Quarterly association fee of $458 (includes pool); Association approval required; Community amenities: fitness center, pool, playground, pickleball court(s), trails, park, sidewalks; Deed-restricted community; Pets allowed
Exterior
- Parking: Attached 2-car garage (22x20) with garage door opener; Driveway
- Utilities: Public water; Public sewer / sewer connected; Cable available; Fiber optics available; High-speed internet / broadband available; Phone available; Underground utilities; Fire hydrant access; Water connected; Sprinkler recycled
- Home design: Residential townhouse; Two levels; Pre-construction (projected completion: January 31, 2027); Faces west
- Construction: Block and stucco construction; Shingle roof; Slab foundation; New construction by David Weekley Homes (Builder model: The Bingley II)
- Exterior features: Sidewalk; Irrigation equipment; Drip irrigation / microhead system
Interior
- Kitchen: Built-in oven; Cooktop; Dishwasher; Disposal; Microwave; Range hood
- Bedrooms: 4 bedrooms
- Flooring: Carpet; Ceramic tile; Laminate
- Bathrooms: 3 full bathrooms
- Heating & cooling: Central heating; Central air conditioning
- Interior features: Built-in features; Kitchen and family room combo; Walk-in closets
- Laundry & utility: Laundry room with washer and electric dryer hookups; Upper-level laundry
Neighborhood map
What this means for you Summary
Snapshot
- This is a 4-bed/3.0-bath townhouse listed at $375k. Condition is rated excellent.
Deal economics
- At list price, monthly cash flow is $-97 ($-1k/yr) — negative.
- To cash-flow at today's rent, offer at most $358k (4.6% below list).
- To meet the 1% rule (rent ≥ 1% of price), the offer needs to be $295k (21.4% below list).
- Recommended offer: $295k (21.4% below list) — sets the bar for 1% rule.
- Cap rate 6.0% vs local median 4.7% in Ruskin — meaningfully above typical; check what's discounted (condition, days-on-market, listing class) to confirm the premium yield is real.
Location & tenants
- Location reads 71/100 on livability (#392 in FL) — a middle-class / working-renter tenant base. Strengths: cost of living A+, housing A+, commute B+; Watch: amenities F, health & safety F.
- Manatee (suburban): math 54% / reading 50% proficiency, ranked #26 of 73 in FL (top 36%) — acceptable for families but not a draw, mixed tenant base, ~2y average lease.
- Zoned schools: Barbara A Harvey Elementary School (math 74% / reading 59%, grade B+, #473 of 2,144 statewide, top 23%, 1,069 students, 33% FRL); Parrish Community High School (math 47% / reading 57%, grade D+, #160 of 667 statewide, top 25%, 2,017 students, 32% FRL) — zoned schools average 33% FRL vs 51% district-wide (18 pts lower); this property's tenant base skews higher-income than the district average.
- Market conditions: Rents soft (-0.9%/yr); 2170 active listings in the ZIP; 23 comparable units currently listed for rent nearby; rentals at typical pace (median 16d on market — plan ~3-4 weeks tenant-placement turnaround); high-income renter base; 7,472 units permitted in Manatee County in 2024 (1,782 in 5+ unit buildings).
- This rent runs 31% of the median local income ($114k/yr) — at the standard rent-burdened threshold; future hikes will face affordability resistance.
Forward outlook
- Local home prices are declining (-3.0%/yr); year-one equity from $3k of loan paydown is wiped out by about $11k of value loss. Plan a longer hold.
- Manatee County population projected at +43% by 2050 — long-run rental-demand tailwind backs the buy-and-hold thesis.
Negotiation context
- It's been on market 28 days — a 2% lower offer ($369k) is reasonable based on typical stale-listing flexibility.
Questions for the listing agent
- What do current leases actually rent for vs. the listed asking? Can we see a recent rent roll and the last 12 months of T-12 income?
- What does the HOA fee cover, when was the last increase, and are there any pending special assessments or reserve-fund shortfalls?
- Is there a deadline driving the sale (1031 exchange, divorce, estate, relocation)? That informs how much negotiation room exists.
- Schools are F-rated, which usually means shorter tenancies and higher turnover. Who's the typical renter profile here, and what's been the actual vacancy rate?
- The area grade is low — what's the realistic commute time and amenity access for the typical tenant pool here? Any planned neighborhood developments (good or bad) we should know about?
- What's the average days-on-market for RENTAL listings here right now (not sales)? A rising rental-DOM trend means longer vacancies and softer asking-rent achievability than the comps imply.
- What's the recent tenant-quality profile in this submarket — average credit score on applications, eviction rate, late-payment / NSF rate, and stable-employment percentage? A property-management company in the area should have these aggregated.
- How much new for-sale + rental construction is in the pipeline within 1–3 miles? Heavy new supply typically softens prices + rents 12–24 months out; constrained supply supports both.
Investment metrics
- 1% rule
- 0.79% ✗
- Cap rate
- 5.98%
- Cash-on-cash
- -1.11%
- DSCR
- 0.95
- GRM
- 10.6
CMA / ARV
- ARV (on-the-fly)
- $347,490
- Comps found
- 9
Show comp detail 9 sales within ~0.75 mi
| Address | Dist | Beds/Ba | Sqft | Sold | Price | $/sf | Match |
|---|---|---|---|---|---|---|---|
| 11722 Full Moon Loop | 0.02mi | 4/3.0 | 2,145 (0%) | 2mo | $338,000 | $158 | 97 |
| 11734 Full Moon Loop | 0.02mi | 3/2.5 (-1) | 2,145 (0%) | 1mo | $359,000 | $167 | 92 |
| 10716 Oak Bend Dr | 0.03mi | 3/2.5 (-1) | 2,145 (0%) | 1mo | $349,990 | $163 | 91 |
| 10720 Oak Bend Dr | 0.02mi | 3/2.5 (-1) | 1,980 (-8%) | 0mo | $329,990 | $167 | 79 |
| 11730 Full Moon Loop | 0.02mi | 3/2.5 (-1) | 1,980 (-8%) | 2mo | $319,990 | $162 | 78 |
| 11746 Full Moon Loop | 0.03mi | 3/2.5 (-1) | 1,980 (-8%) | 2mo | $319,990 | $162 | 78 |
| 11742 Full Moon Loop | 0.02mi | 3/2.5 (-1) | 1,980 (-8%) | 4mo | $295,000 | $149 | 76 |
| 10708 Oak Bend Dr | 0.04mi | 3/2.5 (-1) | 1,980 (-8%) | 10mo | $349,990 | $177 | 70 |
| 11726 Full Moon Loop | 0.02mi | 3/2.5 (-1) | 1,864 (-13%) | 3mo | $292,000 | $157 | 68 |
Match score weights: distance 35% · size 25% · config 20% · recency 20%. Top-matched comps best support the ARV.
Projected returns pro-forma
-3.0% appreciation · 0.0% rent growth · sell at horizon
- IRR
- -21.3%
- Equity multiple
- 0.28×
- Total profit
- $-75,638
- Equity at exit
- $55,912
- IRR
- -23.4%
- Equity multiple
- -0.02×
- Total profit
- $-107,433
- Equity at exit
- $32,422
Cash invested: $104,997 (down + closing). Projections, not guarantees.
Landlord ↔ Tenant lean methodology
- Overall (STATE)
- 87 Strongly Landlord-Friendly
- State Florida
- 87 Strongly Landlord-Friendly · R+3
- County
- — inherits STATE
- City
- — inherits STATE
ZIP-level market 34219
- Home prices YoY
- -23.7%
- Rents YoY
- -0.9%
- Active inventory
- 2170
- Price-to-rent
- 10.6×
Monthly cashflow live
- Estimated rent
- $2,947 high interval (Pro) →
- Mortgage (P&I)
- −$1,966
- Tax from tax record
- −$151 /mo · $1,807/yr
- Insurance
- −$156
- HOA
- −$152
- Vacancy / Maint / Mgmt
- −$619
- Net cashflow
- $-97
Break-even live
UW: 25.0% down · 7.5% · 30yr · 1.5% tax · 5.0% vac · 8.0% maint · 8.0% mgmt
Financing live
Cash to close
- Down payment
- $93,748
- Closing costs
- $11,250
- Reserves months
- —
- Total cash needed
- —
Loan-product check · same deal, 3 products live
Conventional
25% down · 7.5% · 30yr
- Down + closing
- —
- Monthly P&I
- —
- Monthly cashflow
- —
- DSCR
- —
- Eligible?
- —
Personal DTI + credit; lowest rate.
DSCR
20% down · 8.5% · 30yr
- Down + closing
- —
- Monthly P&I
- —
- Monthly cashflow
- —
- DSCR
- —
- Eligible?
- —
No personal income docs; deal must DSCR.
Hard money
10% down · 12.0% · 12mo
- Down + closing
- —
- Monthly P&I
- —
- Monthly cashflow
- —
- DSCR
- —
- Eligible?
- —
Short-term bridge; refi at stabilization.
Rent comps 23 comps
| Address | Beds | Baths | Sqft | Rent | $/sqft | DOM | Units | Dist |
|---|---|---|---|---|---|---|---|---|
| 9928 Wimico Ter Parrish, FL | 3.0 | 2.0 | 1504 | $2,450 | $1.63 | 16d | 1 | 0.58mi |
| 10225 Kalamazoo Pl Parrish, FL | 4.0 | 2.5 | 2260 | $2,789 | $1.23 | 3d | 1 | 0.61mi |
| 10225 Kalamazoo Pl Unit NA Parrish, FL | 4.0 | 2.5 | 2260 | $2,689 | $1.19 | 10d | 1 | 0.61mi |
| 12067 Kingsley Trl Parrish, FL | 4.0 | 2.5 | 2045 | $2,495 | $1.22 | 3d | 1 | 0.62mi |
| 11512 Gallatin Trl Parrish, FL | 4.0 | 2.5 | 1929 | $3,300 | $1.71 | 24d | 1 | 0.73mi |
| 11454 Gallatin Trl Parrish, FL | 4.0 | 2.0 | 1635 | $2,575 | $1.57 | 16d | 1 | 0.74mi |
| 11884 Little River Way Parrish, FL | 3.0 | 2.5 | 2142 | $3,250 | $1.52 | 16d | 1 | 0.82mi |
| 11880 Little River Way Parrish, FL | 4.0 | 2.0 | 1635 | $2,650 | $1.62 | 24d | 1 | 0.82mi |
| 10048 Big Marsh Ter Parrish, FL | 3.0 | 2.0 | 2034 | $2,825 | $1.39 | 24d | 1 | 0.83mi |
| 11007 Tamarack Pl Unit NA Duette, FL | 4.0 | 3.0 | 2537 | $3,000 | $1.18 | 12d | 1 | 0.89mi |
| 10832 Charlotte Dr Parrish, FL | 5.0 | 3.0 | 2964 | $2,899 | $0.98 | 12d | 1 | 1.24mi |
| 10935 Gentle Current Way Parrish, FL | 5.0 | 3.0 | 2605 | $3,900 | $1.50 | 24d | 1 | 1.32mi |
| 10646 Hidden Banks Gln Parrish, FL | 3.0 | 2.0 | 1504 | $2,350 | $1.56 | 16d | 1 | 1.38mi |
| 11567 84th Street Cir E #105 Parrish, FL | 3.0 | 2.5 | 1420 | $1,999 | $1.41 | 3d | 1 | 1.38mi |
| 10455 Wet Marsh Cv Parrish, FL | 3.0 | 2.0 | 1635 | $2,650 | $1.62 | 10d | 1 | 1.41mi |
| 8522 Canyon Creek Trl Parrish, FL | 3.0 | 2.5 | 1822 | $2,000 | $1.10 | 24d | 1 | 1.43mi |
| 9544 Sandy Bluffs Cir Parrish, FL | 5.0 | 3.0 | 2557 | $2,950 | $1.15 | 3d | 1 | 1.43mi |
| 8544 Canyon Creek Trl Parrish, FL | 3.0 | 2.5 | 1822 | $2,300 | $1.26 | 12d | 1 | 1.43mi |
| 10749 Hidden Banks Gln Parrish, FL | 5.0 | 3.0 | 2447 | $2,549 | $1.04 | 24d | 1 | 1.44mi |
| 8443 Canyon Creek Trl Parrish, FL | 3.0 | 2.5 | 2178 | $2,000 | $0.92 | 24d | 1 | 1.46mi |
| 8423 Canyon Creek Trl Parrish, FL | 3.0 | 2.5 | 1823 | $2,400 | $1.32 | 24d | 1 | 1.46mi |
| 11522 84th Street Cir E #105 Parrish, FL | 3.0 | 2.5 | 1588 | $2,300 | $1.45 | 24d | 1 | 1.47mi |
| 11523 84th Street Cir E #105 Parrish, FL | 3.0 | 2.5 | 1588 | $1,950 | $1.23 | 3d | 1 | 1.50mi |
HOA detail
- Monthly dues
- $152 · $1,824/yr
Listing history 16 events
-
2026-06-18days on market $374,990 Active 28 DOM
-
2026-06-17days on market $374,990 Active 27 DOM
-
2026-06-16days on market $374,990 Active 26 DOM
-
2026-06-15days on market $374,990 Active 25 DOM
-
2026-06-13days on market $374,990 Active 23 DOM
-
2026-06-13days on market $374,990 Active 22 DOM
-
2026-06-10days on market $374,990 Active 20 DOM
-
2026-06-09days on market $374,990 Active 19 DOM
-
2026-06-08days on market $374,990 Active 18 DOM
-
2026-06-08days on market $374,990 Active 17 DOM
-
2026-06-03days on market $374,990 Active 13 DOM
-
2026-06-02days on market $374,990 Active 12 DOM
-
2026-06-01days on market $374,990 Active 11 DOM
-
2026-05-31days on market $374,990 Active 10 DOM
-
2026-05-21$374,990 Active
-
2026-04-14soldstatus $518,800
ⓘ Source: listings_history table (triggers on properties + properties_extension) + one-shot
backfill from property_details.listing_events for pre-trigger history.
Tax reassessment forecast FL · Resets to sale price
- Current annual tax
- $1,807 · $151/mo
- Projected year-2 tax
- $3,112 · $259/mo
- Expected delta
- +$1,305/yr (+$109/mo · 72.2%)
ⓘ Screening estimate from a state-policy table — verify with the county assessor before closing.
Nearby sold comps map
Loading sold comps map…
Walkable amenities ~0.75 mi
Loading nearby amenities…
Taxation est. · year 1
- Rental income
- $35,367
- − Mortgage interest
- −$21,005
- − Property taxes
- −$1,807
- − Insurance
- −$1,875
- − Repairs & maintenance
- −$2,829
- − Management
- −$2,829
- − HOA
- −$1,824
- − Depreciation
- −$10,909
- Taxable loss
- −$7,712
- Est. tax savings @ 24.0%
- +$1,851
- After-tax cash flow
- $687/yr
For passive investors: Depreciation is non-cash, so a rental often shows a tax loss while cash-flowing — sheltering income. Rental losses are passive: they offset passive income freely, and up to $25,000/yr can offset ordinary (W-2) income if you actively participate and your MAGI is under $100k (phasing out to $0 by $150k); unused losses carry forward. On sale, claimed depreciation is recaptured at up to 25%, and gains may owe capital-gains tax (a 1031 exchange can defer both). Figures are a year-1 estimate at your 24.0% rate — not tax advice; consult a CPA.
Condition & rehab AI · 10 photos
This pre-construction townhome in North River Ranch, Ruskin, Florida, is move-in ready with no visible signs of wear and a pristine condition.
Schools (NCES district)
- District
- Manatee
- NCES district ID
- 1201230
- Math proficiency
- 54% ▼ -6.00%
- Reading proficiency
- 50% ▼ -2.00%
- Median HH income
- $49,607
- Composite
- 44.43/100
- National rank
- #2806
- State rank
- #26 of 73 in FL
Livability — Ruskin
- Score
- 71/100
- State rank
- #392
- US rank
- #6879
Category grades
Schools grade is shown separately in the Schools card above.
Census & demographics
- County
- Manatee County · 416,364 people
- City population
- 52,177
- Metro
- North Port-Sarasota-Bradenton, FL
- Population (ZIP)
- 33,296
- Household income
- $113,773
- Rent vs Own
- Severe rent burden
- 219.0
Population outlook (Manatee County) Hauer SSP2
- Today (2025)
- 447,342 people
- By 2030
- 488,911 · +9.3%
- By 2040
- 567,934 · +27.0%
- By 2050
- 637,995 · +42.6%
- By 2075
- 781,970 · +74.8%
- By 2100
- 848,272 · +89.6%
Race, ethnicity, and origin ACS 2023
- Neighborhood character
- Predominantly White (75%)
- Race & ethnicity
- White 75% Hispanic / Latino 11% Two or more races 8% Black 8% Asian 2%
- Hispanic origin (detail)
- Mexican 2% Puerto Rican 3%
- Common ancestry
- Romanian 4% Hispanic 2% Russian 2%
- Foreign-born
- 10% · Canada, Dominican Republic, Jamaica
- Languages at home
- 88% English-only · Spanish 7% French/Haitian/Cajun 2% Other Asian/Pacific 1%
Political lean MEDSL · Manatee
- 2024 margin
- Strong R (+23.5) · D 37.9% · R 61.4%
- 2008→2024 swing
- -16.5pp toward R · 2008: -7.0pp · 2024: -23.5pp
- All cycles
- 2024: R+23.5 2020: R+16.1 2016: R+17.1 2012: R+12.5 2008: R+7.0
Not yet ingested
- Civics
- —
Market trends
- HPI YoY
- ▼ -84.45%
- Current HPI
- 271.7131
- Rent YoY
- ▼ -0.95%
- Metro
- North Port-Sarasota-Bradenton, FL
- State GDP YoY
- ▲ 3.28%
- F500 in state
- 36
Industry mix (Fortune 500 HQ in FL)
| Industry | F500 HQs | Revenue |
|---|---|---|
| Industrial Technology | 2 | $29B |
|
||
| Insurance | 2 | $17B |
|
||
| Retail | 1 | $60B |
|
||
| Technology Distribution | 1 | $58B |
|
||
| Homebuilding | 1 | $35B |
|
||
| Technology Manufacturing | 1 | $35B |
|
||
Price history
-27.7% since first listed2 events — show timeline
- 2026-05-21 Listed $374,990 Stellar MLS as Distributed by MLS Grid
- 2026-04-14 Sold (Public Records) $518,800 Public Records
Cash-flow waterfall
monthlySold comps — $/sqft
last 12 mo · ≤1 miLoading sold comps…