 🏗️ New Construction
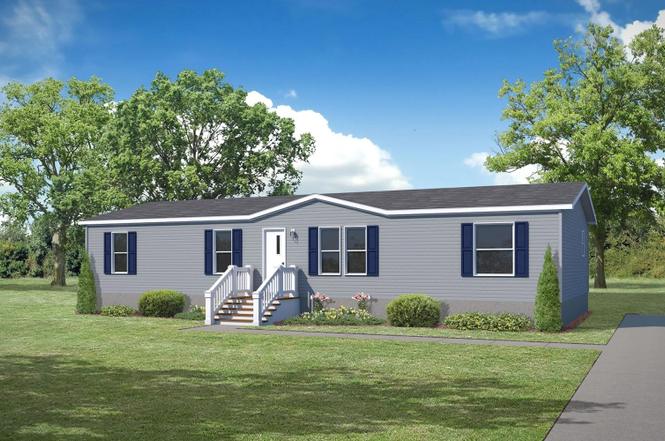
Crown (White Pine) Plan · Florence, KY
Flood risk No data
- FEMA flood zone
- —
- Chance of flooding over 30 yrs
- —
- Est. flood insurance / yr
- —
Fire risk No data
- Est. fire insurance / yr
- —
Heat risk No data
- Hot days now (above threshold)
- —
- Hot days in 30 yrs
- —
Wind risk No data
- Chance of severe wind over 30 yrs
- —
Air-quality risk No data
- Unhealthy air days now
- —
- Unhealthy air days in 30 yrs
- —
Risk factors via First Street. Map © Google.
Why this score? — see what drove the B grade
The composite is a weighted blend of 9 inputs, each scored 0–100. Each bar is that input's sub-score; the figure is the points it added to the 100-point composite (weight × sub-score).
- Cash flow +30.0/30.0
- 1% rule +10.0/10.0
- DSCR +10.0/10.0
- ARV discount +7.5/15.0
- Schools +4.1/10.0
- Livability +3.9/5.0
- Rent growth +3.4/5.0
- Condition / age +2.5/5.0
- Appreciation +0.0/10.0
$92,995
🖨 Deal sheet 📄 Offer letter ✓ Due diligence
Listing remarks
White Pine Pointe is a family-friendly community with many exciting new amenities and upgrades being planned. New homes will be rolling in soon as well as a playground, new basketball courts, and a new office and clubhouse. Located in a premium spot just minutes from Florence Kentucky, shopping, restaurants and a Kroger store is within walking distance. Florence Kentucky offers world-class services to premium recreational opportunities for residents of all ages. Plans for new homes, a playground, new basketball courts, and a new office and clubhouse. Community Amenities Basketball Court, Clubhouse, Pickleball, and Playground
Key facts
- New amenities
- Office and clubhouse
- Walking distance
Tags
Property features AI
Finance
- Other: Address marketed as Crown (White Pine) Plan, Florence, KY 41042; Inventory type: Plan (new construction)
- Financial info: List price $92,995
- HOA & community: Association fee of $615
Exterior
- Home design: Single-family plan home; Model/plan name: Crown (White Pine)
- Exterior features: Living area approximately 1,493
Interior
- Bedrooms: 4 bedrooms
- Bathrooms: 2 bathrooms (both full)
- Interior features: Plan home — Crown (White Pine)
Neighborhood map
What this means for you Summary
Snapshot
- This is a 4-bed/2.0-bath manufactured listed at $93k.
Deal economics
- At list price, monthly cash flow is $434 ($5k/yr) — positive.
- The deal already cash-flows at list — no discount required.
- Meets the 1% rule at list price ($2k rent vs $93k).
- Recommended offer: $82k (12.0% below list) — sets the bar for market timing.
- Cap rate 11.9% vs local median 3.4% in Florence — top-decile yield for the area; either an underpriced asset or a hidden risk that comps aren't pricing in. Stress-test before assuming the spread holds.
Location & tenants
- Location reads 78/100 on livability (#82 in KY, #2,763 nationally) — a middle-class / working-renter tenant base. Strengths: commute A+, cost of living A+, housing A+; Watch: crime C-, schools D+.
- Boone County (suburban): math 43% / reading 49% proficiency, ranked #12 of 165 in KY (top 7%) — families likely to look elsewhere, expect single-tenant / working-renter base with shorter leases.
- Market conditions: Rents rising (+3.4%/yr); 265 active listings in the ZIP; 7 comparable units currently listed for rent nearby; rentals at typical pace (median 24d on market — plan ~3-4 weeks tenant-placement turnaround); solid renter incomes; 1,430 units permitted in Boone County in 2024 (928 in 5+ unit buildings).
- This rent runs 32% of the median local income ($80k/yr) — at the standard rent-burdened threshold; future hikes will face affordability resistance.
Forward outlook
- Local home prices are declining (-3.0%/yr); year-one equity from $643 of loan paydown is wiped out by about $3k of value loss. Plan a longer hold.
- Boone County population projected at +24% by 2050 — long-run rental-demand tailwind backs the buy-and-hold thesis.
- At projected returns (-3.0% appreciation + 3.4% rent growth), your $26k cash investment doubles in ~6 years — after that, you're playing with house money.
Negotiation context
- It's been on market 233 days — a 12% lower offer ($82k) is reasonable based on typical stale-listing flexibility.
Risks & watch-outs
- Watch-outs: HOA is 29% of rent.
Questions for the listing agent
- It's been on market 233 days. Have you received any prior offers? Is the seller open to a 12% concession, seller financing, or rate buy-down credit?
- What does the HOA fee cover, when was the last increase, and are there any pending special assessments or reserve-fund shortfalls?
- Why hasn't it sold? Are there any deal-killer items the seller is aware of (foundation, flood, title, zoning, code violations)?
- Is there a deadline driving the sale (1031 exchange, divorce, estate, relocation)? That informs how much negotiation room exists.
- Schools are D-rated, which usually means shorter tenancies and higher turnover. Who's the typical renter profile here, and what's been the actual vacancy rate?
- What's the average days-on-market for RENTAL listings here right now (not sales)? A rising rental-DOM trend means longer vacancies and softer asking-rent achievability than the comps imply.
- What's the recent tenant-quality profile in this submarket — average credit score on applications, eviction rate, late-payment / NSF rate, and stable-employment percentage? A property-management company in the area should have these aggregated.
- How much new for-sale + rental construction is in the pipeline within 1–3 miles? Heavy new supply typically softens prices + rents 12–24 months out; constrained supply supports both.
Investment metrics
- 1% rule
- 2.30% ✓
- Cap rate
- 11.89%
- Cash-on-cash
- 20.00%
- DSCR
- 1.89
- GRM
- 3.6
CMA / ARV
No comps found within radius.
Projected returns pro-forma
-3.0% appreciation · 3.42% rent growth · sell at horizon
- IRR
- 13.2%
- Equity multiple
- 1.53×
- Total profit
- $13,896
- Equity at exit
- $13,866
- IRR
- 22.8%
- Equity multiple
- 3.04×
- Total profit
- $53,127
- Equity at exit
- $8,041
Cash invested: $26,039 (down + closing). Projections, not guarantees.
Landlord ↔ Tenant lean methodology
- Overall (STATE)
- 83 Strongly Landlord-Friendly
- State Kentucky
- 83 Strongly Landlord-Friendly · R+16
- County
- — inherits STATE
- City
- — inherits STATE
ZIP-level market 41042
- Rents YoY
- 3.4%
- Active inventory
- 265
- Price-to-rent
- 3.6×
Monthly cashflow live
- Estimated rent
- $2,141 high interval (Pro) →
- Mortgage (P&I)
- −$488
- Tax est. 1.5%
- −$116 /mo · $1,395/yr
- Insurance
- −$39
- HOA
- −$615
- Vacancy / Maint / Mgmt
- −$450
- Net cashflow
- $434
Break-even live
UW: 25.0% down · 7.5% · 30yr · 1.5% tax · 5.0% vac · 8.0% maint · 8.0% mgmt
Financing live
Cash to close
- Down payment
- $23,249
- Closing costs
- $2,790
- Reserves months
- —
- Total cash needed
- —
Loan-product check · same deal, 3 products live
Conventional
25% down · 7.5% · 30yr
- Down + closing
- —
- Monthly P&I
- —
- Monthly cashflow
- —
- DSCR
- —
- Eligible?
- —
Personal DTI + credit; lowest rate.
DSCR
20% down · 8.5% · 30yr
- Down + closing
- —
- Monthly P&I
- —
- Monthly cashflow
- —
- DSCR
- —
- Eligible?
- —
No personal income docs; deal must DSCR.
Hard money
10% down · 12.0% · 12mo
- Down + closing
- —
- Monthly P&I
- —
- Monthly cashflow
- —
- DSCR
- —
- Eligible?
- —
Short-term bridge; refi at stabilization.
Rent comps 7 comps
| Address | Beds | Baths | Sqft | Rent | $/sqft | DOM | Units | Dist |
|---|---|---|---|---|---|---|---|---|
| 71 Deer Haven Ct Unit DH6 Florence, KY | 3.0 | 2.5 | 1500 | $1,925 | $1.28 | 24d | 1 | 0.56mi |
| 71 Deer Haven Ct Unit DH07 Florence, KY | 3.0 | 2.0 | 1400 | $1,950 | $1.39 | 7d | 1 | 0.56mi |
| 71 Deer Haven Ct Unit RL10322 Florence, KY | 3.0 | 2.5 | 1550 | $1,999 | $1.29 | 7d | 1 | 0.56mi |
| 71 Deer Haven Ct Unit DH65 Florence, KY | 3.0 | 2.0 | 1400 | $1,950 | $1.39 | 24d | 1 | 0.56mi |
| 1047 Alpine Ct Independence, KY | 3.0 | 2.0 | 1035 | $2,400 | $2.32 | 24d | 1 | 1.02mi |
| 996 Trellises Dr Florence, KY | 1.0–3.0 | 1.0–2.0 | 918 | $1,891 | $2.06 | 2d | 27 | 1.30mi |
| 3924 Trappers Ct Florence, KY | 3.0 | 1.5 | 1384 | $2,380 | $1.72 | 44d | 1 | 1.48mi |
HOA detail
- Monthly dues
- $615 · $7,380/yr
Listing history 13 events
-
2026-06-18days on market $92,995 Active 233 DOM
-
2026-06-17days on market $92,995 Active 232 DOM
-
2026-06-16days on market $92,995 Active 231 DOM
-
2026-06-15days on market $92,995 Active 230 DOM
-
2026-06-13days on market $92,995 Active 228 DOM
-
2026-06-09days on market $92,995 Active 224 DOM
-
2026-06-08days on market $92,995 Active 223 DOM
-
2026-06-07days on market $92,995 Active 222 DOM
-
2026-06-05days on market $92,995 Active 219 DOM
-
2026-06-03days on market $92,995 Active 218 DOM
-
2026-06-02days on market $92,995 Active 217 DOM
-
2026-06-01days on market $92,995 Active 216 DOM
-
2026-05-31days on market $92,995 Active 215 DOM
ⓘ Source: listings_history table (triggers on properties + properties_extension) + one-shot
backfill from property_details.listing_events for pre-trigger history.
Nearby sold comps map
Loading sold comps map…
Walkable amenities ~0.75 mi
Loading nearby amenities…
Taxation est. · year 1
- Rental income
- $25,697
- − Mortgage interest
- −$5,209
- − Property taxes
- −$1,395
- − Insurance
- −$465
- − Repairs & maintenance
- −$2,056
- − Management
- −$2,056
- − HOA
- −$7,380
- − Depreciation
- −$2,705
- Taxable income
- $4,431
- Est. tax owed @ 24.0%
- −$1,064
- After-tax cash flow
- $4,145/yr
For passive investors: Depreciation is non-cash, so a rental often shows a tax loss while cash-flowing — sheltering income. Rental losses are passive: they offset passive income freely, and up to $25,000/yr can offset ordinary (W-2) income if you actively participate and your MAGI is under $100k (phasing out to $0 by $150k); unused losses carry forward. On sale, claimed depreciation is recaptured at up to 25%, and gains may owe capital-gains tax (a 1031 exchange can defer both). Figures are a year-1 estimate at your 24.0% rate — not tax advice; consult a CPA.
Schools (NCES district)
- District
- Boone County
- NCES district ID
- 2100510
- Math proficiency
- 43% ▼ -10.00%
- Reading proficiency
- 49% ▼ -12.00%
- Median HH income
- $68,096
- Composite
- 41.18/100
- National rank
- #3550
- State rank
- #12 of 165 in KY
Livability — Florence
- Score
- 78/100
- State rank
- #82
- US rank
- #2763
Category grades
Schools grade is shown separately in the Schools card above.
Census & demographics
- County
- Boone County · 99,563 people
- City population
- 57,634
- Metro
- Cincinnati, OH-KY-IN
- Population (ZIP)
- 57,634
- Household income
- $79,712
- Rent vs Own
- Severe rent burden
- 1397.0
Population outlook (Boone County) Hauer SSP2
- Today (2025)
- 144,066 people
- By 2030
- 152,005 · +5.5%
- By 2040
- 166,776 · +15.8%
- By 2050
- 178,974 · +24.2%
- By 2075
- 204,515 · +42.0%
- By 2100
- 215,306 · +49.4%
Race, ethnicity, and origin ACS 2023
- Neighborhood character
- Predominantly White (78%)
- Race & ethnicity
- White 78% Hispanic / Latino 8% Black 7% Two or more races 7% Asian 3%
- Hispanic origin (detail)
- Mexican 5%
- Common ancestry
- Romanian 3% Slovak 2% Iranian 2%
- Foreign-born
- 9% · Canada, Vietnam
- Languages at home
- 89% English-only · Spanish 5% French/Haitian/Cajun 2% Other Indo-European 2%
Political lean MEDSL · Boone
- 2024 margin
- Solid R (+37.2) · D 30.6% · R 67.8% · Other 1.7%
- 2008→2024 swing
- -2.7pp toward R · 2008: -34.5pp · 2024: -37.2pp
- All cycles
- 2024: R+37.2 2020: R+35.7 2016: R+41.8 2012: R+38.7 2008: R+34.5
Not yet ingested
- Civics
- —
Market trends
- HPI YoY
- ▼ -195.07%
- Current HPI
- 206.3259
- Rent YoY
- ▲ 3.42%
- Metro
- Cincinnati, OH-KY-IN
- State GDP YoY
- ▲ 1.81%
- F500 in state
- 4
Industry mix (Fortune 500 HQ in KY)
| Industry | F500 HQs | Revenue |
|---|---|---|
| Healthcare | 1 | $118B |
|
||
| Food / Beverage | 1 | $7B |
|
||
Cash-flow waterfall
monthlySold comps — $/sqft
last 12 mo · ≤1 miLoading sold comps…