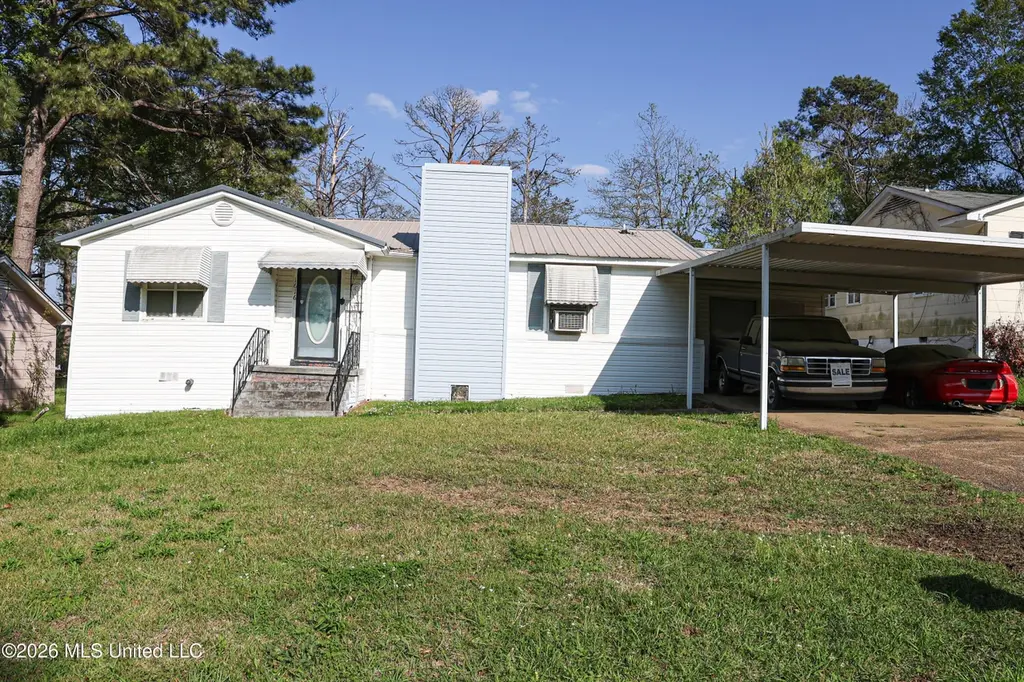
1616 Gibraltar Dr · Jackson, MS
Flood risk No data
- FEMA flood zone
- —
- Chance of flooding over 30 yrs
- —
- Est. flood insurance / yr
- —
Fire risk No data
- Est. fire insurance / yr
- —
Heat risk 7/10 · Major
- Hot days now (above threshold)
- 7 days/yr
- Hot days in 30 yrs
- 20 days/yr
Wind risk No data
- Chance of severe wind over 30 yrs
- —
Air-quality risk 1/10 · Minimal
- Unhealthy air days now
- 0 days/yr
- Unhealthy air days in 30 yrs
- 0 days/yr
Risk factors via First Street. Map © Google.
Why this score? — see what drove the B grade
The composite is a weighted blend of 9 inputs, each scored 0–100. Each bar is that input's sub-score; the figure is the points it added to the 100-point composite (weight × sub-score).
- Cash flow +30.0/30.0
- 1% rule +10.0/10.0
- DSCR +10.0/10.0
- Appreciation +10.0/10.0
- Rent growth +5.0/5.0
- Livability +3.4/5.0
- Condition / age +2.2/5.0
- Schools +1.1/10.0
- ARV discount +0.0/15.0
$55,000
🖨 Deal sheet (PDF) 📄 Offer letter ✓ Due diligence
Listing remarks MLS
Great investor opportunity in the heart of Jackson! This 4-bedroom, 3-bathroom home offers plenty of space and potential. Features include a covered carport and a large backyard. Conveniently located less than 5 minutes from Highway 80 and I-20 for easy access to the metro area. Property is being sold as-is and is perfect for investors or buyers looking to renovate and add value.
Key facts
- 0.24 acre lot
- 2 parking spots
- Built 1956
Neighborhood map
What this means for you Summary
Snapshot
- This is a 4-bed/2.5-bath single-family listed at $55k. Condition is rated fair.
Deal economics
- At list price, monthly cash flow is $672 ($8k/yr) — positive.
- The deal already cash-flows at list — no discount required.
- Meets the 1% rule at list price ($1k rent vs $55k).
- Recommended offer: $52k (6.0% below list) — sets the bar for market timing.
- Cap rate 21.0% vs local median 9.9% in Jackson — top-decile yield for the area; either an underpriced asset or a hidden risk that comps aren't pricing in. Stress-test before assuming the spread holds.
Location & tenants
- Location reads 68/100 on livability (#66 in MS) — a middle-class / working-renter tenant base. Strengths: commute A+, cost of living A+, housing A+; Watch: amenities F, employment F, health & safety F.
- Jackson Public School District (urban): math 9% / reading 18% proficiency, ranked #112 of 130 in MS (top 86%) — low school quality limits family demand, transient renter base, plan for 1-2y turnover; 88% free/reduced lunch — lower-income household profile, screen leases tightly.
- Zoned schools: Bates Elementary School (math 7% / reading 18%, grade F, #293 of 375 statewide, top 79%, 430 students, 100% FRL); Cardozo Middle School (math 5% / reading 10%, grade F, #168 of 179 statewide, top 94%, 625 students, 100% FRL); Forest Hill High School (math 5% / reading 15%, grade F, #168 of 197 statewide, top 86%, 991 students, 100% FRL).
- Market conditions: Rents rising fast (+13.6%/yr); 121 active listings in the ZIP; 4 comparable units currently listed for rent nearby; rentals at typical pace (median 26d on market — plan ~3-4 weeks tenant-placement turnaround); lower-income renter base — watch delinquency; 167 units permitted in Hinds County in 2024 (0 in 5+ unit buildings).
- At $1,332/mo this rent would consume 53% of the median local household income ($30k/yr) (locally 1099% of renters already pay >50% of income on rent) — very limited rent-growth headroom before tenants either downsize or default.
Forward outlook
- In year one you build about $6k of equity ($380 loan paydown + $6k appreciation (10.0% local appreciation)).
- Hinds County population projected to shrink 6% by 2050 — rents likely to lag national; underwrite the cash flow, not the appreciation.
- At projected returns (10.0% appreciation + 8.0% rent growth), your $15k cash investment doubles in ~2 years — after that, you're playing with house money.
- By year 6, paydown + projected appreciation supports a ~$35k cash-out refi (75% LTV) — recoverable capital for the next deal without selling this one.
Negotiation context
- It's been on market 87 days — a 6% lower offer ($52k) is reasonable based on typical stale-listing flexibility.
Risks & watch-outs
- Watch-outs: built in 1956 — expect roof / HVAC / electrical / plumbing capex.
- Climate carrying-cost: extreme-heat days projected 7→20/yr by 2055 (HVAC capex compounding) — expect insurance premiums to compound above CPI over the hold.
Questions for the listing agent
- It's been on market 87 days. Have you received any prior offers? Is the seller open to a 6% concession, seller financing, or rate buy-down credit?
- Have any recent inspections been done? Can we get a copy of the seller's disclosures and any deferred-maintenance estimates?
- Built in 1956 — when were the roof, HVAC, electrical panel, plumbing, and water heater last replaced?
- Why hasn't it sold? Are there any deal-killer items the seller is aware of (foundation, flood, title, zoning, code violations)?
- Is there a deadline driving the sale (1031 exchange, divorce, estate, relocation)? That informs how much negotiation room exists.
- Schools are F-rated, which usually means shorter tenancies and higher turnover. Who's the typical renter profile here, and what's been the actual vacancy rate?
- What's the average days-on-market for RENTAL listings here right now (not sales)? A rising rental-DOM trend means longer vacancies and softer asking-rent achievability than the comps imply.
- What's the recent tenant-quality profile in this submarket — average credit score on applications, eviction rate, late-payment / NSF rate, and stable-employment percentage? A property-management company in the area should have these aggregated.
- How much new for-sale + rental construction is in the pipeline within 1–3 miles? Heavy new supply typically softens prices + rents 12–24 months out; constrained supply supports both.
Investment metrics
- 1% rule
- 2.42% ✓
- Cap rate
- 20.95%
- Cash-on-cash
- 52.35%
- DSCR
- 3.33
- GRM
- 3.4
CMA / ARV
- ARV (median comp)
- $45,340
- List price
- $55,000
- Delta
- 21.31%
- Verdict
- OVERPRICED
- Comps
- 10 within 1.0 mi
Show comp detail 2 sales within ~0.75 mi
| Address | Dist | Beds/Ba | Sqft | Sold | Price | $/sf | Match |
|---|---|---|---|---|---|---|---|
| 5020 Barrier Pl | 0.44mi | 3/2.0 (-1) | 1,688 (+5%) | 12mo | $94,500 | $56 | 54 |
| 5042 Lurline Dr | 0.50mi | 4/2.0 | 1,796 (+12%) | 16mo | $89,999 | $50 | 41 |
Match score weights: distance 35% · size 25% · config 20% · recency 20%. Top-matched comps best support the ARV.
Projected returns pro-forma
10.0% appreciation · 8.0% rent growth · sell at horizon
- IRR
- 69.5%
- Equity multiple
- 6.18×
- Total profit
- $79,802
- Equity at exit
- $49,548
- IRR
- 65.2%
- Equity multiple
- 15.21×
- Total profit
- $218,827
- Equity at exit
- $106,853
Cash invested: $15,400 (down + closing). Projections, not guarantees.
Landlord ↔ Tenant lean methodology
- Overall (STATE)
- 90 Strongly Landlord-Friendly
- State Mississippi
- 90 Strongly Landlord-Friendly · R+11
- County
- — inherits STATE
- City
- — inherits STATE
ZIP-level market 39204
- Home prices YoY
- 8.0%
- Rents YoY
- 13.6%
- Active inventory
- 121
- Price-to-rent
- 3.4×
Monthly cashflow live
- Estimated rent
- $1,332 medium interval (Pro) →
- Mortgage (P&I)
- −$288
- Tax est. 1.5%
- −$69 /mo · $825/yr
- Insurance
- −$23
- HOA
- −$0
- Vacancy / Maint / Mgmt
- −$280
- Net cashflow
- $672
Break-even live
Sensitivity live
| Price | -10% $710 | -5% $691 | +0% $672 | +5% $653 | +10% $634 |
|---|---|---|---|---|---|
| Rent | -10% $567 | -5% $619 | +0% $672 | +5% $724 | +10% $777 |
| Rate | -1.0pp $700 | -0.5pp $686 | base $672 | +0.5pp $658 | +1.0pp $643 |
UW: 25.0% down · 7.5% · 30yr · 1.5% tax · 5.0% vac · 8.0% maint · 8.0% mgmt
Financing live
Cash to close
- Down payment
- $13,750
- Closing costs
- $1,650
- Reserves months
- —
- Total cash needed
- —
Loan-product check · same deal, 3 products live
Conventional
25% down · 7.5% · 30yr
- Down + closing
- —
- Monthly P&I
- —
- Monthly cashflow
- —
- DSCR
- —
- Eligible?
- —
Personal DTI + credit; lowest rate.
DSCR
20% down · 8.5% · 30yr
- Down + closing
- —
- Monthly P&I
- —
- Monthly cashflow
- —
- DSCR
- —
- Eligible?
- —
No personal income docs; deal must DSCR.
Hard money
10% down · 12.0% · 12mo
- Down + closing
- —
- Monthly P&I
- —
- Monthly cashflow
- —
- DSCR
- —
- Eligible?
- —
Short-term bridge; refi at stabilization.
Rent comps 4 comps
| Address | Beds | Baths | Sqft | Rent | $/sqft | DOM | Units | Dist |
|---|---|---|---|---|---|---|---|---|
| 2010 Chadwick Dr Jackson, MS | 3.0 | 2.0 | 1275 | $1,145 | $0.90 | 45d | 1 | 0.34mi |
| 5136 Lurline Dr Unit Ma Jackson, MS | 3.0 | 1.5 | 1134 | $1,100 | $0.97 | 16d | 1 | 0.71mi |
| 1805 Hospital Dr Jackson, MS | 3.0 | 2.0 | 1335 | $1,050 | $0.79 | 16d | 1 | 0.95mi |
| 125 Wingfield Ct Unit NA Jackson, MS | 4.0 | 2.0 | 1797 | $1,650 | $0.92 | 25d | 1 | 1.44mi |
Listing history 18 events
-
2026-06-22days on market $55,000 Active 87 DOM
-
2026-06-18days on market $55,000 Active 84 DOM
-
2026-06-17days on market $55,000 Active 83 DOM
-
2026-06-16days on market $55,000 Active 82 DOM
-
2026-06-15days on market $55,000 Active 81 DOM
-
2026-06-14days on market $55,000 Active 79 DOM
-
2026-06-13days on market $55,000 Active 78 DOM
-
2026-06-10days on market $55,000 Active 76 DOM
-
2026-06-09days on market $55,000 Active 75 DOM
-
2026-06-08days on market $55,000 Active 74 DOM
-
2026-06-07days on market $55,000 Active 73 DOM
-
2026-06-05days on market $55,000 Active 70 DOM
-
2026-06-03days on market $55,000 Active 69 DOM
-
2026-06-02days on market $55,000 Active 68 DOM
-
2026-06-01days on market $55,000 Active 67 DOM
-
2026-05-31days on market $55,000 Active 66 DOM
-
2026-05-30days on market $55,000 Active 65 DOM
-
2026-03-26$55,000 Active 382-char remark
Show marketing remark (382 chars)
Great investor opportunity in the heart of Jackson! This 4-bedroom, 3-bathroom home offers plenty of space and potential. Features include a covered carport and a large backyard. Conveniently located less than 5 minutes from Highway 80 and I-20 for easy access to the metro area. Property is being sold as-is and is perfect for investors or buyers looking to renovate and add value.
ⓘ Source: listings_history table (triggers on properties + properties_extension) + one-shot
backfill from property_details.listing_events for pre-trigger history.
Climate risk First Street
- Heat 7/10 Severe
- Air quality 1/10 Low 0 unhealthy d/yr today · 0 by 30 yrs out
Nearby sold comps map
Loading sold comps map…
Walkable amenities ~0.75 mi
Loading nearby amenities…
Taxation est. · year 1
- Rental income
- $15,979
- − Mortgage interest
- −$3,081
- − Property taxes
- −$825
- − Insurance
- −$275
- − Repairs & maintenance
- −$1,278
- − Management
- −$1,278
- − Depreciation
- −$1,600
- Taxable income
- $7,641
- Est. tax owed @ 24.0%
- −$1,834
- After-tax cash flow
- $6,228/yr
For passive investors: Depreciation is non-cash, so a rental often shows a tax loss while cash-flowing — sheltering income. Rental losses are passive: they offset passive income freely, and up to $25,000/yr can offset ordinary (W-2) income if you actively participate and your MAGI is under $100k (phasing out to $0 by $150k); unused losses carry forward. On sale, claimed depreciation is recaptured at up to 25%, and gains may owe capital-gains tax (a 1031 exchange can defer both). Figures are a year-1 estimate at your 24.0% rate — not tax advice; consult a CPA.
Condition & rehab AI · 12 photos
This home requires moderate renovations to improve its condition and increase its value. Key areas for improvement include exterior siding, interior paint, kitchen cabinets, and bathroom fixtures.
Repairs flagged
- Major exterior siding — Significant wear and tear
- Major interior paint — Worn and peeling
- Major kitchen cabinets — Old and outdated
- Major bathroom fixtures — Small and outdated
Value-add opportunities
- Both Paint interior walls — Fresh paint enhances curb appeal and interior aesthetics
- Both Replace carpet — New carpet improves comfort and adds value
- Both Upgrade kitchen cabinets — Modern cabinets increase functionality and appeal
- Both Replace bathroom fixtures — New fixtures improve functionality and aesthetics
Renovation cost estimate screening
| Repair item | Severity | Est. cost |
|---|---|---|
| exterior siding · Significant wear and tear | Major | $15,000–50,000 |
| interior paint · Worn and peeling | Major | $15,000–50,000 |
| kitchen cabinets · Old and outdated | Major | $15,000–50,000 |
| bathroom fixtures · Small and outdated | Major | $15,000–50,000 |
| Total estimated repair cost · 4 items | $60,000–200,000 |
Value-add ROI direction
- Both Paint interior walls — Fresh paint enhances curb appeal and interior aesthetics ↑
- Both Replace carpet — New carpet improves comfort and adds value ↑
- Both Upgrade kitchen cabinets — Modern cabinets increase functionality and appeal ↑
- Both Replace bathroom fixtures — New fixtures improve functionality and aesthetics ↑
ⓘ Cost ranges are severity-bucket heuristics (US national rule-of-thumb). Get contractor quotes + a written scope before underwriting a rehab budget.
Schools (NCES district)
- District
- Jackson Public School District
- NCES district ID
- 2802190
- Math proficiency
- 9% ▼ -14.00%
- Reading proficiency
- 18% ▼ -7.00%
- Median HH income
- $33,234
- Composite
- 10.89/100
- National rank
- #9755
- State rank
- #112 of 130 in MS
Livability — Jackson
- Score
- 68/100
- State rank
- #66
- US rank
- #9695
Category grades
Schools grade is shown separately in the Schools card above.
Census & demographics
- Census place
- Jackson, MS
- County
- Hinds County · 167,040 people
- City population
- 140,204
- Metro
- Jackson, MS
- Population (ZIP)
- 13,249
- Household income
- $30,237
- Rent vs Own
- Severe rent burden
- 1099.0
Population outlook (Hinds County) Hauer SSP2
- Today (2025)
- 242,528 people
- By 2030
- 241,113 · -0.6%
- By 2040
- 235,557 · -2.9%
- By 2050
- 226,946 · -6.4%
- By 2075
- 199,995 · -17.5%
- By 2100
- 164,165 · -32.3%
Race, ethnicity, and origin ACS 2023
- Neighborhood character
- Predominantly Black (90%)
- Race & ethnicity
- Black 90% White 5% Two or more races 4% Hispanic / Latino 3%
- Foreign-born
- 2% · Canada
- Languages at home
- 97% English-only · Spanish 2%
Political lean MEDSL · Hinds
- 2024 margin
- Solid D (+46.1) · D 72.4% · R 26.3% · Other 1.4%
- 2008→2024 swing
- +7.1pp toward D · 2008: 39.0pp · 2024: 46.1pp
- All cycles
- 2024: D+46.1 2020: D+48.3 2016: D+43.7 2012: D+45.1 2008: D+39.0
Not yet ingested
- Civics
- —
Market trends
- HPI YoY
- ▲ 17.25%
- Current HPI
- 233.9061
- Rent YoY
- ▲ 13.56%
- Metro
- Jackson, MS
- State GDP YoY
- —
- F500 in state
- 0
Price history
1 event — show timeline
- 2026-03-26 Listed $55,000 MLSU
Cash-flow waterfall
monthlySold comps — $/sqft
last 12 mo · ≤1 miLoading sold comps…