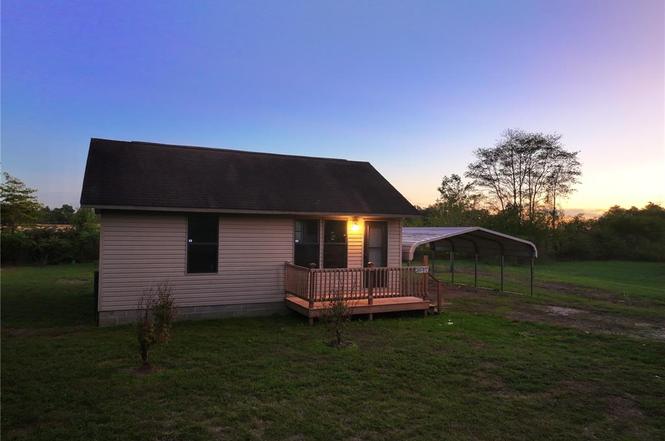
5040 County Road 628 · Fisk, MO
Flood risk 1/10 · Minimal
- FEMA flood zone
- A
- Chance of flooding over 30 yrs
- 0.0%
- Est. flood insurance / yr
- $1,009 – $1,996
Fire risk 3/10 · Minor
- Est. fire insurance / yr
- $1,054 – $1,958
Heat risk 6/10 · Moderate
- Hot days now (above 108°F)
- 7 days/yr
- Hot days in 30 yrs
- 21 days/yr
Wind risk 4/10 · Minor
- Chance of severe wind over 30 yrs
- 8.0%
Air-quality risk 2/10 · Minimal
- Unhealthy air days now
- 1 days/yr
- Unhealthy air days in 30 yrs
- 3 days/yr
Risk factors via First Street. Map © Google.
Why this score? — see what drove the C+ grade
The composite is a weighted blend of 9 inputs, each scored 0–100. Each bar is that input's sub-score; the figure is the points it added to the 100-point composite (weight × sub-score).
- Cash flow +24.8/30.0
- DSCR +8.1/10.0
- ARV discount +7.5/15.0
- 1% rule +5.3/10.0
- Appreciation +5.0/10.0
- Livability +3.1/5.0
- Schools +2.7/10.0
- Rent growth +2.5/5.0
- Condition / age +2.5/5.0
$73,800
🖨 Deal sheet 📄 Offer letter ✓ Due diligence
Listing remarks
Discover this delightful 1-bedroom, 1-bath cottage tucked away at the end of a quiet road. Enjoy peaceful surroundings, stunning sunsets, and brand-new appliances—all at an unbeatable price. Full of charm and perfect for anyone seeking a cozy, budget-friendly home.
Key facts
- Brand-new appliances
- 0.42 acre lot
- Parking
Tags
Neighborhood map
What this means for you Summary
Snapshot
- This is a 1-bed/1.0-bath other listed at $74k.
Deal economics
- At list price, monthly cash flow is $32 ($379/yr) — positive.
- The deal already cash-flows at list — no discount required.
- Meets the 1% rule at list price ($760 rent vs $74k).
- Recommended offer: $65k (12.0% below list) — sets the bar for market timing.
Location & tenants
- Location reads 62/100 on livability (#380 in MO) — a middle-class / working-renter tenant base. Strengths: cost of living A+, housing A+; Watch: employment C-, health & safety C-, crime F.
- Twin Rivers R-X (rural): math 27% / reading 39% proficiency, ranked #250 of 324 in MO (top 77%) — families likely to look elsewhere, expect single-tenant / working-renter base with shorter leases.
- Zoned schools: Fisk Elementary (math 23% / reading 35%, grade F, #842 of 1,115 statewide, top 76%, 345 students, 89% FRL); Twin Rivers High (math 5% / reading 52%, grade F, #409 of 521 statewide, top 79%, 249 students, 90% FRL) — zoned schools average 89% FRL vs 57% district-wide (33 pts higher); higher-poverty schools than district average — tighter screening recommended.
- Market conditions: 6 active listings in the ZIP; 63 units permitted in Butler County in 2024 (48 in 5+ unit buildings).
Forward outlook
- In year one you build about $3k of equity ($510 loan paydown + $2k appreciation (3.0% local appreciation)).
- Butler County population projected to shrink 6% by 2050 — rents likely to lag national; underwrite the cash flow, not the appreciation.
- At projected returns (3.0% appreciation + 3.0% rent growth), your $21k cash investment doubles in ~6 years — after that, you're playing with house money.
Negotiation context
- It's been on market 135 days — a 12% lower offer ($65k) is reasonable based on typical stale-listing flexibility.
Risks & watch-outs
- Watch-outs: flood insurance adds $125/mo.
- Climate carrying-cost: in FEMA flood zone A (mandatory federal flood insurance); extreme-heat days projected 7→21/yr by 2055 (HVAC capex compounding) — expect insurance premiums to compound above CPI over the hold.
Questions for the listing agent
- It's been on market 135 days. Have you received any prior offers? Is the seller open to a 12% concession, seller financing, or rate buy-down credit?
- What's the actual annual flood-insurance premium (NFIP or private), and is the property in a SFHA with mandatory coverage?
- Why hasn't it sold? Are there any deal-killer items the seller is aware of (foundation, flood, title, zoning, code violations)?
- Is there a deadline driving the sale (1031 exchange, divorce, estate, relocation)? That informs how much negotiation room exists.
- Schools are D-rated, which usually means shorter tenancies and higher turnover. Who's the typical renter profile here, and what's been the actual vacancy rate?
- Crime grade is F in this area — have there been break-ins, vandalism, or insurance claims at this property in the last 3 years? What carrier currently insures it and at what premium?
- What's the average days-on-market for RENTAL listings here right now (not sales)? A rising rental-DOM trend means longer vacancies and softer asking-rent achievability than the comps imply.
- What's the recent tenant-quality profile in this submarket — average credit score on applications, eviction rate, late-payment / NSF rate, and stable-employment percentage? A property-management company in the area should have these aggregated.
- How much new for-sale + rental construction is in the pipeline within 1–3 miles? Heavy new supply typically softens prices + rents 12–24 months out; constrained supply supports both.
Investment metrics
- 1% rule
- 1.03% ✓
- Cap rate
- 8.84%
- Cash-on-cash
- 9.11%
- DSCR
- 1.41
- GRM
- 8.1
CMA / ARV
No comps found within radius.
Projected returns pro-forma
3.0% appreciation · 3.0% rent growth · sell at horizon
- IRR
- 9.2%
- Equity multiple
- 1.53×
- Total profit
- $10,951
- Equity at exit
- $33,184
- IRR
- 11.7%
- Equity multiple
- 2.75×
- Total profit
- $36,240
- Equity at exit
- $51,140
Cash invested: $20,664 (down + closing). Projections, not guarantees.
Landlord ↔ Tenant lean methodology
- Overall (STATE)
- 81 Strongly Landlord-Friendly
- State Missouri
- 81 Strongly Landlord-Friendly · R+10
- County
- — inherits STATE
- City
- — inherits STATE
ZIP-level market 63940
- Active inventory
- 6
- Price-to-rent
- 8.1×
Monthly cashflow live
- Estimated rent
- $760 medium interval (Pro) →
- Mortgage (P&I)
- −$387
- Tax from tax record
- −$26 /mo · $307/yr
- Insurance
- −$31
- Flood insurance flood zone
- −$125 /mo · $1,502/yr
- HOA
- −$0
- Vacancy / Maint / Mgmt
- −$160
- Net cashflow
- $32
Break-even live
UW: 25.0% down · 7.5% · 30yr · 1.5% tax · 5.0% vac · 8.0% maint · 8.0% mgmt
Financing live
Cash to close
- Down payment
- $18,450
- Closing costs
- $2,214
- Reserves months
- —
- Total cash needed
- —
Loan-product check · same deal, 3 products live
Conventional
25% down · 7.5% · 30yr
- Down + closing
- —
- Monthly P&I
- —
- Monthly cashflow
- —
- DSCR
- —
- Eligible?
- —
Personal DTI + credit; lowest rate.
DSCR
20% down · 8.5% · 30yr
- Down + closing
- —
- Monthly P&I
- —
- Monthly cashflow
- —
- DSCR
- —
- Eligible?
- —
No personal income docs; deal must DSCR.
Hard money
10% down · 12.0% · 12mo
- Down + closing
- —
- Monthly P&I
- —
- Monthly cashflow
- —
- DSCR
- —
- Eligible?
- —
Short-term bridge; refi at stabilization.
Listing history 8 events
-
2026-02-25status Pending
-
2026-02-02price $73,800
-
2026-01-07price $76,700
-
2025-12-01price $78,900
-
2025-10-24price $79,900
-
2025-10-13$84,900 Active
-
2018-12-31soldstatus
-
2009-10-30soldstatus
ⓘ Source: listings_history table (triggers on properties + properties_extension) + one-shot
backfill from property_details.listing_events for pre-trigger history.
Tax reassessment forecast MO · Resets to sale price
- Current annual tax
- $307 · $26/mo
- Projected year-2 tax
- $716 · $60/mo
- Expected delta
- +$408/yr (+$34/mo · 132.8%)
ⓘ Screening estimate from a state-policy table — verify with the county assessor before closing.
Climate risk First Street
- Flood 1/10 Low FEMA zone A · 0% chance over 30 yrs
- Wildfire 3/10 Moderate
- Heat 6/10 Major 7 d/yr ≥108°F today · 21 d/yr by 30 yrs out
- Wind 4/10 Moderate 8% chance of damaging wind over 30 yrs
- Air quality 2/10 Low 1 unhealthy d/yr today · 3 by 30 yrs out
Nearby sold comps map
Loading sold comps map…
Walkable amenities ~0.75 mi
Loading nearby amenities…
Taxation est. · year 1
- Rental income
- $9,117
- − Mortgage interest
- −$4,134
- − Property taxes
- −$307
- − Insurance
- −$1,871
- − Repairs & maintenance
- −$729
- − Management
- −$729
- − Depreciation
- −$2,147
- Taxable loss
- −$801
- Est. tax savings @ 24.0%
- +$192
- After-tax cash flow
- $572/yr
For passive investors: Depreciation is non-cash, so a rental often shows a tax loss while cash-flowing — sheltering income. Rental losses are passive: they offset passive income freely, and up to $25,000/yr can offset ordinary (W-2) income if you actively participate and your MAGI is under $100k (phasing out to $0 by $150k); unused losses carry forward. On sale, claimed depreciation is recaptured at up to 25%, and gains may owe capital-gains tax (a 1031 exchange can defer both). Figures are a year-1 estimate at your 24.0% rate — not tax advice; consult a CPA.
Schools (NCES district)
- District
- Twin Rivers R-X
- NCES district ID
- 2930520
- Math proficiency
- 27% ▼ -9.00%
- Reading proficiency
- 39% ▼ -5.00%
- Median HH income
- $34,037
- Composite
- 27.12/100
- National rank
- #7037
- State rank
- #250 of 324 in MO
Livability — Fisk
- Score
- 62/100
- State rank
- #380
- US rank
- #16726
Category grades
Schools grade is shown separately in the Schools card above.
Census & demographics
- Population (ZIP)
- 1,501
Population outlook (Butler County) Hauer SSP2
- Today (2025)
- 42,648 people
- By 2030
- 42,329 · -0.7%
- By 2040
- 41,498 · -2.7%
- By 2050
- 40,308 · -5.5%
- By 2075
- 36,168 · -15.2%
- By 2100
- 28,893 · -32.3%
Race, ethnicity, and origin ACS 2023
- Neighborhood character
- Predominantly White (95%)
- Race & ethnicity
- White 95% Two or more races 5%
- Common ancestry
- Slovak 3% Lithuanian 2% Scotch-Irish 1%
- Languages at home
- 98% English-only · Spanish 2%
Political lean MEDSL · Butler
- 2024 margin
- Solid R (+63.8) · D 17.7% · R 81.5%
- 2008→2024 swing
- -26.4pp toward R · 2008: -37.4pp · 2024: -63.8pp
- All cycles
- 2024: R+63.8 2020: R+62.3 2016: R+61.6 2012: R+46.7 2008: R+37.4
Not yet ingested
- Civics
- —
Market trends
- HPI YoY
- —
- Current HPI
- —
- Rent YoY
- —
- Metro
- —
- State GDP YoY
- ▲ 1.84%
- F500 in state
- 20
Industry mix (Fortune 500 HQ in MO)
| Industry | F500 HQs | Revenue |
|---|---|---|
| Healthcare | 1 | $163B |
|
||
| Insurance | 1 | $21B |
|
||
| Industrial Technology | 1 | $17B |
|
||
| Retail | 1 | $16B |
|
||
| Industrial Distribution | 1 | $10B |
|
||
| Utilities | 1 | $9B |
|
||
Price history
-13.1% since first listed8 events — show timeline
- 2026-02-25 Pending — MARIS as Distributed by MLS Grid
- 2026-02-02 Price Changed $73,800 MARIS as Distributed by MLS Grid
- 2026-01-07 Price Changed $76,700 MARIS as Distributed by MLS Grid
- 2025-12-01 Price Changed $78,900 MARIS as Distributed by MLS Grid
- 2025-10-24 Price Changed $79,900 MARIS as Distributed by MLS Grid
- 2025-10-13 Listed $84,900 MARIS as Distributed by MLS Grid
- 2018-12-31 Sold (Public Records) — Public Records
- 2009-10-30 Sold (Public Records) — Public Records
Property tax history
+1.1%/yrLatest (2025): $307 · +7.8% YoY. Source: county tax records.
Cash-flow waterfall
monthlySold comps — $/sqft
last 12 mo · ≤1 miLoading sold comps…