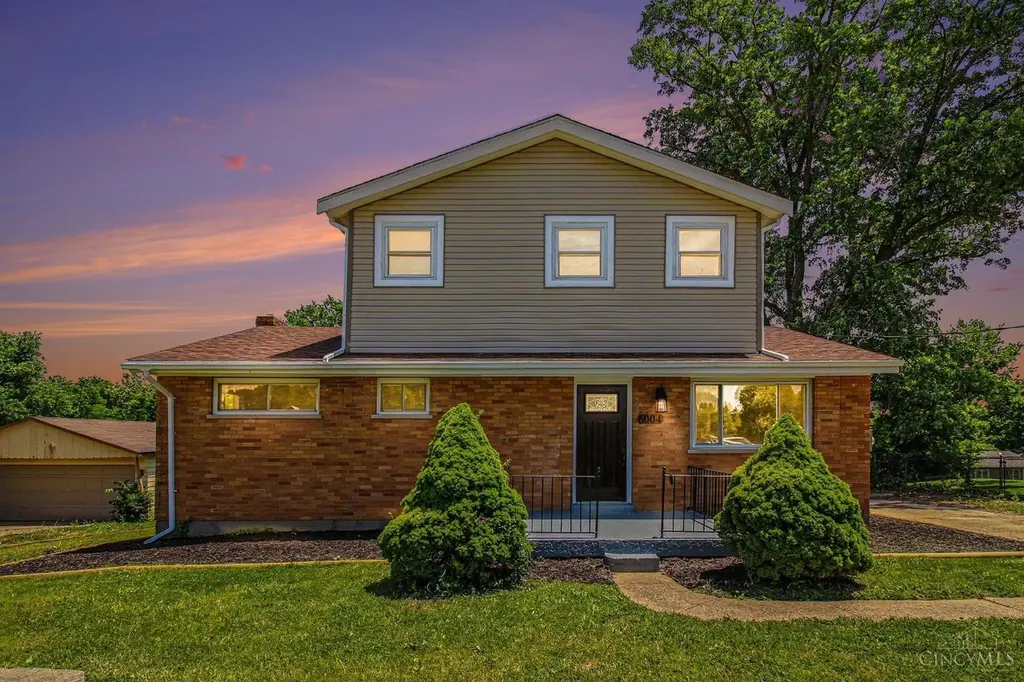
6004 Snyder Rd · Dent, OH
Flood risk 1/10 · Minimal
- FEMA flood zone
- X (unshaded)
- Chance of flooding over 30 yrs
- 0.0%
- Est. flood insurance / yr
- $473 – $860
Fire risk 1/10 · Minimal
- Est. fire insurance / yr
- $713 – $1,323
Heat risk 4/10 · Minor
- Hot days now (above 102°F)
- 7 days/yr
- Hot days in 30 yrs
- 19 days/yr
Wind risk 2/10 · Minimal
- Chance of severe wind over 30 yrs
- 1.0%
Air-quality risk 3/10 · Minor
- Unhealthy air days now
- 2 days/yr
- Unhealthy air days in 30 yrs
- 4 days/yr
Risk factors via First Street. Map © Google.
Why this score? — see what drove the B grade
The composite is a weighted blend of 9 inputs, each scored 0–100. Each bar is that input's sub-score; the figure is the points it added to the 100-point composite (weight × sub-score).
- Cash flow +30.0/30.0
- 1% rule +10.0/10.0
- DSCR +10.0/10.0
- ARV discount +7.5/15.0
- Schools +6.0/10.0
- Livability +3.8/5.0
- Rent growth +2.5/5.0
- Condition / age +2.5/5.0
- Appreciation +0.0/10.0
$315,000
🖨 Deal sheet (PDF) 📄 Offer letter ✓ Due diligence
Listing remarks
Fully renovated and move-in ready! This beautifully updated 4-bedroom, 2-bathroom home offers the perfect blend of modern upgrades and timeless charm. The stunning brand-new kitchen features new cabinetry, countertops, appliances, and fixtures, while the fully remodeled bathrooms showcase contemporary finishes and updated plumbing. Enjoy beautiful hardwood floors, brand-new carpeting, updated electrical and plumbing systems, new interior doors, and most windows replaced throughout the home. Every detail has been thoughtfully updated to provide comfort, style, and peace of mind. Major improvements include a roof approximately 2 years old, updated gutters, a water heater approximately 2 years
Key facts
- Fully renovated
- Updated electrical
- New carpeting
Tags
Property features AI
Finance
- HOA & community: No homeowners association
Exterior
- Utilities: Public water; Public sewer; Natural gas service
- Home design: Traditional single-family home; Two levels; Block foundation; Second floor area approx. 600
- Construction: Brick and wood siding exterior; Shingle roof
- Exterior features: Vinyl windows; Lot approximately 0.459 acres; Residential zoning
Interior
- Kitchen: Kitchen space approx. 15 x 10
- Bedrooms: Four bedrooms total; Primary bedroom on level 1 (approx. 11 x 9); One bedroom on level 2 (approx. 11 x 9); Second bedroom on level 2 (approx. 10 x 10); Third bedroom on level 2 (approx. 10 x 9)
- Bathrooms: Two full bathrooms; One full bathroom on level 1; One full bathroom on level 2
- Heating & cooling: Forced air heating; Central air conditioning; Gas water heating
- Interior features: Eight total rooms; Full basement
Neighborhood map
What this means for you Summary
Snapshot
- This is a 4-bed/2.0-bath single-family listed at $315k.
Deal economics
- At list price, monthly cash flow is $2k ($27k/yr) — positive.
- The deal already cash-flows at list — no discount required.
- Meets the 1% rule at list price ($6k rent vs $315k).
- Recommended offer: $310k (1.5% below list) — sets the bar for market timing.
- Cap rate 14.8% vs local median 2.9% in Dent — top-decile yield for the area; either an underpriced asset or a hidden risk that comps aren't pricing in. Stress-test before assuming the spread holds.
Location & tenants
- Location reads 75/100 on livability (#245 in OH, #3,901 nationally) — a middle-class / working-renter tenant base. Strengths: crime A+, employment A+, housing A+; Watch: health & safety C-, amenities F, commute F.
- Oak Hills Local (suburban): math 68% / reading 70% proficiency, ranked #141 of 656 in OH (top 22%) — acceptable for families but not a draw, mixed tenant base, ~2y average lease.
- Zoned schools: Charles W Springmyer Elementary School (math 84% / reading 82%, grade A+, #102 of 1,584 statewide, top 7%, 460 students, 21% FRL); Bridgetown Middle School (math 71% / reading 77%, grade A, #94 of 654 statewide, top 15%, 648 students, 0% FRL); Oak Hills High School (math 8% / reading 69%, grade F, #557 of 781 statewide, top 72%, 2,325 students, 0% FRL).
- Market conditions: 50 active listings in the ZIP; 1 comparable units currently listed for rent nearby; solid renter incomes; 801 units permitted in Hamilton County in 2024 (190 in 5+ unit buildings).
- At $5,500/mo this rent would consume 69% of the median local household income ($96k/yr) — very limited rent-growth headroom before tenants either downsize or default.
Forward outlook
- Local home prices are declining (-3.0%/yr); year-one equity from $2k of loan paydown is wiped out by about $9k of value loss. Plan a longer hold.
- At projected returns (-3.0% appreciation + 3.0% rent growth), your $88k cash investment doubles in ~4 years — after that, you're playing with house money.
Negotiation context
- It's been on market 15 days — a 2% lower offer ($310k) is reasonable based on typical stale-listing flexibility.
- Current owner paid $59k; list at $315k implies a 434% gain — meaningful room to come down on a strong offer.
Risks & watch-outs
- Watch-outs: built in 1958 — expect roof / HVAC / electrical / plumbing capex.
Questions for the listing agent
- Built in 1958 — when were the roof, HVAC, electrical panel, plumbing, and water heater last replaced?
- Is there a deadline driving the sale (1031 exchange, divorce, estate, relocation)? That informs how much negotiation room exists.
- What's the average days-on-market for RENTAL listings here right now (not sales)? A rising rental-DOM trend means longer vacancies and softer asking-rent achievability than the comps imply.
- What's the recent tenant-quality profile in this submarket — average credit score on applications, eviction rate, late-payment / NSF rate, and stable-employment percentage? A property-management company in the area should have these aggregated.
- How much new for-sale + rental construction is in the pipeline within 1–3 miles? Heavy new supply typically softens prices + rents 12–24 months out; constrained supply supports both.
Investment metrics
- 1% rule
- 1.75% ✓
- Cap rate
- 14.79%
- Cash-on-cash
- 30.35%
- DSCR
- 2.35
- GRM
- 4.8
CMA / ARV
No comps found within radius.
Projected returns pro-forma
-3.0% appreciation · 3.0% rent growth · sell at horizon
- IRR
- 25.0%
- Equity multiple
- 2.03×
- Total profit
- $91,064
- Equity at exit
- $46,968
- IRR
- 32.8%
- Equity multiple
- 3.98×
- Total profit
- $262,407
- Equity at exit
- $27,235
Cash invested: $88,200 (down + closing). Projections, not guarantees.
Landlord ↔ Tenant lean methodology
- Overall (STATE)
- 73 Landlord-Friendly
- State Ohio
- 73 Landlord-Friendly · R+6
- County
- — inherits STATE
- City
- — inherits STATE
ZIP-level market 45247
- Active inventory
- 50
- Price-to-rent
- 4.8×
Monthly cashflow live
- Estimated rent
- $5,500 medium interval (Pro) →
- Mortgage (P&I)
- −$1,652
- Tax from tax record
- −$331 /mo · $3,976/yr
- Insurance
- −$131
- HOA
- −$0
- Vacancy / Maint / Mgmt
- −$1,155
- Net cashflow
- $2,231
Break-even live
Sensitivity live
| Price | -10% $2,409 | -5% $2,320 | +0% $2,231 | +5% $2,141 | +10% $2,052 |
|---|---|---|---|---|---|
| Rent | -10% $1,796 | -5% $2,013 | +0% $2,231 | +5% $2,448 | +10% $2,665 |
| Rate | -1.0pp $2,389 | -0.5pp $2,311 | base $2,231 | +0.5pp $2,149 | +1.0pp $2,066 |
UW: 25.0% down · 7.5% · 30yr · 1.5% tax · 5.0% vac · 8.0% maint · 8.0% mgmt
Financing live
Cash to close
- Down payment
- $78,750
- Closing costs
- $9,450
- Reserves months
- —
- Total cash needed
- —
Loan-product check · same deal, 3 products live
Conventional
25% down · 7.5% · 30yr
- Down + closing
- —
- Monthly P&I
- —
- Monthly cashflow
- —
- DSCR
- —
- Eligible?
- —
Personal DTI + credit; lowest rate.
DSCR
20% down · 8.5% · 30yr
- Down + closing
- —
- Monthly P&I
- —
- Monthly cashflow
- —
- DSCR
- —
- Eligible?
- —
No personal income docs; deal must DSCR.
Hard money
10% down · 12.0% · 12mo
- Down + closing
- —
- Monthly P&I
- —
- Monthly cashflow
- —
- DSCR
- —
- Eligible?
- —
Short-term bridge; refi at stabilization.
Rent comps 1 comps
| Address | Beds | Baths | Sqft | Rent | $/sqft | DOM | Units | Dist |
|---|---|---|---|---|---|---|---|---|
| 6268 Mullen Rd Cincinnati, OH | 4.0 | 2.0 | 2025 | $5,500 | $2.72 | 3d | 1 | 1.29mi |
Listing history 10 events
-
2026-06-21days on market $315,000 Active 15 DOM
-
2026-06-18days on market $315,000 Active 12 DOM
-
2026-06-17days on market $315,000 Active 11 DOM
-
2026-06-16days on market $315,000 Active 10 DOM
-
2026-06-15days on market $315,000 Active 9 DOM
-
2026-06-13days on market $315,000 Active 7 DOM
-
2026-06-09days on market $315,000 Active 3 DOM
-
2026-06-08days on market $315,000 Active 2 DOM
-
2026-06-07remarks 699-char remark
-
2026-06-07$315,000 Active 1 DOM
ⓘ Source: listings_history table (triggers on properties + properties_extension) + one-shot
backfill from property_details.listing_events for pre-trigger history.
Tax reassessment forecast OH · Partial reset (capped growth)
- Current annual tax
- $3,976 · $331/mo
- Projected year-2 tax
- $4,445 · $370/mo
- Expected delta
- +$469/yr (+$39/mo · 11.8%)
ⓘ Screening estimate from a state-policy table — verify with the county assessor before closing.
Climate risk First Street
- Flood 1/10 Low FEMA zone X (unshaded) · 0% chance over 30 yrs
- Wildfire 1/10 Low
- Heat 4/10 Moderate 7 d/yr ≥102°F today · 19 d/yr by 30 yrs out
- Wind 2/10 Low 100% chance of damaging wind over 30 yrs
- Air quality 3/10 Moderate 2 unhealthy d/yr today · 4 by 30 yrs out
Nearby sold comps map
Loading sold comps map…
Walkable amenities ~0.75 mi
Loading nearby amenities…
Taxation est. · year 1
- Rental income
- $66,000
- − Mortgage interest
- −$17,645
- − Property taxes
- −$3,976
- − Insurance
- −$1,575
- − Repairs & maintenance
- −$5,280
- − Management
- −$5,280
- − Depreciation
- −$9,164
- Taxable income
- $23,080
- Est. tax owed @ 24.0%
- −$5,539
- After-tax cash flow
- $21,227/yr
For passive investors: Depreciation is non-cash, so a rental often shows a tax loss while cash-flowing — sheltering income. Rental losses are passive: they offset passive income freely, and up to $25,000/yr can offset ordinary (W-2) income if you actively participate and your MAGI is under $100k (phasing out to $0 by $150k); unused losses carry forward. On sale, claimed depreciation is recaptured at up to 25%, and gains may owe capital-gains tax (a 1031 exchange can defer both). Figures are a year-1 estimate at your 24.0% rate — not tax advice; consult a CPA.
Schools (NCES district)
- District
- Oak Hills Local
- NCES district ID
- 3904737
- Math proficiency
- 68% ▼ -11.00%
- Reading proficiency
- 70% ▼ -8.00%
- Median HH income
- $67,889
- Composite
- 60.25/100
- National rank
- #858
- State rank
- #141 of 656 in OH
Livability — Dent
- Score
- 75/100
- State rank
- #245
- US rank
- #3901
Category grades
Schools grade is shown separately in the Schools card above.
Census & demographics
- Census place
- Dent, OH
- County
- Hamilton · 838,887 people
- Metro
- Cincinnati, OH-KY-IN
- Population (ZIP)
- 23,588
- Household income
- $95,810
- Rent vs Own
- Severe rent burden
- 10.7
Population outlook (Hamilton County) Hauer SSP2
- Today (2025)
- 826,054 people
- By 2030
- 830,947 · +0.6%
- By 2040
- 832,319 · +0.8%
- By 2050
- 822,428 · -0.4%
- By 2075
- 788,688 · -4.5%
- By 2100
- 710,674 · -14.0%
Race, ethnicity, and origin ACS 2023
- Neighborhood character
- Predominantly White (87%)
- Race & ethnicity
- White 87% Black 7% Two or more races 4%
- Common ancestry
- Romanian 3% Lithuanian 2% Italian 2%
- Foreign-born
- 3% · China
- Languages at home
- 96% English-only · Arabic 1% Russian/Polish/Slavic 1% Spanish 1%
Political lean MEDSL · Hamilton
- 2024 margin
- D (+14.9) · D 57.0% · R 42.1%
- 2008→2024 swing
- +7.9pp toward D · 2008: 7.0pp · 2024: 14.9pp
- All cycles
- 2024: D+14.9 2020: D+15.9 2016: D+9.5 2012: D+4.9 2008: D+7.0
Not yet ingested
- Civics
- —
Market trends
- HPI YoY
- ▼ -126.31%
- Current HPI
- 204.334
- Rent YoY
- —
- Metro
- —
- State GDP YoY
- ▲ 1.98%
- F500 in state
- 48
Industry mix (Fortune 500 HQ in OH)
| Industry | F500 HQs | Revenue |
|---|---|---|
| Insurance | 3 | $145B |
|
||
| Industrial Machinery | 3 | $49B |
|
||
| Financial Services | 3 | $24B |
|
||
| Consumer Goods | 2 | $93B |
|
||
| Aerospace / Defense | 2 | $47B |
|
||
| Utilities | 2 | $33B |
|
||
Price history
+433.9% since first listed2 events — show timeline
- 2026-06-06 Listed $315,000 Cincy MLS
- 1986-11-05 Sold (Public Records) $59,000 Public Records
Property tax history
+5.7%/yrLatest (2025): $3,976 · +20.4% YoY. Source: county tax records.
Cash-flow waterfall
monthlySold comps — $/sqft
last 12 mo · ≤1 miLoading sold comps…