 Fourplex
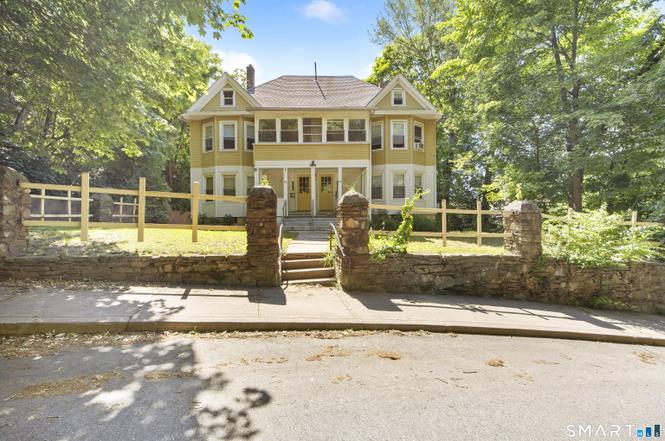
12 Arch St · Manchester, CT
Flood risk 1/10 · Minimal
- FEMA flood zone
- X (unshaded)
- Chance of flooding over 30 yrs
- 0.0%
- Est. flood insurance / yr
- $507 – $1,088
Fire risk 2/10 · Minimal
- Est. fire insurance / yr
- $829 – $1,539
Heat risk 5/10 · Moderate
- Hot days now (above 95°F)
- 7 days/yr
- Hot days in 30 yrs
- 17 days/yr
Wind risk 6/10 · Moderate
- Chance of severe wind over 30 yrs
- 27.0%
Air-quality risk 3/10 · Minor
- Unhealthy air days now
- 3 days/yr
- Unhealthy air days in 30 yrs
- 4 days/yr
Risk factors via First Street. Map © Google.
Why this score? — see what drove the C grade
The composite is a weighted blend of 9 inputs, each scored 0–100. Each bar is that input's sub-score; the figure is the points it added to the 100-point composite (weight × sub-score).
- Cash flow +22.7/30.0
- ARV discount +12.0/15.0
- DSCR +7.3/10.0
- 1% rule +5.7/10.0
- Livability +3.8/5.0
- Rent growth +3.0/5.0
- Schools +2.5/10.0
- Condition / age +2.5/5.0
- Appreciation +0.0/10.0
$725,000
🖨 Deal sheet 📄 Offer letter ✓ Due diligence
Multi-family units
County records classify this as Multi-Family (5+ Unit). Listing-text estimate: 4 units. estimate disagrees with records
5+ unit building — per-unit beds/baths from public records are typically unavailable; the breakdown below (if shown) is an estimate from the listing text.
Listing remarks
* * BEST AND FINAL by Wednesday 12 pm * * . .. .Set behind a classic stone wall and framed by mature trees, 12-14 Arch Street presents a rare opportunity to acquire a fully occupied 4-family asset combining strong in-place cash flow, timeless New England character, and meaningful upside potential. Generating over $103,000 in annual gross income, the property features an ideal unit mix of two 2-bedroom apartments and two 3-bedroom apartments, providing broad tenant appeal and long-term stability. Each apartment offers spacious layouts, abundant natural light, hardwood flooring, updated kitchens and baths, and the architectural charm that continues to attract quality tenants. Enclosed porch
Key facts
- Ideal unit mix
- Spacious layouts
- 0.4 acre lot
Tags
Property features AI
Finance
- Financial info: Assessed value listed
Exterior
- Utilities: Public water connected; Public sewer connected; Fuel tank located in basement; Estimated annual heating cost: $4,500
- Home design: Multi-family property (4-family)
- Construction: Frame construction; Concrete foundation; Built as multi-family (living area recorded)
- Exterior features: Level lot; Aluminum siding; Asphalt shingle roof
Interior
- Bedrooms: 10 total bedrooms
- Bathrooms: 4 full bathrooms
- Heating & cooling: Hot water heating; Heat fuel: natural gas and oil; Electric domestic hot water
- Interior features: Ceiling fans; Full basement; Walk-up attic
Neighborhood map
What this means for you Summary
Snapshot
- This is a 4 × 2-bed/1.0-bath units multifamily listed at $725k.
Deal economics
- At list price, monthly cash flow is $1k ($15k/yr) — positive. Per door: $312/mo.
- The deal already cash-flows at list — no discount required.
- Meets the 1% rule at list price ($8k rent vs $725k).
- Cap rate 8.4% vs local median 3.8% in Manchester — top-decile yield for the area; either an underpriced asset or a hidden risk that comps aren't pricing in. Stress-test before assuming the spread holds.
Location & tenants
- Location reads 76/100 on livability (#59 in CT, #3,580 nationally) — a middle-class / working-renter tenant base. Strengths: housing A+, health & safety A+, cost of living A-; Watch: amenities D, commute F.
- Manchester School District (suburban): math 21% / reading 32% proficiency, ranked #130 of 153 in CT (top 85%) — low school quality limits family demand, transient renter base, plan for 1-2y turnover.
- Market conditions: Rents rising (+2.0%/yr); 99 active listings in the ZIP; solid renter incomes; 1,867 units permitted in Capitol Planning Region in 2024 (1,399 in 5+ unit buildings).
- At $7,737/mo this rent would consume 111% of the median local household income ($83k/yr) (locally 1839% of renters already pay >50% of income on rent) — very limited rent-growth headroom before tenants either downsize or default.
Forward outlook
- Local home prices are declining (-3.0%/yr); year-one equity from $5k of loan paydown is wiped out by about $22k of value loss. Plan a longer hold.
Negotiation context
- Only 7 days on market — expect competitive offers; lowballing is unlikely to land.
- 2 sale attempts with the ask held roughly flat each time — persistent listings suggest the price (not the market) is what's stuck; bring a comps-based counter.
- Current owner paid $75k; list at $725k implies a 867% gain — meaningful room to come down on a strong offer.
Risks & watch-outs
- Watch-outs: built in 1906 — expect roof / HVAC / electrical / plumbing capex.
- Climate carrying-cost: major wind risk, 27% chance of damaging wind over 30y; extreme-heat days projected 7→17/yr by 2055 (HVAC capex compounding) — expect insurance premiums to compound above CPI over the hold.
Questions for the listing agent
- Can we see the unit-by-unit rent roll, current vacancy, and any below-market leases? What's the average tenancy length?
- What capital expenditures (roof, boiler, parking lot, exteriors) have been made in the last 5 years, and what's planned in the next 2?
- Built in 1906 — when were the roof, HVAC, electrical panel, plumbing, and water heater last replaced?
- Is there a deadline driving the sale (1031 exchange, divorce, estate, relocation)? That informs how much negotiation room exists.
- Schools are B-rated — typically a magnet for longer-tenancy family renters. What's the average tenant stay here, and is there a school-zone premium baked into asking?
- What's the average days-on-market for RENTAL listings here right now (not sales)? A rising rental-DOM trend means longer vacancies and softer asking-rent achievability than the comps imply.
- What's the recent tenant-quality profile in this submarket — average credit score on applications, eviction rate, late-payment / NSF rate, and stable-employment percentage? A property-management company in the area should have these aggregated.
- How much new apartment / multifamily construction is in the pipeline within 1–3 miles? Heavy new supply (>2% of stock underway) typically softens rents 12–24 months out; light construction supports rent growth.
Investment metrics
- 1% rule
- 1.07% ✓
- Cap rate
- 8.36%
- Cash-on-cash
- 7.37%
- DSCR
- 1.33
- GRM
- 7.8
CMA / ARV
- ARV (on-the-fly)
- $806,007
- Comps found
- 2
Show comp detail 2 sales within ~0.75 mi
| Address | Dist | Beds/Ba | Sqft | Sold | Price | $/sf | Match |
|---|---|---|---|---|---|---|---|
| 203 Center St | 0.28mi | 8/5.0 | 4,104 (-12%) | 4mo | $710,000 | $173 | 60 |
| 9 Church St | 0.49mi | 8/4.0 | 4,032 (-14%) | 1mo | $560,000 | $139 | 54 |
Match score weights: distance 35% · size 25% · config 20% · recency 20%. Top-matched comps best support the ARV.
Projected returns pro-forma
-3.0% appreciation · 1.97% rent growth · sell at horizon
- IRR
- -6.2%
- Equity multiple
- 0.77×
- Total profit
- $-45,974
- Equity at exit
- $108,100
- IRR
- 2.2%
- Equity multiple
- 1.15×
- Total profit
- $30,440
- Equity at exit
- $62,685
Cash invested: $203,000 (down + closing). Projections, not guarantees.
Landlord ↔ Tenant lean methodology
- Overall (STATE)
- 27 Tenant-Leaning
- State Connecticut
- 27 Tenant-Leaning · D+7
- County
- — inherits STATE
- City
- — inherits STATE
ZIP-level market 06040
- Rents YoY
- 2.0%
- Active inventory
- 99
- Price-to-rent
- 31.2×
Monthly cashflow live
- Estimated rent
- $7,737 high interval (Pro) →
- Mortgage (P&I)
- −$3,802
- Tax from tax record
- −$761 /mo · $9,135/yr
- Insurance
- −$302
- HOA
- −$0
- Vacancy / Maint / Mgmt
- −$1,625
- Net cashflow
- $1,247
Break-even live
4-unit breakdown (identical units grouped — click to expand)
| Units | Beds | Baths | Est. rent |
|---|---|---|---|
| 4× units | 2 | 1 | $7,736 |
| #1 | 2 | 1 | $1,934 |
| #2 | 2 | 1 | $1,934 |
| #3 | 2 | 1 | $1,934 |
| #4 | 2 | 1 | $1,934 |
| Total (4 units) | $7,737 | ||
UW: 25.0% down · 7.5% · 30yr · 1.5% tax · 5.0% vac · 8.0% maint · 8.0% mgmt
Financing live
Cash to close
- Down payment
- $181,250
- Closing costs
- $21,750
- Reserves months
- —
- Total cash needed
- —
Loan-product check · same deal, 3 products live
Conventional
25% down · 7.5% · 30yr
- Down + closing
- —
- Monthly P&I
- —
- Monthly cashflow
- —
- DSCR
- —
- Eligible?
- —
Personal DTI + credit; lowest rate.
DSCR
20% down · 8.5% · 30yr
- Down + closing
- —
- Monthly P&I
- —
- Monthly cashflow
- —
- DSCR
- —
- Eligible?
- —
No personal income docs; deal must DSCR.
Hard money
10% down · 12.0% · 12mo
- Down + closing
- —
- Monthly P&I
- —
- Monthly cashflow
- —
- DSCR
- —
- Eligible?
- —
Short-term bridge; refi at stabilization.
Listing history 6 events
-
2026-06-18days on market $725,000 Active 7 DOM
-
2026-06-17days on market $725,000 Active 6 DOM
-
2026-06-16days on market $725,000 Active 5 DOM
-
2026-06-15days on market $725,000 Active 4 DOM
-
2026-06-13remarks 699-char remark
-
2026-06-13$725,000 Active 2 DOM
ⓘ Source: listings_history table (triggers on properties + properties_extension) + one-shot
backfill from property_details.listing_events for pre-trigger history.
Tax reassessment forecast CT · Partial reset (capped growth)
- Current annual tax
- $9,135 · $761/mo
- Projected year-2 tax
- $12,325 · $1,027/mo
- Expected delta
- +$3,190/yr (+$266/mo · 34.9%)
ⓘ Screening estimate from a state-policy table — verify with the county assessor before closing.
Climate risk First Street
- Flood 1/10 Low FEMA zone X (unshaded) · 0% chance over 30 yrs
- Wildfire 2/10 Low
- Heat 5/10 Major 7 d/yr ≥95°F today · 17 d/yr by 30 yrs out
- Wind 6/10 Major 27% chance of damaging wind over 30 yrs
- Air quality 3/10 Moderate 3 unhealthy d/yr today · 4 by 30 yrs out
Nearby sold comps map
Loading sold comps map…
Walkable amenities ~0.75 mi
Loading nearby amenities…
Taxation est. · year 1
- Rental income
- $92,844
- − Mortgage interest
- −$40,611
- − Property taxes
- −$9,135
- − Insurance
- −$3,625
- − Repairs & maintenance
- −$7,428
- − Management
- −$7,428
- − Depreciation
- −$21,091
- Taxable income
- $3,527
- Est. tax owed @ 24.0%
- −$846
- After-tax cash flow
- $14,117/yr
For passive investors: Depreciation is non-cash, so a rental often shows a tax loss while cash-flowing — sheltering income. Rental losses are passive: they offset passive income freely, and up to $25,000/yr can offset ordinary (W-2) income if you actively participate and your MAGI is under $100k (phasing out to $0 by $150k); unused losses carry forward. On sale, claimed depreciation is recaptured at up to 25%, and gains may owe capital-gains tax (a 1031 exchange can defer both). Figures are a year-1 estimate at your 24.0% rate — not tax advice; consult a CPA.
Schools (NCES district)
- District
- Manchester School District
- NCES district ID
- 0902310
- Math proficiency
- 21% ▼ -8.00%
- Reading proficiency
- 32% ▼ -5.00%
- Median HH income
- $63,391
- Composite
- 24.54/100
- National rank
- #7643
- State rank
- #130 of 153 in CT
Livability — Manchester
- Score
- 76/100
- State rank
- #59
- US rank
- #3580
Category grades
Schools grade is shown separately in the Schools card above.
Census & demographics
- Census place
- Manchester, CT
- County
- Hartford County · 754,208 people
- City population
- 59,635
- Metro
- Hartford-East Hartford-Middletown, CT
- Population (ZIP)
- 35,813
- Household income
- $83,422
- Rent vs Own
- Severe rent burden
- 1839.0
Population outlook (Capitol County) Hauer SSP2
- By 2040
- 1,063,519
Race, ethnicity, and origin ACS 2023
- Neighborhood character
- Diverse neighborhood (Simpson 0.65)
- Race & ethnicity
- White 53% Hispanic / Latino 18% Black 15% Asian 9% Two or more races 8%
- Hispanic origin (detail)
- Puerto Rican 14%
- Common ancestry
- Romanian 5% Lithuanian 4% Slovak 1%
- Foreign-born
- 15% · Canada, Jamaica, China
- Languages at home
- 81% English-only · Spanish 8% Other Indo-European 5% Other Asian/Pacific 2%
Political lean MEDSL · Capitol
- 2024 margin
- Strong D (+21.9) · D 60.1% · R 38.2% · Other 1.7%
- All cycles
- 2024: D+21.9
Not yet ingested
- Civics
- —
Market trends
- HPI YoY
- ▼ -197.69%
- Current HPI
- 190.4204
- Rent YoY
- ▲ 1.97%
- Metro
- Hartford-East Hartford-Middletown, CT
- State GDP YoY
- ▲ 1.06%
- F500 in state
- 38
Industry mix (Fortune 500 HQ in CT)
| Industry | F500 HQs | Revenue |
|---|---|---|
| Industrial Machinery | 4 | $38B |
|
||
| Insurance | 3 | $71B |
|
||
| Financial Services | 2 | $25B |
|
||
| Transportation / Logistics | 2 | $18B |
|
||
| Healthcare | 1 | $247B |
|
||
| Telecommunications | 1 | $55B |
|
||
Price history
+866.7% since first listed5 events — show timeline
- 2026-06-11 Listed $725,000 Smart MLS
- 2026-04-06 Rental Removed $1,795 TURBOTENANT
- 2026-01-27 Listed for Rent $1,795 TURBOTENANT
- 2022-12-20 Rental Removed — TURBOTENANT
- 1999-12-21 Sold (Public Records) $75,000 Public Records
Property tax history
+2.7%/yrLatest (2025): $9,135 · +3.0% YoY. Source: county tax records.
Cash-flow waterfall
monthlySold comps — $/sqft
last 12 mo · ≤1 miLoading sold comps…