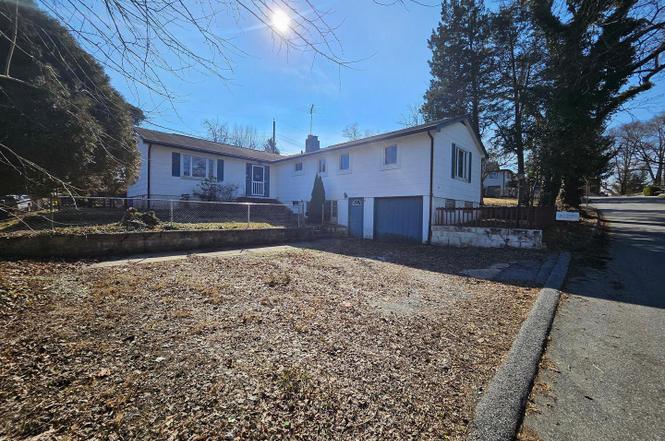
110 Woodside Rd · Riva, MD
Flood risk 1/10 · Minimal
- FEMA flood zone
- X (unshaded)
- Chance of flooding over 30 yrs
- 0.0%
- Est. flood insurance / yr
- $473 – $860
Fire risk 3/10 · Minor
- Est. fire insurance / yr
- $755 – $1,403
Heat risk 8/10 · Major
- Hot days now (above 104°F)
- 7 days/yr
- Hot days in 30 yrs
- 15 days/yr
Wind risk 6/10 · Moderate
- Chance of severe wind over 30 yrs
- 46.0%
Air-quality risk 4/10 · Minor
- Unhealthy air days now
- 4 days/yr
- Unhealthy air days in 30 yrs
- 6 days/yr
Risk factors via First Street. Map © Google.
Why this score? — see what drove the C- grade
The composite is a weighted blend of 9 inputs, each scored 0–100. Each bar is that input's sub-score; the figure is the points it added to the 100-point composite (weight × sub-score).
- Cash flow +15.4/30.0
- ARV discount +15.0/15.0
- DSCR +4.7/10.0
- 1% rule +4.1/10.0
- Livability +3.4/5.0
- Schools +2.9/10.0
- Rent growth +2.5/5.0
- Condition / age +2.5/5.0
- Appreciation +0.0/10.0
$350,000
🖨 Deal sheet (PDF) 📄 Offer letter ✓ Due diligence
Listing remarks
This is a Fannie Mae Homepath Foreclosure. Great house, offering so much space in a community in Riva. The entry foyer can lead you to the left additional living area with slider to the rear deck, or straight ahead to the door leading to the deck and kitchen or to the right leading to the open kitchen, living room and dining room combo. The combo of those 3 rooms leads to the primary hallway with full bath and bedroom. The right of the combo leads to the bedroom hallway with full bath, two more bedrooms and one with a sitting room. Yet wait, it also leads to the lower level offering yet again more space in a rec room with fireplace, half bath, utility room and garage access. The rear deck h
Key facts
- Entry foyer
- Living room
- Family room
Tags
Neighborhood map
What this means for you Summary
Snapshot
- This is a 3-bed/1.0-bath single-family listed at $350k.
Deal economics
- At list price, monthly cash flow is $136 ($2k/yr) — positive.
- The deal already cash-flows at list — no discount required.
- To meet the 1% rule (rent ≥ 1% of price), the offer needs to be $317k (9.3% below list).
- Recommended offer: $308k (12.0% below list) — sets the bar for market timing.
- Cap rate 6.8% vs local median 2.5% in Riva — top-decile yield for the area; either an underpriced asset or a hidden risk that comps aren't pricing in. Stress-test before assuming the spread holds.
Location & tenants
- Location reads 67/100 on livability (#214 in MD) — a middle-class / working-renter tenant base. Strengths: crime A+, employment A+, housing A+; Watch: health & safety C-, amenities F, commute F.
- Anne Arundel County Public Schools (suburban): math 20% / reading 37% proficiency, ranked #10 of 24 in MD (top 42%) — low school quality limits family demand, transient renter base, plan for 1-2y turnover.
- Zoned schools: Monarch Global Academy Pcs Laurel Campus (math 13% / reading 28%, grade F, #341 of 860 statewide, top 40%, 830 students, 53% FRL); Central Middle (math 20% / reading 53%, grade F, #37 of 225 statewide, top 17%, 1,299 students, 19% FRL); South River High (math 70% / reading 77%, grade B+, #30 of 222 statewide, top 14%, 1,649 students, 19% FRL).
- Zoned-school proficiency averages 44% at this address vs 28% district-wide (+15 pts) — the actual schools serving this property are materially stronger than the Anne Arundel County Public Schools average implies; a family-tenant draw the district grade alone would hide.
- Market conditions: 15 active listings in the ZIP; 3 comparable units currently listed for rent nearby; rentals lingering (median 46d on market — plan ~5-8 weeks vacancy on turnover, expect pricing pressure); 67% of comp listings sitting > 30 days — soft ceiling on asking rent; 1,303 units permitted in Anne Arundel County in 2024 (299 in 5+ unit buildings).
Forward outlook
- Local home prices are declining (-3.0%/yr); year-one equity from $2k of loan paydown is wiped out by about $10k of value loss. Plan a longer hold.
- Anne Arundel County population projected at +17% by 2050 — long-run rental-demand tailwind backs the buy-and-hold thesis.
Negotiation context
- It's been on market 358 days — a 12% lower offer ($308k) is reasonable based on typical stale-listing flexibility.
- 2 sale attempts; this cycle's ask has dropped $55k (14%) from the opening price — seller is motivated, your offer sets the floor, not the list.
Risks & watch-outs
- Watch-outs: built in 1950 — expect roof / HVAC / electrical / plumbing capex.
- Climate carrying-cost: major wind risk, 46% chance of damaging wind over 30y; extreme-heat days projected 7→15/yr by 2055 (HVAC capex compounding) — expect insurance premiums to compound above CPI over the hold.
Questions for the listing agent
- It's been on market 358 days. Have you received any prior offers? Is the seller open to a 12% concession, seller financing, or rate buy-down credit?
- Built in 1950 — when were the roof, HVAC, electrical panel, plumbing, and water heater last replaced?
- Why hasn't it sold? Are there any deal-killer items the seller is aware of (foundation, flood, title, zoning, code violations)?
- Is there a deadline driving the sale (1031 exchange, divorce, estate, relocation)? That informs how much negotiation room exists.
- Schools are D-rated, which usually means shorter tenancies and higher turnover. Who's the typical renter profile here, and what's been the actual vacancy rate?
- What's the average days-on-market for RENTAL listings here right now (not sales)? A rising rental-DOM trend means longer vacancies and softer asking-rent achievability than the comps imply.
- What's the recent tenant-quality profile in this submarket — average credit score on applications, eviction rate, late-payment / NSF rate, and stable-employment percentage? A property-management company in the area should have these aggregated.
- How much new for-sale + rental construction is in the pipeline within 1–3 miles? Heavy new supply typically softens prices + rents 12–24 months out; constrained supply supports both.
Investment metrics
- 1% rule
- 0.91% ✗
- Cap rate
- 6.76%
- Cash-on-cash
- 1.66%
- DSCR
- 1.07
- GRM
- 9.2
CMA / ARV
- ARV (on-the-fly)
- $566,352
- Comps found
- 12
Show comp detail 12 sales within ~0.75 mi
| Address | Dist | Beds/Ba | Sqft | Sold | Price | $/sf | Match |
|---|---|---|---|---|---|---|---|
| 3057 Perch Dr | 0.12mi | 3/2.0 | 1,600 (-8%) | 6mo | $605,000 | $378 | 71 |
| 1 Elm Rd | 0.03mi | 4/2.0 (+1) | 1,610 (-8%) | 22mo | $503,000 | $312 | 58 |
| 3006 Bass Pl | 0.29mi | 3/3.0 | 1,880 (+8%) | 13mo | $610,000 | $324 | 55 |
| 3029 Rock Dr | 0.19mi | 4/2.0 (+1) | 1,880 (+8%) | 18mo | $532,000 | $283 | 55 |
| 501 Forest Rd | 0.16mi | 4/2.0 (+1) | 1,628 (-7%) | 21mo | $468,000 | $287 | 54 |
| 2709 Parkview Dr | 0.63mi | 3/3.0 | 1,800 (+3%) | 5mo | $575,000 | $319 | 54 |
| 3060 Perch Dr | 0.15mi | 4/2.0 (+1) | 1,880 (+8%) | 22mo | $547,000 | $291 | 53 |
| 511 Forest Rd | 0.22mi | 3/2.0 | 1,553 (-11%) | 23mo | $452,600 | $291 | 48 |
| 2946 Edgewater Dr | 0.75mi | 4/2.0 (+1) | 1,795 (+3%) | 6mo | $850,000 | $474 | 47 |
| 2913 Southaven Dr | 0.58mi | 4/3.0 (+1) | 1,562 (-11%) | 2mo | $538,000 | $344 | 40 |
| 3030 Edgewater Dr | 0.69mi | 3/2.0 | 1,511 (-14%) | 8mo | $830,000 | $549 | 35 |
| 2760 Riverview Dr | 0.68mi | 3/2.0 | 1,540 (-12%) | 16mo | $575,000 | $373 | 31 |
Match score weights: distance 35% · size 25% · config 20% · recency 20%. Top-matched comps best support the ARV.
Projected returns pro-forma
-3.0% appreciation · 3.0% rent growth · sell at horizon
- IRR
- -13.6%
- Equity multiple
- 0.51×
- Total profit
- $-48,048
- Equity at exit
- $52,186
- IRR
- -4.8%
- Equity multiple
- 0.69×
- Total profit
- $-30,628
- Equity at exit
- $30,262
Cash invested: $98,000 (down + closing). Projections, not guarantees.
Landlord ↔ Tenant lean methodology
- Overall (STATE)
- 27 Tenant-Leaning
- State Maryland
- 27 Tenant-Leaning · D+14
- County
- — inherits STATE
- City
- — inherits STATE
ZIP-level market 21140
- Home prices YoY
- -33.7%
- Active inventory
- 15
- Price-to-rent
- 9.2×
Monthly cashflow live
- Estimated rent
- $3,174 medium interval (Pro) →
- Mortgage (P&I)
- −$1,835
- Tax from tax record
- −$390 /mo · $4,681/yr
- Insurance
- −$146
- HOA
- −$0
- Vacancy / Maint / Mgmt
- −$666
- Net cashflow
- $136
Break-even live
Sensitivity live
| Price | -10% $334 | -5% $235 | +0% $136 | +5% $37 | +10% $-62 |
|---|---|---|---|---|---|
| Rent | -10% $-115 | -5% $10 | +0% $136 | +5% $261 | +10% $386 |
| Rate | -1.0pp $312 | -0.5pp $225 | base $136 | +0.5pp $45 | +1.0pp $-47 |
UW: 25.0% down · 7.5% · 30yr · 1.5% tax · 5.0% vac · 8.0% maint · 8.0% mgmt
Financing live
Cash to close
- Down payment
- $87,500
- Closing costs
- $10,500
- Reserves months
- —
- Total cash needed
- —
Loan-product check · same deal, 3 products live
Conventional
25% down · 7.5% · 30yr
- Down + closing
- —
- Monthly P&I
- —
- Monthly cashflow
- —
- DSCR
- —
- Eligible?
- —
Personal DTI + credit; lowest rate.
DSCR
20% down · 8.5% · 30yr
- Down + closing
- —
- Monthly P&I
- —
- Monthly cashflow
- —
- DSCR
- —
- Eligible?
- —
No personal income docs; deal must DSCR.
Hard money
10% down · 12.0% · 12mo
- Down + closing
- —
- Monthly P&I
- —
- Monthly cashflow
- —
- DSCR
- —
- Eligible?
- —
Short-term bridge; refi at stabilization.
Rent comps 3 comps
| Address | Beds | Baths | Sqft | Rent | $/sqft | DOM | Units | Dist |
|---|---|---|---|---|---|---|---|---|
| 17 Elm Rd Riva, MD | 3.0 | 2.0 | 1193 | $3,000 | $2.51 | 45d | 1 | 0.06mi |
| 3025 Rock Dr Riva, MD | 3.0 | 2.0 | 2096 | $3,350 | $1.60 | 45d | 1 | 0.19mi |
| 2729 Poplar Ln Annapolis, MD | 4.0 | 2.5 | 2150 | $3,750 | $1.74 | 25d | 1 | 1.18mi |
Listing history 7 events
-
2026-02-23status Pending
-
2026-01-17price $350,000
-
2025-12-05price $365,000
-
2025-10-16price $389,000
-
2025-04-13status Active
-
2025-04-11status Pending
-
2025-02-28$405,000 Active
ⓘ Source: listings_history table (triggers on properties + properties_extension) + one-shot
backfill from property_details.listing_events for pre-trigger history.
Tax reassessment forecast MD · Partial reset (capped growth)
- Current annual tax
- $4,681 · $390/mo
- Projected year-2 tax
- $4,681 · $390/mo
- Expected delta
- $0/yr ($0/mo · 0.0%)
ⓘ Screening estimate from a state-policy table — verify with the county assessor before closing.
Climate risk First Street
- Flood 1/10 Low FEMA zone X (unshaded) · 0% chance over 30 yrs
- Wildfire 3/10 Moderate
- Heat 8/10 Severe 7 d/yr ≥104°F today · 15 d/yr by 30 yrs out
- Wind 6/10 Major 46% chance of damaging wind over 30 yrs
- Air quality 4/10 Moderate 4 unhealthy d/yr today · 6 by 30 yrs out
Nearby sold comps map
Loading sold comps map…
Walkable amenities ~0.75 mi
Loading nearby amenities…
Taxation est. · year 1
- Rental income
- $38,083
- − Mortgage interest
- −$19,605
- − Property taxes
- −$4,681
- − Insurance
- −$1,750
- − Repairs & maintenance
- −$3,047
- − Management
- −$3,047
- − Depreciation
- −$10,182
- Taxable loss
- −$4,229
- Est. tax savings @ 24.0%
- +$1,015
- After-tax cash flow
- $2,644/yr
For passive investors: Depreciation is non-cash, so a rental often shows a tax loss while cash-flowing — sheltering income. Rental losses are passive: they offset passive income freely, and up to $25,000/yr can offset ordinary (W-2) income if you actively participate and your MAGI is under $100k (phasing out to $0 by $150k); unused losses carry forward. On sale, claimed depreciation is recaptured at up to 25%, and gains may owe capital-gains tax (a 1031 exchange can defer both). Figures are a year-1 estimate at your 24.0% rate — not tax advice; consult a CPA.
Schools (NCES district)
- District
- Anne Arundel County Public Schools
- NCES district ID
- 2400060
- Math proficiency
- 20% ▼ -21.00%
- Reading proficiency
- 37% ▼ -13.00%
- Median HH income
- $87,880
- Composite
- 28.52/100
- National rank
- #6733
- State rank
- #10 of 24 in MD
Livability — Riva
- Score
- 67/100
- State rank
- #214
- US rank
- #10466
Category grades
Schools grade is shown separately in the Schools card above.
Census & demographics
- Census place
- Riva, MD
- City population
- 4,231
- Population (ZIP)
- 4,231
Population outlook (Anne Arundel County) Hauer SSP2
- Today (2025)
- 617,384 people
- By 2030
- 642,094 · +4.0%
- By 2040
- 686,621 · +11.2%
- By 2050
- 723,031 · +17.1%
- By 2075
- 809,346 · +31.1%
- By 2100
- 837,658 · +35.7%
Race, ethnicity, and origin ACS 2023
- Neighborhood character
- Predominantly White (87%)
- Race & ethnicity
- White 87% Hispanic / Latino 8% Two or more races 5%
- Hispanic origin (detail)
- Mexican 2% Puerto Rican 2% Cuban 1%
- Common ancestry
- Scotch-Irish 4% Romanian 3% Slovak 3%
- Foreign-born
- 4% · Canada
- Languages at home
- 95% English-only · Spanish 2% Russian/Polish/Slavic 1% Other Indo-European 1%
Political lean MEDSL · Anne Arundel
- 2024 margin
- D (+13.9) · D 55.7% · R 41.7% · Other 2.6%
- 2008→2024 swing
- +15.7pp toward D · 2008: -1.8pp · 2024: 13.9pp
- All cycles
- 2024: D+13.9 2020: D+14.5 2016: D+0.7 2012: R+0.9 2008: R+1.8
Not yet ingested
- Civics
- —
Market trends
- HPI YoY
- ▼ -137.05%
- Current HPI
- 270.1535
- Rent YoY
- —
- Metro
- —
- State GDP YoY
- ▲ 2.97%
- F500 in state
- 12
Industry mix (Fortune 500 HQ in MD)
| Industry | F500 HQs | Revenue |
|---|---|---|
| Aerospace / Defense | 1 | $71B |
|
||
| Utilities | 1 | $25B |
|
||
| Hotels | 1 | $24B |
|
||
| Consumer Goods | 1 | $7B |
|
||
| Real Estate | 1 | $6B |
|
||
| Chemicals | 1 | $2B |
|
||
Price history
-13.6% since first listed7 events — show timeline
- 2026-02-23 Pending — BRIGHT MLS
- 2026-01-17 Price Changed $350,000 BRIGHT MLS
- 2025-12-05 Price Changed $365,000 BRIGHT MLS
- 2025-10-16 Price Changed $389,000 BRIGHT MLS
- 2025-04-13 Relisted — BRIGHT MLS
- 2025-04-11 Pending — BRIGHT MLS
- 2025-02-28 Listed $405,000 BRIGHT MLS
Property tax history
+8.0%/yrLatest (2025): $4,681 · +43.0% YoY. Source: county tax records.
Cash-flow waterfall
monthlySold comps — $/sqft
last 12 mo · ≤1 miLoading sold comps…