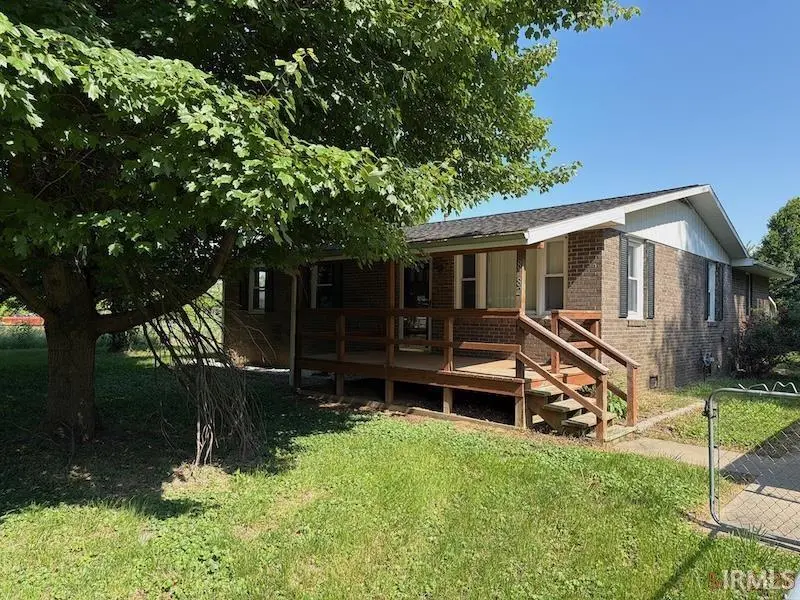
8782 W Middleton St · Hatfield, IN
Flood risk No data
- FEMA flood zone
- —
- Chance of flooding over 30 yrs
- —
- Est. flood insurance / yr
- —
Fire risk No data
- Est. fire insurance / yr
- —
Heat risk No data
- Hot days now (above threshold)
- —
- Hot days in 30 yrs
- —
Wind risk No data
- Chance of severe wind over 30 yrs
- —
Air-quality risk No data
- Unhealthy air days now
- —
- Unhealthy air days in 30 yrs
- —
Risk factors via First Street. Map © Google.
Why this score? — see what drove the A- grade
The composite is a weighted blend of 9 inputs, each scored 0–100. Each bar is that input's sub-score; the figure is the points it added to the 100-point composite (weight × sub-score).
- Cash flow +30.0/30.0
- ARV discount +15.0/15.0
- DSCR +10.0/10.0
- 1% rule +9.5/10.0
- Appreciation +6.2/10.0
- Schools +4.2/10.0
- Livability +3.2/5.0
- Rent growth +2.5/5.0
- Condition / age +2.5/5.0
$100,000
🖨 Deal sheet (PDF) 📄 Offer letter ✓ Due diligence
Listing remarks
3 bedroom BRICK home with so many extras! 2 car detached garage with attached 2 car carport and an EXTRA 2 car detached carport! Deck overlooking the fenced back yard with shed for extra storage. Inside, you'll find an oversized family room that has a multitude of uses, a separate laundry room, and a galley kitchen with dining area. Just add your finishing touches!
Key facts
- Attached carport
- Detached carport
- Fenced back yard
Tags
Property features AI
Exterior
- Parking: Detached 2-car garage
- Utilities: Public water; Public sewer
- Home design: Single-family residence (site-built); One-story; Residential property
- Construction: Brick construction
- Exterior features: Covered porch; Deck; Porch; Chain link fencing; Shed(s) on the property; Level lot
Interior
- Bedrooms: Bedrooms located on main level
- Bathrooms: One full bathroom on the main level
- Heating & cooling: Natural gas forced air heating; Central air conditioning
- Interior features: Crawl space basement; Total of 8 rooms
- Laundry & utility: Laundry on the main level
Neighborhood map
What this means for you Summary
Snapshot
- This is a 3-bed/1.0-bath single-family listed at $100k.
Deal economics
- At list price, monthly cash flow is $530 ($6k/yr) — positive.
- The deal already cash-flows at list — no discount required.
- Meets the 1% rule at list price ($1k rent vs $100k).
Location & tenants
- Location reads 63/100 on livability (#438 in IN) — a middle-class / working-renter tenant base. Strengths: cost of living A+, housing A+, employment A; Watch: crime C-, amenities F, commute F.
- South Spencer County School Corporation (rural): math 46% / reading 54% proficiency, ranked #58 of 301 in IN (top 19%) — acceptable for families but not a draw, mixed tenant base, ~2y average lease.
- Zoned schools: Luce Elementary School (math 57% / reading 47%, grade C-, #237 of 994 statewide, top 26%, 189 students, 38% FRL); South Spencer Middle School (math 39% / reading 52%, grade D+, #79 of 330 statewide, top 24%, 228 students, 56% FRL); South Spencer High School (math 47% / reading 67%, grade C, #64 of 369 statewide, top 18%, 357 students, 44% FRL).
- Market conditions: 42 active listings in the ZIP; 78 units permitted in Spencer County in 2024 (0 in 5+ unit buildings).
Forward outlook
- In year one you build about $3k of equity ($691 loan paydown + $2k appreciation (2.3% local appreciation)).
- Spencer County population projected at -16% by 2050 — secular population decline; favor cash flow + early exit over multi-decade hold.
- At projected returns (2.3% appreciation + 3.0% rent growth), your $28k cash investment doubles in ~3 years — after that, you're playing with house money.
Negotiation context
- Only 12 days on market — expect competitive offers; lowballing is unlikely to land.
Questions for the listing agent
- Built in 1978 — when were the roof, HVAC, electrical panel, plumbing, and water heater last replaced?
- Is there a deadline driving the sale (1031 exchange, divorce, estate, relocation)? That informs how much negotiation room exists.
- Schools are F-rated, which usually means shorter tenancies and higher turnover. Who's the typical renter profile here, and what's been the actual vacancy rate?
- What's the average days-on-market for RENTAL listings here right now (not sales)? A rising rental-DOM trend means longer vacancies and softer asking-rent achievability than the comps imply.
- What's the recent tenant-quality profile in this submarket — average credit score on applications, eviction rate, late-payment / NSF rate, and stable-employment percentage? A property-management company in the area should have these aggregated.
- How much new for-sale + rental construction is in the pipeline within 1–3 miles? Heavy new supply typically softens prices + rents 12–24 months out; constrained supply supports both.
Investment metrics
- 1% rule
- 1.45% ✓
- Cap rate
- 12.65%
- Cash-on-cash
- 22.70%
- DSCR
- 2.01
- GRM
- 5.8
CMA / ARV
- ARV (on-the-fly)
- $154,089
- Comps found
- 3
Show comp detail 3 sales within ~0.75 mi
| Address | Dist | Beds/Ba | Sqft | Sold | Price | $/sf | Match |
|---|---|---|---|---|---|---|---|
| 1146 N Green Acres St | 0.17mi | 3/1.5 | 1,387 (+5%) | 21mo | $150,000 | $108 | 64 |
| 1148 N County Road 900 W | 0.26mi | 2/2.0 (-1) | 1,216 (-8%) | 12mo | $142,000 | $117 | 56 |
| 9403 W County Road 100 Rd N | 0.67mi | 2/1.0 (-1) | 1,182 (-10%) | 20mo | $150,000 | $127 | 30 |
Match score weights: distance 35% · size 25% · config 20% · recency 20%. Top-matched comps best support the ARV.
Projected returns pro-forma
2.31% appreciation · 3.0% rent growth · sell at horizon
- IRR
- 27.5%
- Equity multiple
- 2.51×
- Total profit
- $42,156
- Equity at exit
- $41,132
- IRR
- 28.7%
- Equity multiple
- 4.83×
- Total profit
- $107,376
- Equity at exit
- $60,557
Cash invested: $28,000 (down + closing). Projections, not guarantees.
Landlord ↔ Tenant lean methodology
- Overall (STATE)
- 90 Strongly Landlord-Friendly
- State Indiana
- 90 Strongly Landlord-Friendly · R+11
- County
- — inherits STATE
- City
- — inherits STATE
ZIP-level market 47634
- Home prices YoY
- 1.1%
- Active inventory
- 42
- Price-to-rent
- 5.8×
Monthly cashflow live
- Estimated rent
- $1,445 medium interval (Pro) →
- Mortgage (P&I)
- −$524
- Tax from tax record
- −$46 /mo · $550/yr
- Insurance
- −$42
- HOA
- −$0
- Vacancy / Maint / Mgmt
- −$303
- Net cashflow
- $530
Break-even live
Sensitivity live
| Price | -10% $586 | -5% $558 | +0% $530 | +5% $501 | +10% $473 |
|---|---|---|---|---|---|
| Rent | -10% $416 | -5% $473 | +0% $530 | +5% $587 | +10% $644 |
| Rate | -1.0pp $580 | -0.5pp $555 | base $530 | +0.5pp $504 | +1.0pp $477 |
UW: 25.0% down · 7.5% · 30yr · 1.5% tax · 5.0% vac · 8.0% maint · 8.0% mgmt
Financing live
Cash to close
- Down payment
- $25,000
- Closing costs
- $3,000
- Reserves months
- —
- Total cash needed
- —
Loan-product check · same deal, 3 products live
Conventional
25% down · 7.5% · 30yr
- Down + closing
- —
- Monthly P&I
- —
- Monthly cashflow
- —
- DSCR
- —
- Eligible?
- —
Personal DTI + credit; lowest rate.
DSCR
20% down · 8.5% · 30yr
- Down + closing
- —
- Monthly P&I
- —
- Monthly cashflow
- —
- DSCR
- —
- Eligible?
- —
No personal income docs; deal must DSCR.
Hard money
10% down · 12.0% · 12mo
- Down + closing
- —
- Monthly P&I
- —
- Monthly cashflow
- —
- DSCR
- —
- Eligible?
- —
Short-term bridge; refi at stabilization.
Listing history 9 events
-
2026-06-22days on market $100,000 Active 12 DOM
-
2026-06-18days on market $100,000 Active 9 DOM
-
2026-06-17days on market $100,000 Active 8 DOM
-
2026-06-16days on market $100,000 Active 7 DOM
-
2026-06-15days on market $100,000 Active 6 DOM
-
2026-06-14days on market $100,000 Active 4 DOM
-
2026-06-13days on market $100,000 Active 3 DOM
-
2026-06-10remarks 367-char remark
-
2026-06-10$100,000 Active 1 DOM
ⓘ Source: listings_history table (triggers on properties + properties_extension) + one-shot
backfill from property_details.listing_events for pre-trigger history.
Tax reassessment forecast IN · Partial reset (capped growth)
- Current annual tax
- $550 · $46/mo
- Projected year-2 tax
- $700 · $58/mo
- Expected delta
- +$150/yr (+$12/mo · 27.2%)
ⓘ Screening estimate from a state-policy table — verify with the county assessor before closing.
Nearby sold comps map
Loading sold comps map…
Walkable amenities ~0.75 mi
Loading nearby amenities…
Taxation est. · year 1
- Rental income
- $17,342
- − Mortgage interest
- −$5,602
- − Property taxes
- −$550
- − Insurance
- −$500
- − Repairs & maintenance
- −$1,387
- − Management
- −$1,387
- − Depreciation
- −$2,909
- Taxable income
- $5,006
- Est. tax owed @ 24.0%
- −$1,201
- After-tax cash flow
- $5,155/yr
For passive investors: Depreciation is non-cash, so a rental often shows a tax loss while cash-flowing — sheltering income. Rental losses are passive: they offset passive income freely, and up to $25,000/yr can offset ordinary (W-2) income if you actively participate and your MAGI is under $100k (phasing out to $0 by $150k); unused losses carry forward. On sale, claimed depreciation is recaptured at up to 25%, and gains may owe capital-gains tax (a 1031 exchange can defer both). Figures are a year-1 estimate at your 24.0% rate — not tax advice; consult a CPA.
Schools (NCES district)
- District
- South Spencer County School Corporation
- NCES district ID
- 1810560
- Math proficiency
- 46% ▼ -6.00%
- Reading proficiency
- 54% ▼ -2.00%
- Median HH income
- $47,220
- Composite
- 42.49/100
- National rank
- #3208
- State rank
- #58 of 301 in IN
Livability — Hatfield
- Score
- 63/100
- State rank
- #438
- US rank
- #15721
Category grades
Schools grade is shown separately in the Schools card above.
Census & demographics
- Census place
- Hatfield, IN
- Population (ZIP)
- 2,101
Population outlook (Spencer County) Hauer SSP2
- Today (2025)
- 20,394 people
- By 2030
- 19,912 · -2.4%
- By 2040
- 18,592 · -8.8%
- By 2050
- 17,051 · -16.4%
- By 2075
- 14,010 · -31.3%
- By 2100
- 10,869 · -46.7%
Race, ethnicity, and origin ACS 2023
- Neighborhood character
- Predominantly White (94%)
- Race & ethnicity
- White 94% Two or more races 6% Hispanic / Latino 3%
- Common ancestry
- Lithuanian 4% Romanian 2% English 2%
- Foreign-born
- 3% · Canada
- Languages at home
- 97% English-only · French/Haitian/Cajun 1% Spanish 1%
Political lean MEDSL · Spencer
- 2024 margin
- Solid R (+43.3) · D 27.4% · R 70.6% · Other 2.0%
- 2008→2024 swing
- -43.6pp toward R · 2008: 0.4pp · 2024: -43.3pp
- All cycles
- 2024: R+43.3 2020: R+38.5 2016: R+37.3 2012: R+15.3 2008: D+0.4
Not yet ingested
- Civics
- —
Market trends
- HPI YoY
- ▲ 2.31%
- Current HPI
- 210.8511
- Rent YoY
- —
- Metro
- —
- State GDP YoY
- ▲ 2.90%
- F500 in state
- 18
Industry mix (Fortune 500 HQ in IN)
| Industry | F500 HQs | Revenue |
|---|---|---|
| Industrial Machinery | 2 | $37B |
|
||
| Healthcare | 1 | $177B |
|
||
| Pharmaceuticals | 1 | $45B |
|
||
| Metals / Steel | 1 | $18B |
|
||
| Agriculture | 1 | $17B |
|
||
| Packaging | 1 | $12B |
|
||
Price history
1 event — show timeline
- 2026-06-09 Listed $100,000 IRMLS
Property tax history
+3.9%/yrLatest (2023): $550 · +12.5% YoY. Source: county tax records.
Cash-flow waterfall
monthlySold comps — $/sqft
last 12 mo · ≤1 miLoading sold comps…