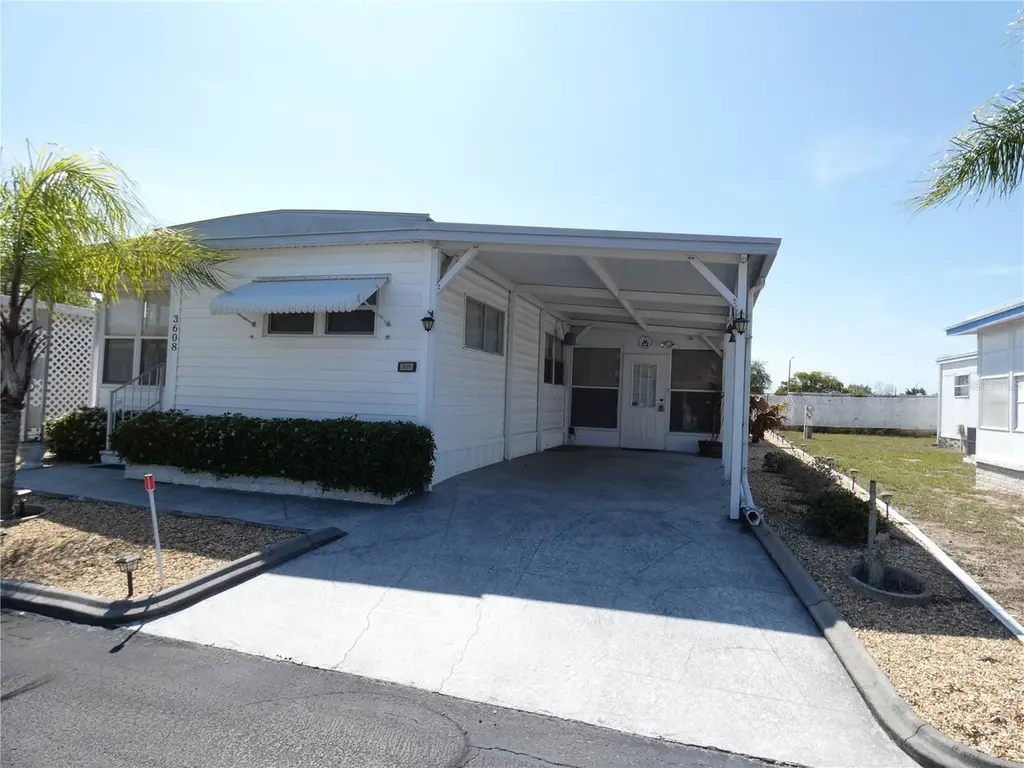
3608 Tiki Dr · Holiday, FL
Flood risk 4/10 · Minor
- FEMA flood zone
- X (unshaded)
- Chance of flooding over 30 yrs
- 0.13%
- Est. flood insurance / yr
- $507 – $1,088
Fire risk 3/10 · Minor
- Est. fire insurance / yr
- $947 – $1,759
Heat risk 10/10 · Severe
- Hot days now (above 109°F)
- 7 days/yr
- Hot days in 30 yrs
- 27 days/yr
Wind risk 10/10 · Severe
- Chance of severe wind over 30 yrs
- 99.0%
Air-quality risk 3/10 · Minor
- Unhealthy air days now
- 3 days/yr
- Unhealthy air days in 30 yrs
- 3 days/yr
Risk factors via First Street. Map © Google.
Why this score? — see what drove the B grade
The composite is a weighted blend of 9 inputs, each scored 0–100. Each bar is that input's sub-score; the figure is the points it added to the 100-point composite (weight × sub-score).
- Cash flow +29.5/30.0
- ARV discount +12.2/15.0
- DSCR +10.0/10.0
- 1% rule +8.7/10.0
- Schools +4.3/10.0
- Livability +3.3/5.0
- Rent growth +3.0/5.0
- Condition / age +2.5/5.0
- Appreciation +0.0/10.0
$105,200
🖨 Deal sheet 📄 Offer letter ✓ Due diligence
Listing remarks
Affordable Florida living. (You Own the Land) (No Lot Rent Here) in an established 55+ gated community, this two-bedroom home offers a strong opportunity for seasonal residents or budget-conscious buyers. The property features a functional single-story layout with 2 bedrooms & 2 bathrooms, no carpet throughout, Two Solid Sheds on the Property and additional flexible spaces including a sewing area, workshop, office area, and a bonus room, making it ideal for hobbies, storage, or working from home. The home includes a durable metal roof, adding long-term value and peace of mind. Per the county, this property is located in a non-flood zone, which may help reduce insurance costs and prov
Key facts
- Gated community
- Single-story layout
- No carpet
Tags
Property features AI
Finance
- Other: Lease restrictions apply
- Financial info: Total monthly fees $33; Total annual fees $396
- HOA & community: Association: Tiki Village Office; Association approval required; Monthly condo/association fee $33; Buyer approval required; Golf carts allowed; Street lights; Senior community; Cats and dogs allowed
Exterior
- Parking: Carport; 2 carport spaces
- Utilities: Public water; Private sewer; Broadband/high-speed internet available; Cable connected; Electricity connected; Sewer connected; Underground utilities; Water connected
- Home design: Residential mobile home (single wide); Attached; Completed condition; One story; Faces north
- Construction: Metal frame construction; Other roof type; Crawlspace foundation; Built in 1 story (single level)
- Exterior features: Side porch; Awnings; Exterior lighting; Storage; Shed(s)
Interior
- Kitchen: Cooktop; Range; Range hood; Refrigerator
- Bedrooms: 2 bedrooms
- Flooring: Carpet; Tile; Other
- Bathrooms: 2 full bathrooms
- Heating & cooling: Central heating; Central air conditioning
- Interior features: Built-in features; Ceiling fans; Eat-in kitchen; Thermostat; Walk-in closet(s)
- Laundry & utility: Laundry room
Neighborhood map
What this means for you Summary
Snapshot
- This is a 2-bed/2.0-bath manufactured listed at $105k.
Deal economics
- At list price, monthly cash flow is $377 ($5k/yr) — positive.
- The deal already cash-flows at list — no discount required.
- Meets the 1% rule at list price ($1k rent vs $105k).
- Recommended offer: $96k (9.0% below list) — sets the bar for market timing.
- Cap rate 10.6% vs local median 4.7% in Holiday — top-decile yield for the area; either an underpriced asset or a hidden risk that comps aren't pricing in. Stress-test before assuming the spread holds.
Location & tenants
- Location reads 66/100 on livability (#623 in FL) — a middle-class / working-renter tenant base. Strengths: cost of living A+, housing A+, health & safety B; Watch: crime D+, schools D, amenities F.
- Pasco (suburban): math 50% / reading 52% proficiency, ranked #32 of 73 in FL (top 44%) — acceptable for families but not a draw, mixed tenant base, ~2y average lease.
- Market conditions: Rents rising (+2.0%/yr); 324 active listings in the ZIP; 9 comparable units currently listed for rent nearby; rentals at typical pace (median 15d on market — plan ~3-4 weeks tenant-placement turnaround); 6,765 units permitted in Pasco County in 2024 (1,250 in 5+ unit buildings).
- This rent runs 34% of the median local income ($50k/yr) — at the standard rent-burdened threshold; future hikes will face affordability resistance.
Forward outlook
- Local home prices are declining (-3.0%/yr); year-one equity from $727 of loan paydown is wiped out by about $3k of value loss. Plan a longer hold.
- Pasco County population projected at +29% by 2050 — long-run rental-demand tailwind backs the buy-and-hold thesis.
- At projected returns (-3.0% appreciation + 2.0% rent growth), your $29k cash investment doubles in ~9 years — after that, you're playing with house money.
Negotiation context
- It's been on market 93 days — a 9% lower offer ($96k) is reasonable based on typical stale-listing flexibility.
- Current owner paid $20k; list at $105k implies a 426% gain — meaningful room to come down on a strong offer.
Risks & watch-outs
- Climate carrying-cost: severe wind risk, 99% chance of damaging wind over 30y; extreme-heat days projected 7→27/yr by 2055 (HVAC capex compounding) — expect insurance premiums to compound above CPI over the hold.
Questions for the listing agent
- It's been on market 93 days. Have you received any prior offers? Is the seller open to a 9% concession, seller financing, or rate buy-down credit?
- Built in 1973 — when were the roof, HVAC, electrical panel, plumbing, and water heater last replaced?
- What does the HOA fee cover, when was the last increase, and are there any pending special assessments or reserve-fund shortfalls?
- Why hasn't it sold? Are there any deal-killer items the seller is aware of (foundation, flood, title, zoning, code violations)?
- Is there a deadline driving the sale (1031 exchange, divorce, estate, relocation)? That informs how much negotiation room exists.
- Schools are D-rated, which usually means shorter tenancies and higher turnover. Who's the typical renter profile here, and what's been the actual vacancy rate?
- Crime grade is D in this area — have there been break-ins, vandalism, or insurance claims at this property in the last 3 years? What carrier currently insures it and at what premium?
- What's the average days-on-market for RENTAL listings here right now (not sales)? A rising rental-DOM trend means longer vacancies and softer asking-rent achievability than the comps imply.
- What's the recent tenant-quality profile in this submarket — average credit score on applications, eviction rate, late-payment / NSF rate, and stable-employment percentage? A property-management company in the area should have these aggregated.
- How much new for-sale + rental construction is in the pipeline within 1–3 miles? Heavy new supply typically softens prices + rents 12–24 months out; constrained supply supports both.
Investment metrics
- 1% rule
- 1.37% ✓
- Cap rate
- 10.59%
- Cash-on-cash
- 15.36%
- DSCR
- 1.68
- GRM
- 6.1
CMA / ARV
- ARV (on-the-fly)
- $117,360
- Comps found
- 2
Show comp detail 2 sales within ~0.75 mi
| Address | Dist | Beds/Ba | Sqft | Sold | Price | $/sf | Match |
|---|---|---|---|---|---|---|---|
| 3707 Tiki Dr | 0.10mi | 2/1.0 | 784 (+9%) | 2mo | $80,000 | $102 | 75 |
| 2108 Hoyle Dr | 0.74mi | 2/2.0 | 736 (+2%) | 14mo | $120,000 | $163 | 50 |
Match score weights: distance 35% · size 25% · config 20% · recency 20%. Top-matched comps best support the ARV.
Projected returns pro-forma
-3.0% appreciation · 2.05% rent growth · sell at horizon
- IRR
- 5.0%
- Equity multiple
- 1.19×
- Total profit
- $5,644
- Equity at exit
- $15,686
- IRR
- 13.6%
- Equity multiple
- 2.04×
- Total profit
- $30,518
- Equity at exit
- $9,096
Cash invested: $29,456 (down + closing). Projections, not guarantees.
Landlord ↔ Tenant lean methodology
- Overall (STATE)
- 87 Strongly Landlord-Friendly
- State Florida
- 87 Strongly Landlord-Friendly · R+3
- County
- — inherits STATE
- City
- — inherits STATE
ZIP-level market 34691
- Home prices YoY
- -23.9%
- Rents YoY
- 2.0%
- Active inventory
- 324
- Price-to-rent
- 6.1×
Monthly cashflow live
- Estimated rent
- $1,439 high interval (Pro) →
- Mortgage (P&I)
- −$552
- Tax est. 1.5%
- −$132 /mo · $1,578/yr
- Insurance
- −$44
- HOA
- −$33
- Vacancy / Maint / Mgmt
- −$302
- Net cashflow
- $377
Break-even live
UW: 25.0% down · 7.5% · 30yr · 1.5% tax · 5.0% vac · 8.0% maint · 8.0% mgmt
Financing live
Cash to close
- Down payment
- $26,300
- Closing costs
- $3,156
- Reserves months
- —
- Total cash needed
- —
Loan-product check · same deal, 3 products live
Conventional
25% down · 7.5% · 30yr
- Down + closing
- —
- Monthly P&I
- —
- Monthly cashflow
- —
- DSCR
- —
- Eligible?
- —
Personal DTI + credit; lowest rate.
DSCR
20% down · 8.5% · 30yr
- Down + closing
- —
- Monthly P&I
- —
- Monthly cashflow
- —
- DSCR
- —
- Eligible?
- —
No personal income docs; deal must DSCR.
Hard money
10% down · 12.0% · 12mo
- Down + closing
- —
- Monthly P&I
- —
- Monthly cashflow
- —
- DSCR
- —
- Eligible?
- —
Short-term bridge; refi at stabilization.
Rent comps 9 comps
| Address | Beds | Baths | Sqft | Rent | $/sqft | DOM | Units | Dist |
|---|---|---|---|---|---|---|---|---|
| 4205 Jordana Way Holiday, FL | 1.0–3.0 | 1.0–2.0 | 1027 | $1,404 | $1.37 | 2d | 13 | 0.65mi |
| 4348 Plaza Dr Holiday, FL | 1.0–2.0 | 1.0–2.0 | 860 | $1,499 | $1.74 | 2d | 9 | 0.71mi |
| 4318 Tahitian Gardens Cir Unit B Holiday, FL | 1.0 | 1.0 | 576 | $1,200 | $2.08 | 24d | 1 | 0.75mi |
| 4358 Tahitian Gardens Cir Unit G Holiday, FL | 1.0 | 1.0 | 600 | $1,350 | $2.25 | 24d | 1 | 0.76mi |
| 4358 Tahitian Gardens Cir Holiday, FL | 1.0 | 1.0 | 600 | $1,350 | $2.25 | 14d | 1 | 0.76mi |
| 2051 Pleasure Dr Holiday, FL | 2.0 | 1.0 | 720 | $1,200 | $1.67 | 24d | 1 | 0.78mi |
| 2133 Melody Dr Holiday, FL | 2.0 | 1.0 | 510 | $1,078 | $2.11 | 14d | 1 | 0.85mi |
| 2117 Calusa Trl Unit B Holiday, FL | 1.0 | 1.0 | 708 | $1,200 | $1.69 | 4d | 1 | 1.11mi |
| 2122 Ranchita Trl Holiday, FL | 2.0 | 1.0 | 648 | $1,399 | $2.16 | 24d | 1 | 1.16mi |
HOA detail
- Monthly dues
- $33 · $396/yr
- Likely covers
- security
Listing history 16 events
-
2026-06-18days on market $105,200 Active 93 DOM
-
2026-06-17days on market $105,200 Active 92 DOM
-
2026-06-16days on market $105,200 Active 91 DOM
-
2026-06-15days on market $105,200 Active 90 DOM
-
2026-06-13days on market $105,200 Active 88 DOM
-
2026-06-09days on market $105,200 Active 84 DOM
-
2026-06-08days on market $105,200 Active 83 DOM
-
2026-06-07days on market $105,200 Active 82 DOM
-
2026-06-04days on market $105,200 Active 79 DOM
-
2026-06-03days on market $105,200 Active 78 DOM
-
2026-06-02days on market $105,200 Active 77 DOM
-
2026-06-01days on market $105,200 Active 76 DOM
-
2026-05-31days on market $105,200 Active 75 DOM
-
2026-04-18price $105,200
-
2026-03-17$109,000 Active
-
1997-05-19soldstatus $20,000
ⓘ Source: listings_history table (triggers on properties + properties_extension) + one-shot
backfill from property_details.listing_events for pre-trigger history.
Climate risk First Street
- Flood 4/10 Moderate FEMA zone X (unshaded) · 13% chance over 30 yrs
- Wildfire 3/10 Moderate
- Heat 10/10 Extreme 7 d/yr ≥109°F today · 27 d/yr by 30 yrs out
- Wind 10/10 Extreme 99% chance of damaging wind over 30 yrs
- Air quality 3/10 Moderate 3 unhealthy d/yr today · 3 by 30 yrs out
Nearby sold comps map
Loading sold comps map…
Walkable amenities ~0.75 mi
Loading nearby amenities…
Taxation est. · year 1
- Rental income
- $17,271
- − Mortgage interest
- −$5,893
- − Property taxes
- −$1,578
- − Insurance
- −$526
- − Repairs & maintenance
- −$1,382
- − Management
- −$1,382
- − HOA
- −$396
- − Depreciation
- −$3,060
- Taxable income
- $3,055
- Est. tax owed @ 24.0%
- −$733
- After-tax cash flow
- $3,791/yr
For passive investors: Depreciation is non-cash, so a rental often shows a tax loss while cash-flowing — sheltering income. Rental losses are passive: they offset passive income freely, and up to $25,000/yr can offset ordinary (W-2) income if you actively participate and your MAGI is under $100k (phasing out to $0 by $150k); unused losses carry forward. On sale, claimed depreciation is recaptured at up to 25%, and gains may owe capital-gains tax (a 1031 exchange can defer both). Figures are a year-1 estimate at your 24.0% rate — not tax advice; consult a CPA.
Schools (NCES district)
- District
- Pasco
- NCES district ID
- 1201530
- Math proficiency
- 50% ▼ -10.00%
- Reading proficiency
- 52% ▼ -5.00%
- Median HH income
- $45,039
- Composite
- 43.14/100
- National rank
- #3074
- State rank
- #32 of 73 in FL
Livability — Holiday
- Score
- 66/100
- State rank
- #623
- US rank
- #12124
Category grades
Schools grade is shown separately in the Schools card above.
Census & demographics
- Census place
- Holiday, FL
- County
- Pasco County · 524,098 people
- City population
- 33,730
- Metro
- Tampa-St. Petersburg-Clearwater, FL
- Population (ZIP)
- 21,232
- Household income
- $50,288
- Rent vs Own
- Severe rent burden
- 1031.0
Population outlook (Pasco County) Hauer SSP2
- Today (2025)
- 570,045 people
- By 2030
- 605,844 · +6.3%
- By 2040
- 674,806 · +18.4%
- By 2050
- 736,022 · +29.1%
- By 2075
- 862,900 · +51.4%
- By 2100
- 906,364 · +59.0%
Race, ethnicity, and origin ACS 2023
- Neighborhood character
- Predominantly White (73%)
- Race & ethnicity
- White 73% Hispanic / Latino 15% Two or more races 11% Black 7% Asian 2%
- Hispanic origin (detail)
- Mexican 2% Puerto Rican 6% Cuban 2% Dominican 2%
- Common ancestry
- Romanian 3% Iranian 2% Lithuanian 2%
- Foreign-born
- 10% · Canada, Vietnam
- Languages at home
- 82% English-only · Spanish 8% Other Indo-European 5% Other Asian/Pacific 1%
Political lean MEDSL · Pasco
- 2024 margin
- Strong R (+25.2) · D 36.9% · R 62.1% · Other 1.0%
- 2008→2024 swing
- -21.6pp toward R · 2008: -3.6pp · 2024: -25.2pp
- All cycles
- 2024: R+25.2 2020: R+20.1 2016: R+21.6 2012: R+6.7 2008: R+3.6
Not yet ingested
- Civics
- —
Market trends
- HPI YoY
- ▼ -102.84%
- Current HPI
- 326.9843
- Rent YoY
- ▲ 2.05%
- Metro
- Tampa-St. Petersburg-Clearwater, FL
- State GDP YoY
- ▲ 3.28%
- F500 in state
- 36
Industry mix (Fortune 500 HQ in FL)
| Industry | F500 HQs | Revenue |
|---|---|---|
| Industrial Technology | 2 | $29B |
|
||
| Insurance | 2 | $17B |
|
||
| Retail | 1 | $60B |
|
||
| Technology Distribution | 1 | $58B |
|
||
| Homebuilding | 1 | $35B |
|
||
| Technology Manufacturing | 1 | $35B |
|
||
Price history
+426.0% since first listed3 events — show timeline
- 2026-04-18 Price Changed $105,200 Stellar MLS as Distributed by MLS Grid
- 2026-03-17 Listed $109,000 Stellar MLS as Distributed by MLS Grid
- 1997-05-19 Sold (Public Records) $20,000 Public Records
Property tax history
+5.1%/yrLatest (2025): $209 · +3.5% YoY. Source: county tax records.
Cash-flow waterfall
monthlySold comps — $/sqft
last 12 mo · ≤1 miLoading sold comps…