521 E 81st St Unit 3D · New York, NY
Flood risk 1/10 · Minimal
- FEMA flood zone
- X (unshaded)
- Chance of flooding over 30 yrs
- 0.0%
- Est. flood insurance / yr
- $507 – $1,088
Fire risk 1/10 · Minimal
- Est. fire insurance / yr
- $691 – $1,283
Heat risk 6/10 · Moderate
- Hot days now (above 99°F)
- 7 days/yr
- Hot days in 30 yrs
- 15 days/yr
Wind risk 6/10 · Moderate
- Chance of severe wind over 30 yrs
- 27.0%
Air-quality risk 4/10 · Minor
- Unhealthy air days now
- 5 days/yr
- Unhealthy air days in 30 yrs
- 6 days/yr
Risk factors via First Street. Map © Google.
Why this score? — see what drove the B- grade
The composite is a weighted blend of 9 inputs, each scored 0–100. Each bar is that input's sub-score; the figure is the points it added to the 100-point composite (weight × sub-score).
- Cash flow +21.1/30.0
- Appreciation +10.0/10.0
- 1% rule +9.0/10.0
- ARV discount +7.5/15.0
- DSCR +6.7/10.0
- Schools +5.0/10.0
- Rent growth +4.0/5.0
- Livability +3.8/5.0
- Condition / age +2.5/5.0
$375,000
🖨 Deal sheet (PDF) 📄 Offer letter ✓ Due diligence
Listing remarks
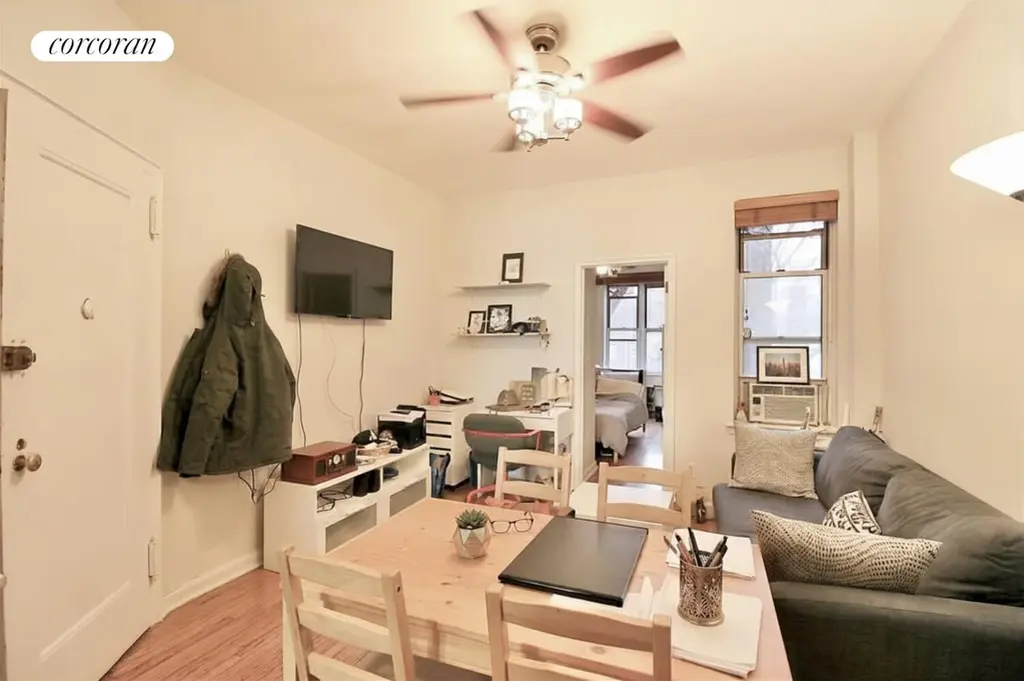
Nicely proportioned one-bedroom home with 9-foot ceilings in the heart of Yorkville. The apartment looks onto the trees facing the rear of the building and is pin-drop quiet. 521 East 81st Street is a well-maintained, charming boutique pre-war co-op with a live-in super and laundry room. Conveniently located near the 2nd Avenue Q subway line, residents are also just blocks away from Carl Schurz Park and Gracie Mansion. A local favorite, Gracie Mews Diner, is right around the corner, along with several grocery stores. Nicely proportioned one bedroom home with 9 foot ceilings in the heart of Yorkville. The apartment looks onto the trees facing the rear of the building and is pin-drop quiet. 5
Key facts
- Laundry room
- 9 foot ceilings
- $1,025 HOA
Tags
Property features AI
Finance
- Other: No pets allowed in building
- Financial info: Building contains 20 total units
- HOA & community: Monthly association fee of $1,025
Exterior
- Home design: Entry level on 3rd floor; 5-story building
- Exterior features: Private outdoor space under 60 sqft; North exposure
Interior
- Bathrooms: 1 full bathroom
- Interior features: Total of 3 rooms; Basement described as 'Other'
- Laundry & utility: Laundry located in building basement
Neighborhood map
What this means for you Summary
Snapshot
- This is a 1-bed/1.0-bath condo listed at $375k.
Deal economics
- At list price, monthly cash flow is $536 ($6k/yr) — positive.
- The deal already cash-flows at list — no discount required.
- Meets the 1% rule at list price ($5k rent vs $375k).
- Cap rate 8.0% vs local median 2.6% in New York — top-decile yield for the area; either an underpriced asset or a hidden risk that comps aren't pricing in. Stress-test before assuming the spread holds.
Location & tenants
- Location reads 75/100 on livability (#268 in NY, #4,188 nationally) — a middle-class / working-renter tenant base. Strengths: amenities A+, commute A+, health & safety A; Watch: crime F, cost of living F.
- Market conditions: Rents rising fast (+6.2%/yr); 276 active listings in the ZIP; 40 comparable units currently listed for rent nearby; rentals leasing fast (median 8d on market — plan ~1-2 weeks tenant-placement turnaround); high-income renter base; 4,467 units permitted in New York County in 2024 (4,463 in 5+ unit buildings).
- This rent runs 36% of the median local income ($175k/yr) — at the standard rent-burdened threshold; future hikes will face affordability resistance.
Forward outlook
- In year one you build about $40k of equity ($3k loan paydown + $38k appreciation (10.0% local appreciation)).
- New York County population projected at +21% by 2050 — long-run rental-demand tailwind backs the buy-and-hold thesis.
- At projected returns (10.0% appreciation + 6.2% rent growth), your $105k cash investment doubles in ~3 years — after that, you're playing with house money.
- By year 2, paydown + projected appreciation supports a ~$64k cash-out refi (75% LTV) — recoverable capital for the next deal without selling this one.
Negotiation context
- Only 6 days on market — expect competitive offers; lowballing is unlikely to land.
- 7 sale attempts since 19y ago with the ask held roughly flat each time — persistent listings suggest the price (not the market) is what's stuck; bring a comps-based counter.
Risks & watch-outs
- Watch-outs: built in 1910 — expect roof / HVAC / electrical / plumbing capex.
- Climate carrying-cost: major wind risk, 27% chance of damaging wind over 30y; extreme-heat days projected 7→15/yr by 2055 (HVAC capex compounding) — expect insurance premiums to compound above CPI over the hold.
Questions for the listing agent
- Built in 1910 — when were the roof, HVAC, electrical panel, plumbing, and water heater last replaced?
- What does the HOA fee cover, when was the last increase, and are there any pending special assessments or reserve-fund shortfalls?
- Any open or pending special assessments — roof, HVAC, plumbing, elevator, façade? What's the per-unit balance and payoff schedule, and is the seller paying it off at close or rolling it to the buyer?
- Is there a deadline driving the sale (1031 exchange, divorce, estate, relocation)? That informs how much negotiation room exists.
- Schools are B-rated — typically a magnet for longer-tenancy family renters. What's the average tenant stay here, and is there a school-zone premium baked into asking?
- Crime grade is F in this area — have there been break-ins, vandalism, or insurance claims at this property in the last 3 years? What carrier currently insures it and at what premium?
- What's the average days-on-market for RENTAL listings here right now (not sales)? A rising rental-DOM trend means longer vacancies and softer asking-rent achievability than the comps imply.
- What's the recent tenant-quality profile in this submarket — average credit score on applications, eviction rate, late-payment / NSF rate, and stable-employment percentage? A property-management company in the area should have these aggregated.
- How much new apartment / multifamily construction is in the pipeline within 1–3 miles? Heavy new supply (>2% of stock underway) typically softens rents 12–24 months out; light construction supports rent growth.
Investment metrics
- 1% rule
- 1.40% ✓
- Cap rate
- 8.01%
- Cash-on-cash
- 6.13%
- DSCR
- 1.27
- GRM
- 5.9
CMA / ARV
No comps found within radius.
Projected returns pro-forma
10.0% appreciation · 6.16% rent growth · sell at horizon
- IRR
- 30.5%
- Equity multiple
- 3.44×
- Total profit
- $256,345
- Equity at exit
- $337,830
- IRR
- 27.8%
- Equity multiple
- 8.33×
- Total profit
- $769,185
- Equity at exit
- $728,543
Cash invested: $105,000 (down + closing). Projections, not guarantees.
Landlord ↔ Tenant lean methodology
- Overall (CITY)
- 0 Strongly Tenant-Friendly
- State New York
- 15 Strongly Tenant-Friendly · D+10
- County
- — inherits STATE
- City New York
- 0 Strongly Tenant-Friendly · D+34
ZIP-level market 10028
- Home prices YoY
- 3.7%
- Rents YoY
- 6.2%
- Active inventory
- 276
- Price-to-rent
- 5.9×
Monthly cashflow live
- Estimated rent
- $5,257 high interval (Pro) →
- Mortgage (P&I)
- −$1,967
- Tax est. 1.5%
- −$469 /mo · $5,625/yr
- Insurance
- −$156
- HOA
- −$1,025
- Vacancy / Maint / Mgmt
- −$1,104
- Net cashflow
- $536
Break-even live
Sensitivity live
| Price | -10% $795 | -5% $666 | +0% $536 | +5% $407 | +10% $277 |
|---|---|---|---|---|---|
| Rent | -10% $121 | -5% $329 | +0% $536 | +5% $744 | +10% $952 |
| Rate | -1.0pp $725 | -0.5pp $632 | base $536 | +0.5pp $439 | +1.0pp $340 |
UW: 25.0% down · 7.5% · 30yr · 1.5% tax · 5.0% vac · 8.0% maint · 8.0% mgmt
Financing live
Cash to close
- Down payment
- $93,750
- Closing costs
- $11,250
- Reserves months
- —
- Total cash needed
- —
Loan-product check · same deal, 3 products live
Conventional
25% down · 7.5% · 30yr
- Down + closing
- —
- Monthly P&I
- —
- Monthly cashflow
- —
- DSCR
- —
- Eligible?
- —
Personal DTI + credit; lowest rate.
DSCR
20% down · 8.5% · 30yr
- Down + closing
- —
- Monthly P&I
- —
- Monthly cashflow
- —
- DSCR
- —
- Eligible?
- —
No personal income docs; deal must DSCR.
Hard money
10% down · 12.0% · 12mo
- Down + closing
- —
- Monthly P&I
- —
- Monthly cashflow
- —
- DSCR
- —
- Eligible?
- —
Short-term bridge; refi at stabilization.
Rent comps 40 comps
| Address | Beds | Baths | Sqft | Rent | $/sqft | DOM | Units | Dist |
|---|---|---|---|---|---|---|---|---|
| 501 1/2 E 83rd St #1998 New York, NY | 2.0 | 1.0 | 525 | $4,710 | $8.97 | 25d | 2 | 0.13mi |
| 420 E 80th St #198 New York, NY | 1.0 | 1.0 | 623 | $4,760 | $7.64 | 19d | 1 | 0.16mi |
| 1567 York Ave Unit 1021866P New York, NY | 2.0 | 1.0 | 742 | $5,910 | $7.96 | 22d | 1 | 0.16mi |
| 515 E 86th St Unit 1760 New York, NY | 1.0 | 1.0 | 485 | $5,360 | $11.05 | 0d | 1 | 0.28mi |
| 515 E 86th St Unit 589 New York, NY | 1.0 | 1.0 | 695 | $6,070 | $8.73 | 20d | 1 | 0.28mi |
| 347 E 78th St Unit 1460467P New York, NY | 2.0 | 1.0 | 645 | $7,606 | $11.79 | 25d | 1 | 0.31mi |
| 347 E 78th St Unit 1530420P New York, NY | 2.0 | 1.0 | 645 | $6,270 | $9.72 | 22d | 1 | 0.31mi |
| 888 Main St New York, NY | 3.0 | 1.0–2.0 | 908 | $4,928 | $5.43 | 0d | 8 | 0.31mi |
| 501 E 87th St #2094 New York, NY | 1.0 | 1.0 | 618 | $7,050 | $11.41 | 0d | 2 | 0.34mi |
| 315 E 78th St Unit 1021885P New York, NY | 1.0 | 1.0 | 516 | $6,242 | $12.10 | 0d | 1 | 0.35mi |
| 315 E 78th St Unit 1021847P New York, NY | 1.0 | 1.0 | 516 | $4,880 | $9.46 | 20d | 1 | 0.35mi |
| 315 E 78th St Unit 1021894P New York, NY | 1.0 | 1.0 | 548 | $5,643 | $10.30 | 22d | 1 | 0.35mi |
| 315 E 78th St Unit 1021994P New York, NY | 1.0 | 1.0 | 441 | $5,037 | $11.42 | 21d | 1 | 0.35mi |
| 301 E 79th St Unit 28P New York, NY | 1.0 | 1.0 | 700 | $5,500 | $7.86 | 25d | 1 | 0.35mi |
| 308 E 78th St #2024 New York, NY | 1.0–2.0 | 1.0 | 550 | $4,610 | $8.38 | 25d | 2 | 0.37mi |
| 315 E 86th St Unit 1327 New York, NY | 1.0 | 2.0 | 726 | $6,460 | $8.90 | 25d | 1 | 0.43mi |
| 1373 1st Ave Unit 1952 New York, NY | 2.0 | 2.0 | 650 | $7,260 | $11.17 | 25d | 1 | 0.44mi |
| 515 E 72nd St Unit 17D New York, NY | 1.0 | 1.0 | 687 | $5,500 | $8.01 | 25d | 1 | 0.44mi |
| 244 E 86th St #604 New York, NY | 1.0–2.0 | 1.0–2.0 | 950 | $4,920 | $5.18 | 4d | 2 | 0.47mi |
| 231 E 76th St #1530 New York, NY | 1.0 | 1.0 | 650 | $6,470 | $9.95 | 21d | 1 | 0.47mi |
| 200 E 82nd St #505 New York, NY | 2.0 | 1.0 | 636 | $6,715 | $10.55 | 2d | 3 | 0.49mi |
| 240e E 75th St Unit 1021873P New York, NY | — | 1.0 | 441 | $5,227 | $11.85 | 5d | 1 | 0.51mi |
| 240e E 75th St Unit 1021876P New York, NY | — | 1.0 | 441 | $5,981 | $13.56 | 8d | 1 | 0.51mi |
| 354 E 91st St #648 New York, NY | 1.0–2.0 | 1.0 | 692 | $5,520 | $7.97 | 0d | 2 | 0.56mi |
| 201 E 86th St #298 New York, NY | 1.0–2.0 | 1.0–1.5 | 700 | $7,210 | $10.30 | 0d | 2 | 0.57mi |
| 235 E 89th St Unit 1495783P New York, NY | 2.0 | 1.0 | 699 | $7,443 | $10.65 | 21d | 1 | 0.57mi |
| 403 E 69th St #1518 New York, NY | 1.0–3.0 | 1.0 | 745 | $3,990 | $5.36 | 25d | 3 | 0.63mi |
| 200 E 89th St Unit 12G New York, NY | 1.0 | 1.0 | 650 | $5,000 | $7.69 | 18d | 1 | 0.63mi |
| 1290 1st Ave #1499 New York, NY | 2.0 | 1.0 | 671 | $6,100 | $9.09 | 3d | 2 | 0.63mi |
| 160 E 88th St #1332 New York, NY | 1.0 | 1.0 | 560 | $5,670 | $10.12 | 7d | 1 | 0.68mi |
| 1310 2nd Ave Unit 1224958P New York, NY | 1.0–2.0 | 1.0 | 699 | $5,450 | $7.80 | 2d | 2 | 0.71mi |
| 345 E 94th St #1470 New York, NY | 2.0 | 1.0–2.0 | 710 | $5,645 | $7.95 | 4d | 3 | 0.72mi |
| 400 E 66th St Unit 1016404P New York, NY | 1.0–2.0 | 1.0–2.0 | 791 | $10,597 | $13.40 | 4d | 2 | 0.80mi |
| 215 E 95th St #1293 New York, NY | 1.0–2.0 | 1.0–1.5 | 740 | $5,420 | $7.32 | 0d | 2 | 0.86mi |
| 1001 5th Ave Unit 3 New York, NY | 1.0 | 1.0 | 450 | $5,400 | $12.00 | 25d | 1 | 0.87mi |
| 7 E 75th St #1615 New York, NY | 1.0–3.0 | 1.0–2.0 | 656 | $4,850 | $7.39 | 0d | 3 | 0.89mi |
| 952 5th Ave #998 New York, NY | 1.0–2.0 | 1.0 | 800 | $6,460 | $8.07 | 0d | 2 | 0.90mi |
| 215 E 96th St Unit 688 New York, NY | 1.0 | 1.0 | 717 | $7,770 | $10.84 | 0d | 1 | 0.90mi |
| 220 E 65th St New York, NY | 1.0 | 1.0 | 700 | $5,950 | $8.50 | 2d | 1 | 0.94mi |
| 175 E 96th St Unit 1251683P New York, NY | 2.0 | 1.0 | 600 | $5,305 | $8.84 | 3d | 2 | 0.94mi |
HOA detail condo
- Monthly dues
- $1,025 · $12,300/yr
- Assessments
- None detected in remarks — confirm with the listing agent.
Listing history 6 events
-
2026-06-18days on market $375,000 Active 6 DOM
-
2026-06-17days on market $375,000 Active 5 DOM
-
2026-06-16days on market $375,000 Active 4 DOM
-
2026-06-15days on market $375,000 Active 3 DOM
-
2026-06-13remarks 699-char remark
-
2026-06-13$375,000 Active 1 DOM
ⓘ Source: listings_history table (triggers on properties + properties_extension) + one-shot
backfill from property_details.listing_events for pre-trigger history.
Climate risk First Street
- Flood 1/10 Low FEMA zone X (unshaded) · 0% chance over 30 yrs
- Wildfire 1/10 Low
- Heat 6/10 Major 7 d/yr ≥99°F today · 15 d/yr by 30 yrs out
- Wind 6/10 Major 27% chance of damaging wind over 30 yrs
- Air quality 4/10 Moderate 5 unhealthy d/yr today · 6 by 30 yrs out
Nearby sold comps map
Loading sold comps map…
Walkable amenities ~0.75 mi
Loading nearby amenities…
Taxation est. · year 1
- Rental income
- $63,081
- − Mortgage interest
- −$21,006
- − Property taxes
- −$5,625
- − Insurance
- −$1,875
- − Repairs & maintenance
- −$5,047
- − Management
- −$5,047
- − HOA
- −$12,300
- − Depreciation
- −$10,909
- Taxable income
- $1,274
- Est. tax owed @ 24.0%
- −$306
- After-tax cash flow
- $6,130/yr
For passive investors: Depreciation is non-cash, so a rental often shows a tax loss while cash-flowing — sheltering income. Rental losses are passive: they offset passive income freely, and up to $25,000/yr can offset ordinary (W-2) income if you actively participate and your MAGI is under $100k (phasing out to $0 by $150k); unused losses carry forward. On sale, claimed depreciation is recaptured at up to 25%, and gains may owe capital-gains tax (a 1031 exchange can defer both). Figures are a year-1 estimate at your 24.0% rate — not tax advice; consult a CPA.
Schools (NCES district)
No district data.
Livability — New York
- Score
- 75/100
- State rank
- #268
- US rank
- #4188
Category grades
Schools grade is shown separately in the Schools card above.
Census & demographics
- Census place
- New York, NY
- County
- New York County · 1,599,927 people
- City population
- 7,731,280
- Metro
- New York-Newark-Jersey City, NY-NJ-PA
- Population (ZIP)
- 49,077
- Household income
- $175,121
- Rent vs Own
- Severe rent burden
- 3381.0
Population outlook (New York County) Hauer SSP2
- Today (2025)
- 1,825,725 people
- By 2030
- 1,904,611 · +4.3%
- By 2040
- 2,052,719 · +12.4%
- By 2050
- 2,206,601 · +20.9%
- By 2075
- 2,509,427 · +37.4%
- By 2100
- 2,702,933 · +48.0%
Race, ethnicity, and origin ACS 2023
- Neighborhood character
- Predominantly White (82%)
- Race & ethnicity
- White 82% Asian 7% Hispanic / Latino 6% Two or more races 5% Black 2%
- Hispanic origin (detail)
- Mexican 1% Puerto Rican 2%
- Common ancestry
- Scotch-Irish 7% Romanian 6% Italian 5%
- Foreign-born
- 16% · Canada, China, Jamaica
- Languages at home
- 81% English-only · Other Indo-European 6% Spanish 4% French/Haitian/Cajun 2%
Political lean MEDSL · New York
- 2024 margin
- Solid D (+64.8) · D 82.4% · R 17.6%
- 2008→2024 swing
- -7.4pp toward R · 2008: 72.2pp · 2024: 64.8pp
- All cycles
- 2024: D+64.8 2020: D+74.5 2016: D+77.2 2012: D+69.6 2008: D+72.2
Not yet ingested
- Civics
- —
Market trends
- HPI YoY
- ▲ 12.13%
- Current HPI
- 341.1676
- Rent YoY
- ▲ 6.16%
- Metro
- New York-Newark-Jersey City, NY-NJ-PA
- State GDP YoY
- ▲ 2.60%
- F500 in state
- 92
Industry mix (Fortune 500 HQ in NY)
| Industry | F500 HQs | Revenue |
|---|---|---|
| Financial Services | 10 | $950B |
|
||
| Consumer Goods | 9 | $162B |
|
||
| Insurance | 4 | $225B |
|
||
| Telecommunications | 2 | $144B |
|
||
| Pharmaceuticals | 2 | $112B |
|
||
| Media / Entertainment | 2 | $69B |
|
||
Price history
-2.9% since first listed7 events — show timeline
- 2026-06-09 Listed $375,000 RLS at REBNY
- 2022-05-16 Listed $399,000 RLS at REBNY
- 2021-06-15 Relisted — RLS at REBNY
- 2021-05-14 Listed $399,000 RLS at REBNY
- 2007-05-24 Listed $386,050 RLS at REBNY
- 2007-05-24 Listed $386,050 RLS at REBNY
- 2007-05-24 Listed $386,050 RLS at REBNY
Cash-flow waterfall
monthlySold comps — $/sqft
last 12 mo · ≤1 miLoading sold comps…