 Triplex
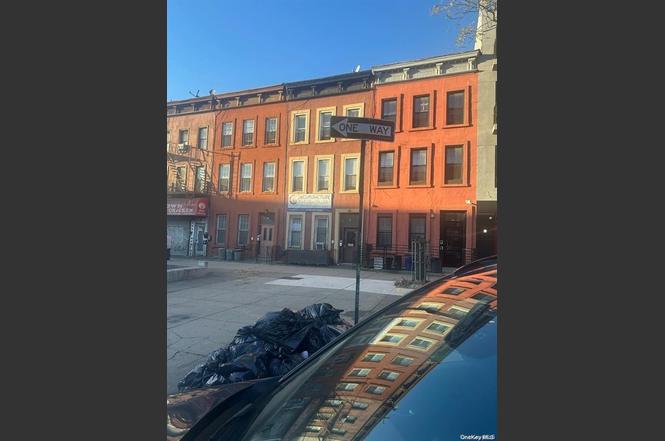
9 Somers St · New York, NY
Flood risk 1/10 · Minimal
- FEMA flood zone
- X (unshaded)
- Chance of flooding over 30 yrs
- 0.0%
- Est. flood insurance / yr
- $507 – $1,088
Fire risk 1/10 · Minimal
- Est. fire insurance / yr
- $691 – $1,283
Heat risk 6/10 · Moderate
- Hot days now (above 99°F)
- 7 days/yr
- Hot days in 30 yrs
- 15 days/yr
Wind risk 6/10 · Moderate
- Chance of severe wind over 30 yrs
- 39.0%
Air-quality risk 5/10 · Moderate
- Unhealthy air days now
- 6 days/yr
- Unhealthy air days in 30 yrs
- 8 days/yr
Risk factors via First Street. Map © Google.
Why this score? — see what drove the D grade
The composite is a weighted blend of 9 inputs, each scored 0–100. Each bar is that input's sub-score; the figure is the points it added to the 100-point composite (weight × sub-score).
- Cash flow +12.7/30.0
- Appreciation +10.0/10.0
- Schools +5.0/10.0
- Rent growth +4.1/5.0
- DSCR +3.8/10.0
- Livability +3.8/5.0
- Condition / age +2.5/5.0
- 1% rule +2.3/10.0
- ARV discount +0.0/15.0
$1,374,999
🖨 Deal sheet (PDF) 📄 Offer letter ✓ Due diligence
Multi-family units
County records classify this as Multi-Family (2-4 Unit). Listing-text estimate: 3 units. confirmed
Listing remarks
Excellent opportunity to acquire a well-maintained three-family mixed-use property in Brooklyn. The building features three residential units plus office space, making it an ideal investment for both owner-users and income-focused investors. The office space will be delivered vacant at closing, providing flexibility for a new business, professional office use, or potential leasing opportunity. The residential units are currently configured as follows: • 1st Floor Apartment: 1 bedroom / 1 bathroom – $2,762/month • 2nd Floor Apartment: $2,395/month • 3rd Floor Apartment: $3,100/month The building measures approximately 18.5 ftx45 ft, offering efficient layouts and stron
Key facts
- Office space
- Residential units
- Mixed-use property
Tags
Property features AI
Exterior
- Parking: No carport; No designated parking
- Utilities: Public sewer; Cable connected; Electricity connected; Natural gas connected; Public trash collection; Water connected
- Home design: Triplex property
- Construction: Brick construction
- Exterior features: Brick construction; Not waterfront; No additional parcels
Interior
- Bedrooms: Two 3-bedroom units and one 1-bedroom unit
- Bathrooms: Three full bathrooms
- Heating & cooling: Natural gas heating; Wall/Window air conditioning units
- Interior features: Entrance foyer; Finished full basement (no separate basement level listed)
Neighborhood map
What this means for you Summary
Snapshot
- This is a 3 × 2-bed/1.0-bath units multifamily listed at $1.37M.
Deal economics
- At list price, monthly cash flow is $-143 ($-2k/yr) — negative. Per door: $-48/mo.
- To cash-flow at today's rent, offer at most $1.35M (1.8% below list).
- To meet the 1% rule (rent ≥ 1% of price), the offer needs to be $1.01M (26.9% below list).
- Recommended offer: $1.01M (26.9% below list) — sets the bar for 1% rule.
- Cap rate 6.2% vs local median 2.6% in New York — top-decile yield for the area; either an underpriced asset or a hidden risk that comps aren't pricing in. Stress-test before assuming the spread holds.
Location & tenants
- Location reads 75/100 on livability (#268 in NY, #4,188 nationally) — a middle-class / working-renter tenant base. Strengths: amenities A+, commute A+, health & safety A; Watch: crime F, cost of living F.
- Market conditions: Rents rising fast (+6.4%/yr); 152 active listings in the ZIP; 10,063 units permitted in Kings County in 2024 (9,789 in 5+ unit buildings).
- At $10,051/mo this rent would consume 193% of the median local household income ($62k/yr) (locally 6960% of renters already pay >50% of income on rent) — very limited rent-growth headroom before tenants either downsize or default.
Forward outlook
- In year one you build about $147k of equity ($10k loan paydown + $138k appreciation (10.0% local appreciation)).
- Kings County population projected at +13% by 2050 — modest demand growth; plan on rents tracking national, not racing it.
- By year 2, paydown + projected appreciation supports a ~$236k cash-out refi (75% LTV) — recoverable capital for the next deal without selling this one.
Negotiation context
- It's been on market 105 days — a 9% lower offer ($1.25M) is reasonable based on typical stale-listing flexibility.
- 7 sale attempts since 27y ago with the ask held roughly flat each time — persistent listings suggest the price (not the market) is what's stuck; bring a comps-based counter.
- Current owner paid $1.12M; 22% above their basis — modest negotiation headroom, anchor on the comps not their cost.
Risks & watch-outs
- Watch-outs: built in 1899 — expect roof / HVAC / electrical / plumbing capex.
- Climate carrying-cost: major wind risk, 39% chance of damaging wind over 30y; extreme-heat days projected 7→15/yr by 2055 (HVAC capex compounding) — expect insurance premiums to compound above CPI over the hold.
Questions for the listing agent
- What do current leases actually rent for vs. the listed asking? Can we see a recent rent roll and the last 12 months of T-12 income?
- It's been on market 105 days. Have you received any prior offers? Is the seller open to a 27% concession, seller financing, or rate buy-down credit?
- Can we see the unit-by-unit rent roll, current vacancy, and any below-market leases? What's the average tenancy length?
- What capital expenditures (roof, boiler, parking lot, exteriors) have been made in the last 5 years, and what's planned in the next 2?
- Built in 1899 — when were the roof, HVAC, electrical panel, plumbing, and water heater last replaced?
- Why hasn't it sold? Are there any deal-killer items the seller is aware of (foundation, flood, title, zoning, code violations)?
- Is there a deadline driving the sale (1031 exchange, divorce, estate, relocation)? That informs how much negotiation room exists.
- Schools are B-rated — typically a magnet for longer-tenancy family renters. What's the average tenant stay here, and is there a school-zone premium baked into asking?
- Crime grade is F in this area — have there been break-ins, vandalism, or insurance claims at this property in the last 3 years? What carrier currently insures it and at what premium?
- The area grade is low — what's the realistic commute time and amenity access for the typical tenant pool here? Any planned neighborhood developments (good or bad) we should know about?
- What's the average days-on-market for RENTAL listings here right now (not sales)? A rising rental-DOM trend means longer vacancies and softer asking-rent achievability than the comps imply.
- What's the recent tenant-quality profile in this submarket — average credit score on applications, eviction rate, late-payment / NSF rate, and stable-employment percentage? A property-management company in the area should have these aggregated.
- How much new apartment / multifamily construction is in the pipeline within 1–3 miles? Heavy new supply (>2% of stock underway) typically softens rents 12–24 months out; light construction supports rent growth.
Investment metrics
- 1% rule
- 0.73% ✗
- Cap rate
- 6.17%
- Cash-on-cash
- -0.44%
- DSCR
- 0.98
- GRM
- 11.4
CMA / ARV
- ARV (on-the-fly)
- $1,013,688
- Comps found
- 7
Show comp detail 7 sales within ~0.75 mi
| Address | Dist | Beds/Ba | Sqft | Sold | Price | $/sf | Match |
|---|---|---|---|---|---|---|---|
| 1319 Herkimer St | 0.20mi | 6/4.0 | 2,910 (+4%) | 5mo | $522,500 | $180 | 76 |
| 14 Marconi Pl | 0.11mi | 6/3.0 | 2,661 (-5%) | 15mo | $960,000 | $361 | 74 |
| 737 Decatur St | 0.36mi | 7/2.0 (+1) | 2,700 (-4%) | 6mo | $1,162,000 | $430 | 63 |
| 699 Decatur St | 0.36mi | 5/3.0 (-1) | 2,700 (-4%) | 12mo | $1,350,000 | $500 | 62 |
| 76 Aberdeen St | 0.53mi | 6/4.0 | 2,642 (-6%) | 11mo | $1,300,000 | $492 | 52 |
| 657 Evergreen | 0.63mi | 5/3.0 (-1) | 2,850 (+2%) | 14mo | $975,000 | $342 | 52 |
| 1332 Saint Marks Ave | 0.69mi | 7/3.0 (+1) | 3,120 (+11%) | 7mo | $818,888 | $262 | 39 |
Match score weights: distance 35% · size 25% · config 20% · recency 20%. Top-matched comps best support the ARV.
Projected returns pro-forma
10.0% appreciation · 6.44% rent growth · sell at horizon
- IRR
- 24.9%
- Equity multiple
- 3.01×
- Total profit
- $775,040
- Equity at exit
- $1,238,708
- IRR
- 22.8%
- Equity multiple
- 7.16×
- Total profit
- $2,371,950
- Equity at exit
- $2,671,321
Cash invested: $385,000 (down + closing). Projections, not guarantees.
Landlord ↔ Tenant lean methodology
- Overall (CITY)
- 0 Strongly Tenant-Friendly
- State New York
- 15 Strongly Tenant-Friendly · D+10
- County
- — inherits STATE
- City New York
- 0 Strongly Tenant-Friendly · D+34
ZIP-level market 11233
- Home prices YoY
- 2.9%
- Rents YoY
- 6.4%
- Active inventory
- 152
- Price-to-rent
- 34.2×
Monthly cashflow live
- Estimated rent
- $10,051 high interval (Pro) →
- Mortgage (P&I)
- −$7,211
- Tax from tax record
- −$299 /mo · $3,593/yr
- Insurance
- −$573
- HOA
- −$0
- Vacancy / Maint / Mgmt
- −$2,111
- Net cashflow
- $-143
Break-even live
Sensitivity live
| Price | -10% $636 | -5% $246 | +0% $-143 | +5% $-532 | +10% $-921 |
|---|---|---|---|---|---|
| Rent | -10% $-937 | -5% $-540 | +0% $-143 | +5% $254 | +10% $651 |
| Rate | -1.0pp $550 | -0.5pp $207 | base $-143 | +0.5pp $-499 | +1.0pp $-861 |
3-unit breakdown (identical units grouped — click to expand)
| Units | Beds | Baths | Est. rent |
|---|---|---|---|
| 3× units | 2 | 1 | $10,050 |
| #1 | 2 | 1 | $3,350 |
| #2 | 2 | 1 | $3,350 |
| #3 | 2 | 1 | $3,350 |
| Total (3 units) | $10,051 | ||
UW: 25.0% down · 7.5% · 30yr · 1.5% tax · 5.0% vac · 8.0% maint · 8.0% mgmt
Financing live
Cash to close
- Down payment
- $343,750
- Closing costs
- $41,250
- Reserves months
- —
- Total cash needed
- —
Loan-product check · same deal, 3 products live
Conventional
25% down · 7.5% · 30yr
- Down + closing
- —
- Monthly P&I
- —
- Monthly cashflow
- —
- DSCR
- —
- Eligible?
- —
Personal DTI + credit; lowest rate.
DSCR
20% down · 8.5% · 30yr
- Down + closing
- —
- Monthly P&I
- —
- Monthly cashflow
- —
- DSCR
- —
- Eligible?
- —
No personal income docs; deal must DSCR.
Hard money
10% down · 12.0% · 12mo
- Down + closing
- —
- Monthly P&I
- —
- Monthly cashflow
- —
- DSCR
- —
- Eligible?
- —
Short-term bridge; refi at stabilization.
Listing history 27 events
-
2026-06-18days on market $1,374,999 Active 105 DOM
-
2026-06-17days on market $1,374,999 Active 104 DOM
-
2026-06-15days on market $1,374,999 Active 102 DOM
-
2026-06-13days on market $1,374,999 Active 100 DOM
-
2026-06-10days on market $1,374,999 Active 96 DOM
-
2026-06-08days on market $1,374,999 Active 95 DOM
-
2026-06-08days on market $1,374,999 Active 94 DOM
-
2026-06-04days on market $1,374,999 Active 91 DOM
-
2026-06-03days on market $1,374,999 Active 90 DOM
-
2026-06-01days on market $1,374,999 Active 88 DOM
-
2026-05-31days on market $1,374,999 Active 87 DOM
-
2026-04-13price $1,374,999
-
2026-03-05$1,399,999 Active
-
2022-12-13soldstatus $1,124,000
-
2022-06-30$1,275,000 Active
-
2022-03-15$1,275,000 Active
-
2021-08-13price $1,377,000
-
2021-06-24price $1,397,000
-
2021-06-04$1,377,000 Active
-
2021-06-04$1,488,000 Active
-
2019-09-09historical
-
2019-08-13price $1,275,000
-
2019-08-04price $1,350,000
-
2019-06-25$1,450,000 New
-
2005-08-23soldstatus $217,019
-
2000-02-03soldstatus $195,000
-
1999-04-21$199,000
ⓘ Source: listings_history table (triggers on properties + properties_extension) + one-shot
backfill from property_details.listing_events for pre-trigger history.
Tax reassessment forecast NY · Partial reset (capped growth)
- Current annual tax
- $3,593 · $299/mo
- Projected year-2 tax
- $13,415 · $1,118/mo
- Expected delta
- +$9,822/yr (+$819/mo · 273.4%)
ⓘ Screening estimate from a state-policy table — verify with the county assessor before closing.
Climate risk First Street
- Flood 1/10 Low FEMA zone X (unshaded) · 0% chance over 30 yrs
- Wildfire 1/10 Low
- Heat 6/10 Major 7 d/yr ≥99°F today · 15 d/yr by 30 yrs out
- Wind 6/10 Major 39% chance of damaging wind over 30 yrs
- Air quality 5/10 Major 6 unhealthy d/yr today · 8 by 30 yrs out
Nearby sold comps map
Loading sold comps map…
Walkable amenities ~0.75 mi
Loading nearby amenities…
Taxation est. · year 1
- Rental income
- $120,612
- − Mortgage interest
- −$77,021
- − Property taxes
- −$3,593
- − Insurance
- −$6,875
- − Repairs & maintenance
- −$9,649
- − Management
- −$9,649
- − Depreciation
- −$40,000
- Taxable loss
- −$26,175
- Est. tax savings @ 24.0%
- +$6,282
- After-tax cash flow
- $4,570/yr
For passive investors: Depreciation is non-cash, so a rental often shows a tax loss while cash-flowing — sheltering income. Rental losses are passive: they offset passive income freely, and up to $25,000/yr can offset ordinary (W-2) income if you actively participate and your MAGI is under $100k (phasing out to $0 by $150k); unused losses carry forward. On sale, claimed depreciation is recaptured at up to 25%, and gains may owe capital-gains tax (a 1031 exchange can defer both). Figures are a year-1 estimate at your 24.0% rate — not tax advice; consult a CPA.
Schools (NCES district)
No district data.
Livability — New York
- Score
- 75/100
- State rank
- #268
- US rank
- #4188
Category grades
Schools grade is shown separately in the Schools card above.
Census & demographics
- Census place
- New York, NY
- County
- Kings County · 2,614,986 people
- City population
- 7,731,280
- Metro
- New York-Newark-Jersey City, NY-NJ-PA
- Population (ZIP)
- 81,822
- Household income
- $62,411
- Rent vs Own
- Severe rent burden
- 6960.0
Population outlook (Kings County) Hauer SSP2
- Today (2025)
- 2,847,441 people
- By 2030
- 2,937,006 · +3.1%
- By 2040
- 3,095,491 · +8.7%
- By 2050
- 3,228,968 · +13.4%
- By 2075
- 3,321,723 · +16.7%
- By 2100
- 3,111,387 · +9.3%
Race, ethnicity, and origin ACS 2023
- Neighborhood character
- Predominantly Black (65%)
- Race & ethnicity
- Black 65% Hispanic / Latino 16% White 12% Two or more races 8% Asian 2%
- Hispanic origin (detail)
- Puerto Rican 5% Dominican 5%
- Common ancestry
- Hispanic 1% Romanian 1% Lithuanian 1%
- Foreign-born
- 25% · Canada, Mexico, China
- Languages at home
- 80% English-only · Spanish 12% French/Haitian/Cajun 3% Other Indo-European 1%
Political lean MEDSL · Kings
- 2024 margin
- Solid D (+44.0) · D 72.0% · R 28.0%
- 2008→2024 swing
- -15.5pp toward R · 2008: 59.4pp · 2024: 44.0pp
- All cycles
- 2024: D+44.0 2020: D+54.8 2016: D+61.8 2012: D+63.9 2008: D+59.4
Not yet ingested
- Civics
- —
Market trends
- HPI YoY
- ▲ 18.31%
- Current HPI
- 645.4828
- Rent YoY
- ▲ 6.44%
- Metro
- New York-Newark-Jersey City, NY-NJ-PA
- State GDP YoY
- ▲ 2.60%
- F500 in state
- 92
Industry mix (Fortune 500 HQ in NY)
| Industry | F500 HQs | Revenue |
|---|---|---|
| Financial Services | 10 | $950B |
|
||
| Consumer Goods | 9 | $162B |
|
||
| Insurance | 4 | $225B |
|
||
| Telecommunications | 2 | $144B |
|
||
| Pharmaceuticals | 2 | $112B |
|
||
| Media / Entertainment | 2 | $69B |
|
||
Price history
+591.0% since first listed16 events — show timeline
- 2026-04-13 Price Changed $1,374,999 OneKey® MLS as Distributed by MLS Grid
- 2026-03-05 Listed $1,399,999 OneKey® MLS as Distributed by MLS Grid
- 2022-12-13 Sold (Public Records) $1,124,000 Public Records
- 2022-06-30 Listed $1,275,000 RLS at REBNY
- 2022-03-15 Listed $1,275,000 RLS at REBNY
- 2021-08-13 Price Changed $1,377,000 RLS at REBNY
- 2021-06-24 Price Changed $1,397,000 RLS at REBNY
- 2021-06-04 Listed $1,488,000 RLS at REBNY
- 2021-06-04 Listed $1,377,000 RLS at REBNY
- 2019-09-09 Listing Removed — OneKey® MLS as Distributed by MLS Grid
- 2019-08-13 Price Changed $1,275,000 OneKey® MLS as Distributed by MLS Grid
- 2019-08-04 Price Changed $1,350,000 OneKey® MLS as Distributed by MLS Grid
- 2019-06-25 Listed $1,450,000 OneKey® MLS as Distributed by MLS Grid
- 2005-08-23 Sold (Public Records) $217,019 Public Records
- 2000-02-03 Sold (Public Records) $195,000 Public Records
- 1999-04-21 Listed $199,000 BNYMLS
Property tax history
+4.7%/yrLatest (2025): $3,593 · +3.0% YoY. Source: county tax records.
Cash-flow waterfall
monthlySold comps — $/sqft
last 12 mo · ≤1 miLoading sold comps…