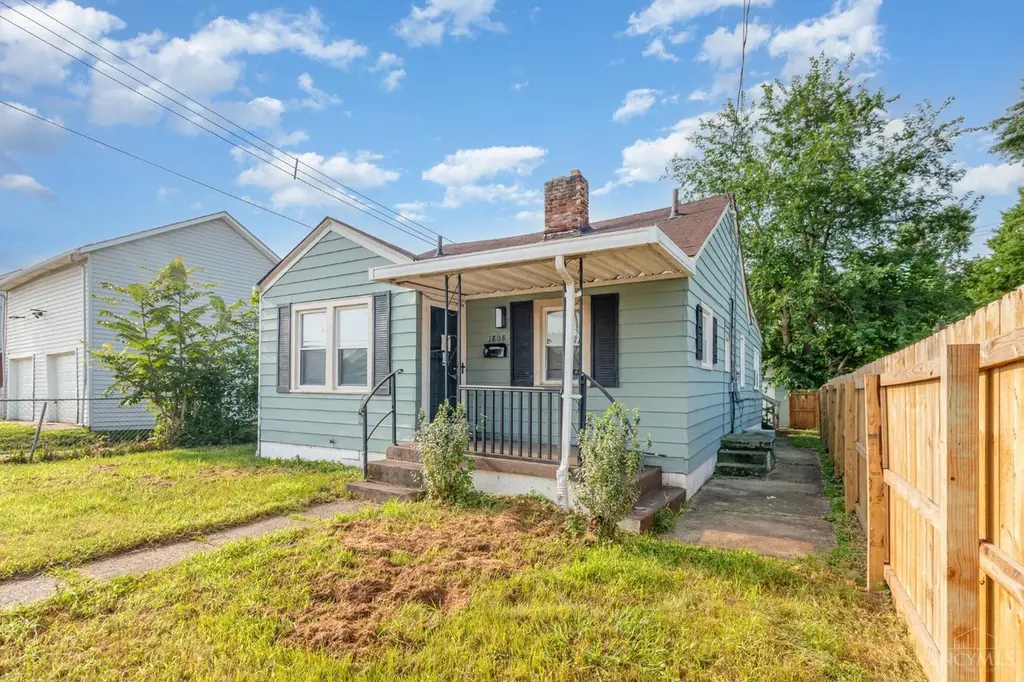
1808 Meadow Ave · Middletown, OH
Flood risk 1/10 · Minimal
- FEMA flood zone
- X (unshaded)
- Chance of flooding over 30 yrs
- 0.0%
- Est. flood insurance / yr
- $507 – $1,088
Fire risk 1/10 · Minimal
- Est. fire insurance / yr
- $713 – $1,323
Heat risk 4/10 · Minor
- Hot days now (above 103°F)
- 7 days/yr
- Hot days in 30 yrs
- 19 days/yr
Wind risk 2/10 · Minimal
- Chance of severe wind over 30 yrs
- 1.0%
Air-quality risk 3/10 · Minor
- Unhealthy air days now
- 2 days/yr
- Unhealthy air days in 30 yrs
- 3 days/yr
Risk factors via First Street. Map © Google.
Why this score? — see what drove the D+ grade
The composite is a weighted blend of 9 inputs, each scored 0–100. Each bar is that input's sub-score; the figure is the points it added to the 100-point composite (weight × sub-score).
- Cash flow +19.2/30.0
- DSCR +6.1/10.0
- 1% rule +4.9/10.0
- Rent growth +4.1/5.0
- ARV discount +3.8/15.0
- Livability +3.6/5.0
- Condition / age +2.5/5.0
- Schools +2.0/10.0
- Appreciation +0.0/10.0
$125,000
🖨 Deal sheet 📄 Offer letter ✓ Due diligence
Listing remarks MLS
SHORT SALE. Bank is willing to take less than is owed. Great value add opportunity. Property is winterized. Needs some work but overall in decent condition. Bathroom was recently remodeled. Use your skills to bring this property back to life.
Key facts
- 4,792 sq ft lot
- Built 1944
- Listed 157 days
Tags
Neighborhood map
What this means for you Summary
Snapshot
- This is a 2-bed/1.0-bath single-family listed at $125k.
Deal economics
- At list price, monthly cash flow is $136 ($2k/yr) — positive.
- The deal already cash-flows at list — no discount required.
- To meet the 1% rule (rent ≥ 1% of price), the offer needs to be $124k (0.8% below list).
- Recommended offer: $110k (12.0% below list) — sets the bar for market timing.
- Cap rate 7.6% vs local median 4.5% in Middletown — top-decile yield for the area; either an underpriced asset or a hidden risk that comps aren't pricing in. Stress-test before assuming the spread holds.
Location & tenants
- Location reads 72/100 on livability (#389 in OH) — a middle-class / working-renter tenant base. Strengths: cost of living A+, housing A+, health & safety A+; Watch: schools D+, crime D+, amenities D+.
- Middletown City (suburban): math 21% / reading 28% proficiency, ranked #610 of 656 in OH (top 93%) — low school quality limits family demand, transient renter base, plan for 1-2y turnover; 69% free/reduced lunch — lower-income household profile, screen leases tightly.
- Market conditions: Rents rising fast (+6.3%/yr); 203 active listings in the ZIP; 16 comparable units currently listed for rent nearby; rentals at typical pace (median 24d on market — plan ~3-4 weeks tenant-placement turnaround); 1,163 units permitted in Butler County in 2024 (356 in 5+ unit buildings).
Forward outlook
- Local home prices are declining (-3.0%/yr); year-one equity from $864 of loan paydown is wiped out by about $4k of value loss. Plan a longer hold.
Negotiation context
- It's been on market 157 days — a 12% lower offer ($110k) is reasonable based on typical stale-listing flexibility.
- 8 sale attempts since 21y ago with the ask held roughly flat each time — persistent listings suggest the price (not the market) is what's stuck; bring a comps-based counter.
Risks & watch-outs
- Watch-outs: built in 1944 — expect roof / HVAC / electrical / plumbing capex.
Questions for the listing agent
- It's been on market 157 days. Have you received any prior offers? Is the seller open to a 12% concession, seller financing, or rate buy-down credit?
- Built in 1944 — when were the roof, HVAC, electrical panel, plumbing, and water heater last replaced?
- Why hasn't it sold? Are there any deal-killer items the seller is aware of (foundation, flood, title, zoning, code violations)?
- Is there a deadline driving the sale (1031 exchange, divorce, estate, relocation)? That informs how much negotiation room exists.
- Schools are D-rated, which usually means shorter tenancies and higher turnover. Who's the typical renter profile here, and what's been the actual vacancy rate?
- Crime grade is D in this area — have there been break-ins, vandalism, or insurance claims at this property in the last 3 years? What carrier currently insures it and at what premium?
- The area grade is low — what's the realistic commute time and amenity access for the typical tenant pool here? Any planned neighborhood developments (good or bad) we should know about?
- What's the average days-on-market for RENTAL listings here right now (not sales)? A rising rental-DOM trend means longer vacancies and softer asking-rent achievability than the comps imply.
- What's the recent tenant-quality profile in this submarket — average credit score on applications, eviction rate, late-payment / NSF rate, and stable-employment percentage? A property-management company in the area should have these aggregated.
- How much new for-sale + rental construction is in the pipeline within 1–3 miles? Heavy new supply typically softens prices + rents 12–24 months out; constrained supply supports both.
Investment metrics
- 1% rule
- 0.99% ✗
- Cap rate
- 7.60%
- Cash-on-cash
- 4.67%
- DSCR
- 1.21
- GRM
- 8.4
CMA / ARV
- ARV (median comp)
- $115,413
- List price
- $125,000
- Delta
- 8.31%
- Verdict
- FAIR
- Comps
- 20 within 1.0 mi
Show comp detail 12 sales within ~0.75 mi
| Address | Dist | Beds/Ba | Sqft | Sold | Price | $/sf | Match |
|---|---|---|---|---|---|---|---|
| 2012 Pearl St | 0.15mi | 2/1.0 | 996 (-6%) | 7mo | $117,500 | $118 | 78 |
| 1621 Lafayette Ave | 0.20mi | 2/1.0 | 984 (-7%) | 3mo | $112,000 | $114 | 77 |
| 1507 Pershing Ave | 0.48mi | 3/1.0 (+1) | 1,064 (+1%) | 4mo | $173,900 | $163 | 68 |
| 1613 Sheridan Ave | 0.52mi | 3/1.0 (+1) | 1,050 (-1%) | 2mo | $150,000 | $143 | 68 |
| 2924 Seneca St | 0.68mi | 2/1.0 | 1,040 (-2%) | 2mo | $63,000 | $61 | 64 |
| 1717 Pershing Ave | 0.36mi | 2/1.0 | 972 (-8%) | 8mo | $127,000 | $131 | 63 |
| 1713 Lafayette Ave | 0.17mi | 2/1.0 | 912 (-14%) | 8mo | $80,000 | $88 | 63 |
| 2804 Yankee Rd | 0.41mi | 3/1.0 (+1) | 1,106 (+5%) | 7mo | $72,000 | $65 | 62 |
| 3007 Omaha St | 0.65mi | 3/1.5 (+1) | 1,049 (-1%) | 5mo | $180,000 | $172 | 58 |
| 1404 Young St | 0.70mi | 2/1.0 | 1,002 (-5%) | 7mo | $100,500 | $100 | 53 |
| 1702 Glenwood Ave | 0.47mi | 3/1.0 (+1) | 965 (-9%) | 8mo | $174,900 | $181 | 52 |
| 3106 Rufus St | 0.71mi | 3/1.0 (+1) | 1,164 (+10%) | 2mo | $164,900 | $142 | 43 |
Match score weights: distance 35% · size 25% · config 20% · recency 20%. Top-matched comps best support the ARV.
Projected returns pro-forma
-3.0% appreciation · 6.31% rent growth · sell at horizon
- IRR
- -5.4%
- Equity multiple
- 0.79×
- Total profit
- $-7,313
- Equity at exit
- $18,638
- IRR
- 7.7%
- Equity multiple
- 1.67×
- Total profit
- $23,566
- Equity at exit
- $10,808
Cash invested: $35,000 (down + closing). Projections, not guarantees.
Landlord ↔ Tenant lean methodology
- Overall (STATE)
- 73 Landlord-Friendly
- State Ohio
- 73 Landlord-Friendly · R+6
- County
- — inherits STATE
- City
- — inherits STATE
ZIP-level market 45044
- Rents YoY
- 6.3%
- Active inventory
- 203
- Price-to-rent
- 8.4×
Monthly cashflow live
- Estimated rent
- $1,240 high interval (Pro) →
- Mortgage (P&I)
- −$656
- Tax from tax record
- −$136 /mo · $1,633/yr
- Insurance
- −$52
- HOA
- −$0
- Vacancy / Maint / Mgmt
- −$260
- Net cashflow
- $136
Break-even live
UW: 25.0% down · 7.5% · 30yr · 1.5% tax · 5.0% vac · 8.0% maint · 8.0% mgmt
Financing live
Cash to close
- Down payment
- $31,250
- Closing costs
- $3,750
- Reserves months
- —
- Total cash needed
- —
Loan-product check · same deal, 3 products live
Conventional
25% down · 7.5% · 30yr
- Down + closing
- —
- Monthly P&I
- —
- Monthly cashflow
- —
- DSCR
- —
- Eligible?
- —
Personal DTI + credit; lowest rate.
DSCR
20% down · 8.5% · 30yr
- Down + closing
- —
- Monthly P&I
- —
- Monthly cashflow
- —
- DSCR
- —
- Eligible?
- —
No personal income docs; deal must DSCR.
Hard money
10% down · 12.0% · 12mo
- Down + closing
- —
- Monthly P&I
- —
- Monthly cashflow
- —
- DSCR
- —
- Eligible?
- —
Short-term bridge; refi at stabilization.
Rent comps 16 comps
| Address | Beds | Baths | Sqft | Rent | $/sqft | DOM | Units | Dist |
|---|---|---|---|---|---|---|---|---|
| 2000 Pearl St Middletown, OH | 2.0 | 1.0 | 900 | $3,500 | $3.89 | 1d | 4 | 0.19mi |
| 1409 Young St Unit 1 Middletown, OH | 1.0 | 1.0 | 1050 | $950 | $0.90 | 4d | 1 | 0.68mi |
| 1419 Oxford State Rd Middletown, OH | 2.0 | 1.0 | 900 | $2,495 | $2.77 | 1d | 1 | 0.92mi |
| 1804 Brentwood St Middletown, OH | 3.0 | 1.0 | 1044 | $1,430 | $1.37 | 23d | 1 | 1.04mi |
| 702 Baltimore St Middletown, OH | 2.0 | 1.0 | 848 | $895 | $1.06 | 43d | 1 | 1.05mi |
| 1109 Oxford State Rd Middletown, OH | 2.0 | 1.0 | 744 | $995 | $1.34 | 1d | 1 | 1.05mi |
| 1915 Woodlawn Ave Middletown, OH | 3.0 | 1.5 | 1060 | $1,550 | $1.46 | 43d | 1 | 1.13mi |
| 2101 S Main St Middletown, OH | 1.0–2.0 | 1.0 | 757 | $900 | $1.19 | 1d | 1 | 1.16mi |
| 2208 Woodlawn Ave Middletown, OH | 2.0 | 1.0 | 780 | $895 | $1.15 | 43d | 1 | 1.17mi |
| 2310 S Sutphin St Middletown, OH | 2.0 | 1.0 | 967 | $1,025 | $1.06 | 23d | 1 | 1.18mi |
| 3122 Beatrice Dr Middletown, OH | 3.0 | 1.0 | 1198 | $1,550 | $1.29 | 43d | 1 | 1.28mi |
| 2400 Sherman Ave Middletown, OH | 2.0 | 1.0 | 920 | $1,280 | $1.39 | 43d | 1 | 1.30mi |
| 907 8th Ave Middletown, OH | 3.0 | 1.5 | 1380 | $1,400 | $1.01 | 17d | 1 | 1.40mi |
| 3003 Grand Ave Middletown, OH | 2.0 | 1.0 | 928 | $1,050 | $1.13 | 10d | 1 | 1.45mi |
| 3003 Grand Ave Fl 1 Middletown, OH | 2.0 | 1.0 | 928 | $1,050 | $1.13 | 7d | 1 | 1.45mi |
| 3106 Grand Ave Unit 2 Middletown, OH | 2.0 | 1.0 | 918 | $925 | $1.01 | 43d | 1 | 1.48mi |
Listing history 42 events
-
2026-06-18days on market $125,000 Active 157 DOM
-
2026-06-17days on market $125,000 Active 156 DOM
-
2026-06-16days on market $125,000 Active 155 DOM
-
2026-06-15days on market $125,000 Active 154 DOM
-
2026-06-13days on market $125,000 Active 152 DOM
-
2026-06-09days on market $125,000 Active 148 DOM
-
2026-06-08days on market $125,000 Active 147 DOM
-
2026-06-07days on market $125,000 Active 146 DOM
-
2026-06-03days on market $125,000 Active 142 DOM
-
2026-06-02days on market $125,000 Active 141 DOM
-
2026-06-01days on market $125,000 Active 140 DOM
-
2026-05-31days on market $125,000 Active 139 DOM
-
2026-01-12$125,000 Active 248-char remark
Show marketing remark (248 chars)
SHORT SALE. Bank is willing to take less than is owed. Great value add opportunity. Property is winterized. Needs some work but overall in decent condition. Bathroom was recently remodeled. Use your skills to bring this property back to life.
-
2025-12-31historical 323-char remark
Show marketing remark (323 chars)
This home is waiting for you. fenced in and ready for any pets you may have. Take advantage of the openness of the kitchen with an easy transition to the dining room. Wonderfully large living room that all your guests will enjoy. Additional storage is located in the shed in the back. Parking is toward the back as well
-
2025-12-11price $130,000 323-char remark
Show marketing remark (323 chars)
This home is waiting for you. fenced in and ready for any pets you may have. Take advantage of the openness of the kitchen with an easy transition to the dining room. Wonderfully large living room that all your guests will enjoy. Additional storage is located in the shed in the back. Parking is toward the back as well
-
2025-07-30$145,000 Active 323-char remark
Show marketing remark (323 chars)
This home is waiting for you. fenced in and ready for any pets you may have. Take advantage of the openness of the kitchen with an easy transition to the dining room. Wonderfully large living room that all your guests will enjoy. Additional storage is located in the shed in the back. Parking is toward the back as well
-
2025-07-22historical
-
2025-02-11price $145,000
-
2025-01-22$150,000 Active
-
2024-02-14soldstatus $136,000
-
2024-02-07soldstatus $136,000 Sold
-
2024-02-07soldstatus $136,000 Closed
-
2024-02-07soldstatus $136,000 Closed
-
2024-01-12status Pending
-
2024-01-08status Pending
-
2023-12-19$139,900 Active
-
2023-12-15$139,900 Active
-
2016-02-02soldstatus $13,000 Sold
-
2016-01-29soldstatus $13,000 Closed
-
2016-01-29soldstatus $13,000 Sold
-
2015-11-19historical Accept Backup Offers
-
2015-11-19status Pending
-
2015-11-09price $16,500
-
2015-11-09price $16,500
-
2015-09-29$37,000 Active
-
2015-09-29$37,000 Active
-
2005-11-21soldstatus $32,500
-
2005-11-09soldstatus $32,500
-
2005-09-26$31,500
-
1999-09-10soldstatus $46,000
-
1998-01-29soldstatus $46,000
-
1993-07-09soldstatus $34,900
ⓘ Source: listings_history table (triggers on properties + properties_extension) + one-shot
backfill from property_details.listing_events for pre-trigger history.
Tax reassessment forecast OH · Partial reset (capped growth)
- Current annual tax
- $1,633 · $136/mo
- Projected year-2 tax
- $1,791 · $149/mo
- Expected delta
- +$159/yr (+$13/mo · 9.7%)
ⓘ Screening estimate from a state-policy table — verify with the county assessor before closing.
Climate risk First Street
- Flood 1/10 Low FEMA zone X (unshaded) · 0% chance over 30 yrs
- Wildfire 1/10 Low
- Heat 4/10 Moderate 7 d/yr ≥103°F today · 19 d/yr by 30 yrs out
- Wind 2/10 Low 100% chance of damaging wind over 30 yrs
- Air quality 3/10 Moderate 2 unhealthy d/yr today · 3 by 30 yrs out
Nearby sold comps map
Loading sold comps map…
Walkable amenities ~0.75 mi
Loading nearby amenities…
Taxation est. · year 1
- Rental income
- $14,883
- − Mortgage interest
- −$7,002
- − Property taxes
- −$1,633
- − Insurance
- −$625
- − Repairs & maintenance
- −$1,191
- − Management
- −$1,191
- − Depreciation
- −$3,636
- Taxable loss
- −$395
- Est. tax savings @ 24.0%
- +$95
- After-tax cash flow
- $1,728/yr
For passive investors: Depreciation is non-cash, so a rental often shows a tax loss while cash-flowing — sheltering income. Rental losses are passive: they offset passive income freely, and up to $25,000/yr can offset ordinary (W-2) income if you actively participate and your MAGI is under $100k (phasing out to $0 by $150k); unused losses carry forward. On sale, claimed depreciation is recaptured at up to 25%, and gains may owe capital-gains tax (a 1031 exchange can defer both). Figures are a year-1 estimate at your 24.0% rate — not tax advice; consult a CPA.
Schools (NCES district)
- District
- Middletown City
- NCES district ID
- 3904440
- Math proficiency
- 21% ▼ -17.00%
- Reading proficiency
- 28% ▼ -15.00%
- Median HH income
- $36,650
- Composite
- 20.35/100
- National rank
- #8605
- State rank
- #610 of 656 in OH
Livability — Middletown
- Score
- 72/100
- State rank
- #389
- US rank
- #6338
Category grades
Schools grade is shown separately in the Schools card above.
Census & demographics
- Census place
- Middletown, OH
- County
- Butler County · 381,674 people
- City population
- 96,117
- Metro
- Cincinnati, OH-KY-IN
- Population (ZIP)
- 56,217
- Household income
- $73,732
- Rent vs Own
- Severe rent burden
- 1532.0
Population outlook (Butler County) Hauer SSP2
- Today (2025)
- 387,706 people
- By 2030
- 392,028 · +1.1%
- By 2040
- 395,307 · +2.0%
- By 2050
- 391,116 · +0.9%
- By 2075
- 378,642 · -2.3%
- By 2100
- 343,248 · -11.5%
Race, ethnicity, and origin ACS 2023
- Neighborhood character
- Predominantly White (72%)
- Race & ethnicity
- White 72% Black 12% Two or more races 8% Hispanic / Latino 7% Asian 2%
- Hispanic origin (detail)
- Mexican 2% Dominican 1%
- Common ancestry
- Slovak 2% Italian 2% Romanian 2%
- Foreign-born
- 6% · Canada
- Languages at home
- 92% English-only · Spanish 4% Other Indo-European 1% Tagalog/Filipino 1%
Political lean MEDSL · Butler
- 2024 margin
- Strong R (+26.3) · D 36.4% · R 62.7%
- 2008→2024 swing
- -3.6pp toward R · 2008: -22.6pp · 2024: -26.3pp
- All cycles
- 2024: R+26.3 2020: R+24.0 2016: R+28.3 2012: R+26.2 2008: R+22.6
Not yet ingested
- Civics
- —
Market trends
- HPI YoY
- ▼ -164.07%
- Current HPI
- 219.0479
- Rent YoY
- ▲ 6.31%
- Metro
- Cincinnati, OH-KY-IN
- State GDP YoY
- ▲ 1.98%
- F500 in state
- 48
Industry mix (Fortune 500 HQ in OH)
| Industry | F500 HQs | Revenue |
|---|---|---|
| Insurance | 3 | $145B |
|
||
| Industrial Machinery | 3 | $49B |
|
||
| Financial Services | 3 | $24B |
|
||
| Consumer Goods | 2 | $93B |
|
||
| Aerospace / Defense | 2 | $47B |
|
||
| Utilities | 2 | $33B |
|
||
Price history
+258.2% since first listed30 events — show timeline
- 2026-01-12 Listed $125,000 Cincy MLS
- 2025-12-31 Listing Removed — Cincy MLS
- 2025-12-11 Price Changed $130,000 Cincy MLS
- 2025-07-30 Listed $145,000 Cincy MLS
- 2025-07-22 Listing Removed — Cincy MLS
- 2025-02-11 Price Changed $145,000 Cincy MLS
- 2025-01-22 Listed $150,000 Cincy MLS
- 2024-02-14 Sold (Public Records) $136,000 Public Records
- 2024-02-07 Sold (MLS) $136,000 Cincy MLS
- 2024-02-07 Sold (MLS) $136,000 Dayton MLS
- 2024-02-07 Sold (MLS) $136,000 Dayton MLS
- 2024-01-12 Pending — Cincy MLS
- 2024-01-08 Pending — Dayton MLS
- 2023-12-19 Listed $139,900 Dayton MLS
- 2023-12-15 Listed $139,900 Cincy MLS
- 2016-02-02 Sold (MLS) $13,000 Dayton MLS
- 2016-01-29 Sold (MLS) $13,000 Cincy MLS
- 2016-01-29 Sold (MLS) $13,000 Dayton MLS
- 2015-11-19 Contingent — Cincy MLS
- 2015-11-19 Pending — Dayton MLS
- 2015-11-09 Price Changed $16,500 Dayton MLS
- 2015-11-09 Price Changed $16,500 Cincy MLS
- 2015-09-29 Listed $37,000 Cincy MLS
- 2015-09-29 Listed $37,000 Dayton MLS
- 2005-11-21 Sold (Public Records) $32,500 Public Records
- 2005-11-09 Sold (MLS) $32,500 Cincy MLS
- 2005-09-26 Listed $31,500 Cincy MLS
- 1999-09-10 Sold (Public Records) $46,000 Public Records
- 1998-01-29 Sold (Public Records) $46,000 Public Records
- 1993-07-09 Sold (Public Records) $34,900 Public Records
Property tax history
+2.5%/yrLatest (2025): $1,633 · -1.3% YoY. Source: county tax records.
Cash-flow waterfall
monthlySold comps — $/sqft
last 12 mo · ≤1 miLoading sold comps…