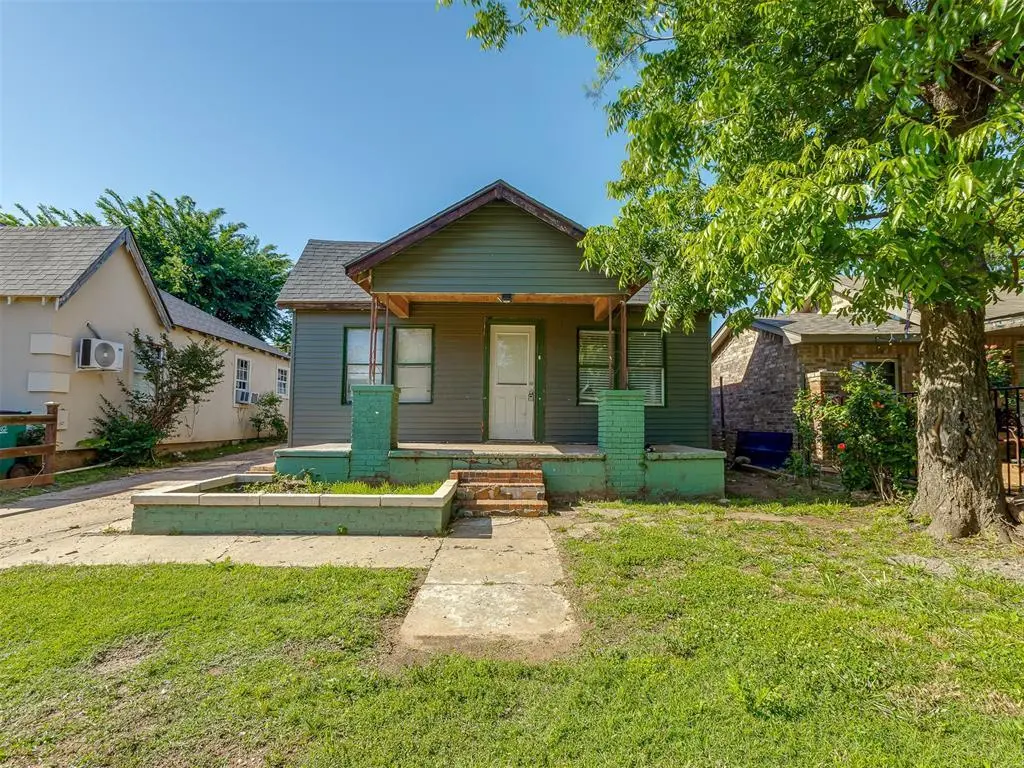
1426 SW 28th St · Oklahoma City, OK
Flood risk 1/10 · Minimal
- FEMA flood zone
- X (unshaded)
- Chance of flooding over 30 yrs
- 0.0%
- Est. flood insurance / yr
- $507 – $1,088
Fire risk 1/10 · Minimal
- Est. fire insurance / yr
- $2,463 – $4,575
Heat risk 6/10 · Moderate
- Hot days now (above 107°F)
- 7 days/yr
- Hot days in 30 yrs
- 19 days/yr
Wind risk 2/10 · Minimal
- Chance of severe wind over 30 yrs
- 4.0%
Air-quality risk 1/10 · Minimal
- Unhealthy air days now
- 0 days/yr
- Unhealthy air days in 30 yrs
- 0 days/yr
Risk factors via First Street. Map © Google.
Why this score? — see what drove the C grade
The composite is a weighted blend of 9 inputs, each scored 0–100. Each bar is that input's sub-score; the figure is the points it added to the 100-point composite (weight × sub-score).
- Cash flow +20.3/30.0
- ARV discount +11.0/15.0
- Appreciation +7.5/10.0
- DSCR +6.4/10.0
- 1% rule +4.6/10.0
- Livability +4.0/5.0
- Rent growth +2.5/5.0
- Condition / age +2.5/5.0
- Schools +0.7/10.0
$118,000
🖨 Deal sheet 📄 Offer letter ✓ Due diligence
Listing remarks MLS
Freddiemac/homesteps property. Selling in as is condition.......First iniative time period ends 6/18/2011......2yr HOW to owner occupant. Buyer to be responsible for a gas test and city inspection.
Key facts
- Hvac replaced
- Storage shed
- Roof replaced
Tags
Property features AI
Finance
- Other: Located in Industrial Add; Homestead not indicated; No storm shelter; Living area reported as 1,420 (assessor)
- Financial info: Property is existing; Assumable loan status: Unknown
- HOA & community: No mandatory association dues
Exterior
- Home design: Single family residence; One level; Property faces south; Residential property
- Construction: Brick exterior; Composition roof (roof updated 2024); Combination foundation
- Exterior features: Exterior storage; Interior lot
Interior
- Bedrooms: 3 bedrooms
- Bathrooms: 2 full bathrooms
- Heating & cooling: Electric heating
- Interior features: One living area; No fireplace; No in-law plan
Neighborhood map
What this means for you Summary
Snapshot
- This is a 3-bed/2.0-bath single-family listed at $118k.
Deal economics
- At list price, monthly cash flow is $150 ($2k/yr) — positive.
- The deal already cash-flows at list — no discount required.
- To meet the 1% rule (rent ≥ 1% of price), the offer needs to be $113k (4.5% below list).
- Recommended offer: $113k (4.5% below list) — sets the bar for 1% rule.
Location & tenants
- Location reads 80/100 on livability (#3 in OK, #1,635 nationally) — a professional / high-income tenant draw. Strengths: amenities A+, commute A+, cost of living A+; Watch: crime F.
- Oklahoma City (urban): math 7% / reading 10% proficiency, ranked #254 of 270 in OK (top 94%) — low school quality limits family demand, transient renter base, plan for 1-2y turnover; 82% free/reduced lunch — lower-income household profile, screen leases tightly.
- Zoned schools: Heronville Es (math 2% / reading 8%, grade F, #766 of 845 statewide, top 94%, 559 students, 0% FRL); Capitol Hill Hs (math 2% / reading 4%, grade F, #444 of 447 statewide, top 99%, 1,455 students, 0% FRL) — zoned schools average 0% FRL vs 82% district-wide (82 pts lower); this property's tenant base skews higher-income than the district average.
- Market conditions: 79 active listings in the ZIP; 18 comparable units currently listed for rent nearby; rentals leasing fast (median 12d on market — plan ~1-2 weeks tenant-placement turnaround); 5,365 units permitted in Oklahoma County in 2024 (569 in 5+ unit buildings).
Forward outlook
- In year one you build about $7k of equity ($816 loan paydown + $6k appreciation (4.9% local appreciation)).
- Oklahoma County population projected at +41% by 2050 — long-run rental-demand tailwind backs the buy-and-hold thesis.
- At projected returns (4.9% appreciation + 3.0% rent growth), your $33k cash investment doubles in ~4 years — after that, you're playing with house money.
- By year 6, paydown + projected appreciation supports a ~$36k cash-out refi (75% LTV) — recoverable capital for the next deal without selling this one.
Negotiation context
- It's been on market 33 days — a 3% lower offer ($114k) is reasonable based on typical stale-listing flexibility.
- 2 sale attempts since 15y ago; this cycle's ask has dropped $7k (6%) from the opening price — seller is motivated, your offer sets the floor, not the list.
- Current owner paid $90k; 31% above their basis — modest negotiation headroom, anchor on the comps not their cost.
Risks & watch-outs
- Watch-outs: built in 1950 — expect roof / HVAC / electrical / plumbing capex.
- Climate carrying-cost: extreme-heat days projected 7→19/yr by 2055 (HVAC capex compounding) — expect insurance premiums to compound above CPI over the hold.
Questions for the listing agent
- It's been on market 33 days. Have you received any prior offers? Is the seller open to a 4% concession, seller financing, or rate buy-down credit?
- Built in 1950 — when were the roof, HVAC, electrical panel, plumbing, and water heater last replaced?
- Is there a deadline driving the sale (1031 exchange, divorce, estate, relocation)? That informs how much negotiation room exists.
- Schools are F-rated, which usually means shorter tenancies and higher turnover. Who's the typical renter profile here, and what's been the actual vacancy rate?
- Crime grade is F in this area — have there been break-ins, vandalism, or insurance claims at this property in the last 3 years? What carrier currently insures it and at what premium?
- What's the average days-on-market for RENTAL listings here right now (not sales)? A rising rental-DOM trend means longer vacancies and softer asking-rent achievability than the comps imply.
- What's the recent tenant-quality profile in this submarket — average credit score on applications, eviction rate, late-payment / NSF rate, and stable-employment percentage? A property-management company in the area should have these aggregated.
- How much new for-sale + rental construction is in the pipeline within 1–3 miles? Heavy new supply typically softens prices + rents 12–24 months out; constrained supply supports both.
Investment metrics
- 1% rule
- 0.96% ✗
- Cap rate
- 7.82%
- Cash-on-cash
- 5.46%
- DSCR
- 1.24
- GRM
- 8.7
CMA / ARV
- ARV (on-the-fly)
- $127,800
- Comps found
- 12
Show comp detail 12 sales within ~0.75 mi
| Address | Dist | Beds/Ba | Sqft | Sold | Price | $/sf | Match |
|---|---|---|---|---|---|---|---|
| 1536 SW 28th St | 0.15mi | 3/2.0 | 1,360 (-4%) | 2mo | $234,000 | $172 | 84 |
| 1518 SW 28th St | 0.10mi | 3/2.0 | 1,315 (-7%) | 15mo | $118,000 | $90 | 70 |
| 1400 SW 27th St | 0.10mi | 3/2.0 | 1,537 (+8%) | 15mo | $75,000 | $49 | 69 |
| 1141 SW Binkley St | 0.41mi | 3/1.0 | 1,450 (+2%) | 7mo | $160,000 | $110 | 67 |
| 1437 SW 36th St | 0.52mi | 3/2.0 | 1,520 (+7%) | 1mo | $107,500 | $71 | 63 |
| 1033 SW Binkley St | 0.53mi | 3/1.0 | 1,342 (-6%) | 6mo | $190,000 | $142 | 58 |
| 1433 SW 34th St | 0.40mi | 3/2.0 | 1,270 (-11%) | 8mo | $85,000 | $67 | 57 |
| 2221 SW 24th St | 0.58mi | 3/2.0 | 1,275 (-10%) | 2mo | $215,000 | $169 | 54 |
| 3225 S Douglas Ave | 0.50mi | 3/2.0 | 1,260 (-11%) | 6mo | $175,000 | $139 | 53 |
| 1129 SW 35th St | 0.61mi | 2/1.0 (-1) | 1,322 (-7%) | 1mo | $85,000 | $64 | 51 |
| 1413 Reding Dr | 0.71mi | 3/1.0 | 1,329 (-6%) | 10mo | $106,900 | $80 | 44 |
| 1633 SW Binkley St | 0.34mi | 2/1.5 (-1) | 1,230 (-13%) | 22mo | $70,000 | $57 | 37 |
Match score weights: distance 35% · size 25% · config 20% · recency 20%. Top-matched comps best support the ARV.
Projected returns pro-forma
4.94% appreciation · 3.0% rent growth · sell at horizon
- IRR
- 17.4%
- Equity multiple
- 2.10×
- Total profit
- $36,320
- Equity at exit
- $66,420
- IRR
- 17.6%
- Equity multiple
- 4.08×
- Total profit
- $101,688
- Equity at exit
- $114,262
Cash invested: $33,040 (down + closing). Projections, not guarantees.
Landlord ↔ Tenant lean methodology
- Overall (STATE)
- 83 Strongly Landlord-Friendly
- State Oklahoma
- 83 Strongly Landlord-Friendly · R+20
- County
- — inherits STATE
- City
- — inherits STATE
ZIP-level market 73108
- Home prices YoY
- 1.7%
- Active inventory
- 79
- Price-to-rent
- 8.7×
Monthly cashflow live
- Estimated rent
- $1,127 high interval (Pro) →
- Mortgage (P&I)
- −$619
- Tax from tax record
- −$72 /mo · $869/yr
- Insurance
- −$49
- HOA
- −$0
- Vacancy / Maint / Mgmt
- −$237
- Net cashflow
- $150
Break-even live
UW: 25.0% down · 7.5% · 30yr · 1.5% tax · 5.0% vac · 8.0% maint · 8.0% mgmt
Financing live
Cash to close
- Down payment
- $29,500
- Closing costs
- $3,540
- Reserves months
- —
- Total cash needed
- —
Loan-product check · same deal, 3 products live
Conventional
25% down · 7.5% · 30yr
- Down + closing
- —
- Monthly P&I
- —
- Monthly cashflow
- —
- DSCR
- —
- Eligible?
- —
Personal DTI + credit; lowest rate.
DSCR
20% down · 8.5% · 30yr
- Down + closing
- —
- Monthly P&I
- —
- Monthly cashflow
- —
- DSCR
- —
- Eligible?
- —
No personal income docs; deal must DSCR.
Hard money
10% down · 12.0% · 12mo
- Down + closing
- —
- Monthly P&I
- —
- Monthly cashflow
- —
- DSCR
- —
- Eligible?
- —
Short-term bridge; refi at stabilization.
Rent comps 18 comps
| Address | Beds | Baths | Sqft | Rent | $/sqft | DOM | Units | Dist |
|---|---|---|---|---|---|---|---|---|
| 1345 SW 27th St Oklahoma City, OK | 3.0 | 2.0 | 1153 | $1,095 | $0.95 | 2d | 1 | 0.15mi |
| 2140 SW 35th St Oklahoma City, OK | 3.0 | 2.0 | 976 | $1,300 | $1.33 | 43d | 1 | 0.62mi |
| 1132 SW 40th St Oklahoma City, OK | 3.0 | 2.0 | 1436 | $1,350 | $0.94 | 23d | 1 | 0.92mi |
| 900 Hangar Dr Oklahoma City, OK | 2.0 | 1.0–2.0 | 743 | $2,075 | $2.79 | 1d | 37 | 0.95mi |
| 4330 S Barnes Ave Oklahoma City, OK | 1.0–3.0 | 1.0–2.0 | 860 | $1,099 | $1.28 | 4d | 9 | 1.03mi |
| 1416 S Daugherty Ave Oklahoma City, OK | 3.0 | 1.0 | 1164 | $1,120 | $0.96 | 11d | 1 | 1.11mi |
| 3407 S Lee Ave Oklahoma City, OK | 2.0 | 1.0 | 900 | $980 | $1.09 | 43d | 1 | 1.14mi |
| 1632 Birch St Oklahoma City, OK | 2.0 | 1.0 | 935 | $775 | $0.83 | 2d | 1 | 1.16mi |
| 2640 SW 38th St Oklahoma City, OK | 3.0 | 2.0 | 944 | $1,050 | $1.11 | 2d | 1 | 1.18mi |
| 1802 Exchange Ave Oklahoma City, OK | 2.0 | 1.0 | 1312 | $875 | $0.67 | 43d | 1 | 1.20mi |
| 1802 Exchange Ave Unit 1802 Oklahoma City, OK | 2.0 | 1.0 | 1312 | $875 | $0.67 | 3d | 1 | 1.20mi |
| 1616 Linden St Oklahoma City, OK | 3.0 | 1.5 | 1175 | $975 | $0.83 | 23d | 1 | 1.24mi |
| 2612 SW 41st St Oklahoma City, OK | 3.0 | 1.0 | 1164 | $1,200 | $1.03 | 23d | 1 | 1.25mi |
| 2921 SW 28th St Oklahoma City, OK | 3.0 | 1.0 | 1125 | $1,490 | $1.32 | 43d | 1 | 1.33mi |
| 4426 S Olie Ave Oklahoma City, OK | 2.0 | 2.0 | 1159 | $1,220 | $1.05 | 11d | 1 | 1.37mi |
| 632 SW 44th St Oklahoma City, OK | 2.0 | 1.0 | 958 | $1,000 | $1.04 | 4d | 1 | 1.47mi |
| 624 SW 44th St Oklahoma City, OK | 2.0 | 1.0 | 1206 | $1,500 | $1.24 | 43d | 1 | 1.48mi |
| 2922 SW 19th St Oklahoma City, OK | 3.0 | 1.0 | 1056 | $1,350 | $1.28 | 2d | 1 | 1.49mi |
Listing history 17 events
-
2026-06-18days on market $118,000 Active 33 DOM
-
2026-06-17days on market $118,000 Active 32 DOM
-
2026-06-16days on market $118,000 Active 31 DOM
-
2026-06-15days on market $118,000 Active 30 DOM
-
2026-06-13days on market $118,000 Active 28 DOM
-
2026-06-09days on market $118,000 Active 24 DOM
-
2026-06-08days on market $118,000 Active 23 DOM
-
2026-06-07days on market $118,000 Active 22 DOM
-
2026-06-05days on market $118,000 Active 19 DOM
-
2026-06-03days on market $118,000 Active 18 DOM
-
2026-06-02days on market $118,000 Active 17 DOM
-
2026-06-01days on market $118,000 Active 16 DOM
-
2026-05-31days on market $118,000 Active 15 DOM
-
2026-05-16$124,999 Active
-
2026-03-05soldstatus $90,000
-
2011-07-15soldstatus $15,550 199-char remark
Show marketing remark (199 chars)
Freddiemac/homesteps property. Selling in as is condition.......First iniative time period ends 6/18/2011......2yr HOW to owner occupant. Buyer to be responsible for a gas test and city inspection.
-
2011-06-03$15,000 199-char remark
Show marketing remark (199 chars)
Freddiemac/homesteps property. Selling in as is condition.......First iniative time period ends 6/18/2011......2yr HOW to owner occupant. Buyer to be responsible for a gas test and city inspection.
ⓘ Source: listings_history table (triggers on properties + properties_extension) + one-shot
backfill from property_details.listing_events for pre-trigger history.
Tax reassessment forecast OK · Resets to sale price
- Current annual tax
- $869 · $72/mo
- Projected year-2 tax
- $1,062 · $88/mo
- Expected delta
- +$193/yr (+$16/mo · 22.2%)
ⓘ Screening estimate from a state-policy table — verify with the county assessor before closing.
Climate risk First Street
- Flood 1/10 Low FEMA zone X (unshaded) · 0% chance over 30 yrs
- Wildfire 1/10 Low
- Heat 6/10 Major 7 d/yr ≥107°F today · 19 d/yr by 30 yrs out
- Wind 2/10 Low 4% chance of damaging wind over 30 yrs
- Air quality 1/10 Low 0 unhealthy d/yr today · 0 by 30 yrs out
Nearby sold comps map
Loading sold comps map…
Walkable amenities ~0.75 mi
Loading nearby amenities…
Taxation est. · year 1
- Rental income
- $13,530
- − Mortgage interest
- −$6,610
- − Property taxes
- −$869
- − Insurance
- −$590
- − Repairs & maintenance
- −$1,082
- − Management
- −$1,082
- − Depreciation
- −$3,433
- Taxable loss
- −$136
- Est. tax savings @ 24.0%
- +$33
- After-tax cash flow
- $1,837/yr
For passive investors: Depreciation is non-cash, so a rental often shows a tax loss while cash-flowing — sheltering income. Rental losses are passive: they offset passive income freely, and up to $25,000/yr can offset ordinary (W-2) income if you actively participate and your MAGI is under $100k (phasing out to $0 by $150k); unused losses carry forward. On sale, claimed depreciation is recaptured at up to 25%, and gains may owe capital-gains tax (a 1031 exchange can defer both). Figures are a year-1 estimate at your 24.0% rate — not tax advice; consult a CPA.
Schools (NCES district)
- District
- Oklahoma City
- NCES district ID
- 4022770
- Math proficiency
- 7% ▼ -5.00%
- Reading proficiency
- 10% ▼ -6.00%
- Median HH income
- $35,606
- Composite
- 7.0/100
- National rank
- #9970
- State rank
- #254 of 270 in OK
Livability — Oklahoma City
- Score
- 80/100
- State rank
- #3
- US rank
- #1635
Category grades
Schools grade is shown separately in the Schools card above.
Census & demographics
- Census place
- Oklahoma City, OK
- City population
- 498,656
- Population (ZIP)
- 15,239
Population outlook (Oklahoma County) Hauer SSP2
- Today (2025)
- 911,875 people
- By 2030
- 982,413 · +7.7%
- By 2040
- 1,130,468 · +24.0%
- By 2050
- 1,288,422 · +41.3%
- By 2075
- 1,711,482 · +87.7%
- By 2100
- 2,088,448 · +129.0%
Race, ethnicity, and origin ACS 2023
- Neighborhood character
- Majority Hispanic (65%)
- Race & ethnicity
- Hispanic / Latino 65% Two or more races 28% White 20% Black 8% Native American 7%
- Hispanic origin (detail)
- Mexican 59% Puerto Rican 1%
- Common ancestry
- Italian 1%
- Foreign-born
- 27% · Canada
- Languages at home
- 46% English-only · Spanish 52%
Political lean MEDSL · Oklahoma
- 2024 margin
- Toss-up / Even · D 48.0% · R 49.7% · Other 2.3%
- 2008→2024 swing
- +15.1pp toward D · 2008: -16.8pp · 2024: -1.7pp
- All cycles
- 2024: R+1.7 2020: R+1.1 2016: R+10.5 2012: R+16.7 2008: R+16.8
Not yet ingested
- Civics
- —
Market trends
- HPI YoY
- ▲ 4.94%
- Current HPI
- 293.2571
- Rent YoY
- —
- Metro
- —
- State GDP YoY
- ▲ 1.55%
- F500 in state
- 6
Industry mix (Fortune 500 HQ in OK)
| Industry | F500 HQs | Revenue |
|---|---|---|
| Energy | 3 | $48B |
|
||
Price history
+733.3% since first listed4 events — show timeline
- 2026-05-16 Listed $124,999 MLSOK
- 2026-03-05 Sold (Public Records) $90,000 Public Records
- 2011-07-15 Sold (MLS) $15,550 MLSOK
- 2011-06-03 Listed $15,000 MLSOK
Property tax history
+2.9%/yrLatest (2025): $869 · +4.4% YoY. Source: county tax records.
Cash-flow waterfall
monthlySold comps — $/sqft
last 12 mo · ≤1 miLoading sold comps…