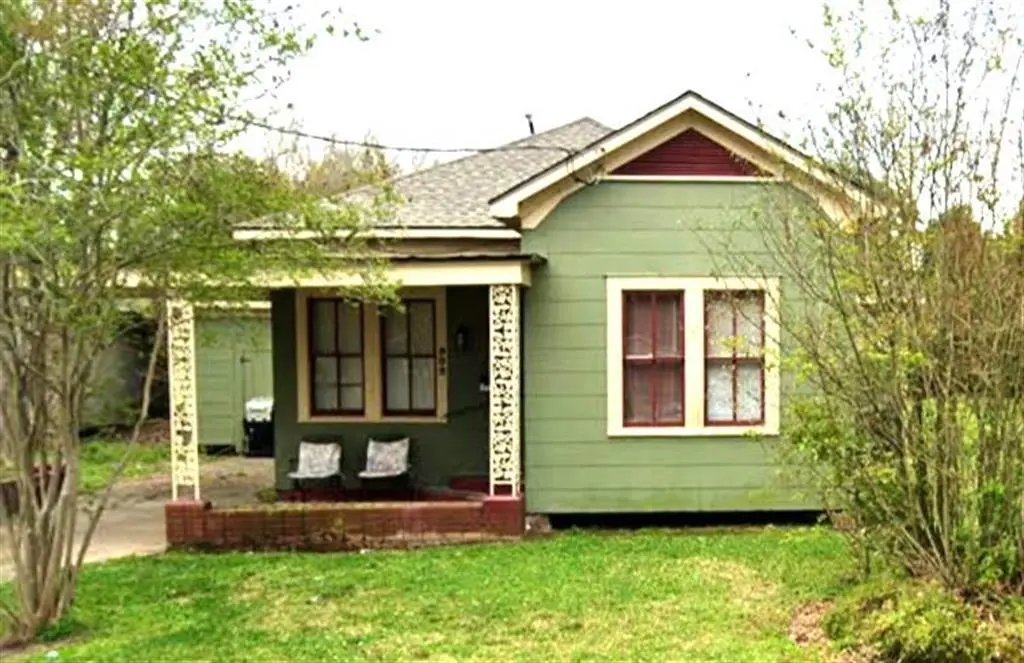
902 Live Oak St · Lake Charles, LA
Flood risk 1/10 · Minimal
- FEMA flood zone
- X (unshaded)
- Chance of flooding over 30 yrs
- 0.0%
- Est. flood insurance / yr
- $507 – $1,088
Fire risk 1/10 · Minimal
- Est. fire insurance / yr
- $1,269 – $2,357
Heat risk 9/10 · Severe
- Hot days now (above 109°F)
- 7 days/yr
- Hot days in 30 yrs
- 22 days/yr
Wind risk 9/10 · Severe
- Chance of severe wind over 30 yrs
- 99.0%
Air-quality risk 2/10 · Minimal
- Unhealthy air days now
- 1 days/yr
- Unhealthy air days in 30 yrs
- 1 days/yr
Risk factors via First Street. Map © Google.
Why this score? — see what drove the B+ grade
The composite is a weighted blend of 9 inputs, each scored 0–100. Each bar is that input's sub-score; the figure is the points it added to the 100-point composite (weight × sub-score).
- Cash flow +30.0/30.0
- ARV discount +15.0/15.0
- DSCR +10.0/10.0
- 1% rule +9.7/10.0
- Rent growth +4.0/5.0
- Livability +3.4/5.0
- Schools +3.1/10.0
- Condition / age +2.5/5.0
- Appreciation +0.0/10.0
$95,000
🖨 Deal sheet 📄 Offer letter ✓ Due diligence
Listing remarks MLS
Situated in the heart of Lake Charles, this home offers solid bones and tons of potential on a generously sized lot. While it could benefit from a little TLC and cosmetic updates, it is in overall good condition—making it an ideal option for investors or buyers looking to add value without starting from scratch. Whether you're searching for your next rental property, light renovation project, or a home with room to grow, this property offers a great combination of location, condition, and opportunity.
Key facts
- Solid bones
- Room to grow
- Generously sized lot
Tags
Neighborhood map
What this means for you Summary
Snapshot
- This is a 2-bed/2.0-bath single-family listed at $95k.
Deal economics
- At list price, monthly cash flow is $548 ($7k/yr) — positive.
- The deal already cash-flows at list — no discount required.
- Meets the 1% rule at list price ($1k rent vs $95k).
- Recommended offer: $89k (6.0% below list) — sets the bar for market timing.
- Cap rate 13.2% vs local median 4.3% in Lake Charles — top-decile yield for the area; either an underpriced asset or a hidden risk that comps aren't pricing in. Stress-test before assuming the spread holds.
Location & tenants
- Location reads 68/100 on livability (#95 in LA) — a middle-class / working-renter tenant base. Strengths: commute A+, cost of living A+, housing A+; Watch: crime F, amenities F, employment D-.
- Calcasieu Parish (other): math 30% / reading 44% proficiency, ranked #29 of 98 in LA (top 30%) — families likely to look elsewhere, expect single-tenant / working-renter base with shorter leases.
- Market conditions: Rents rising fast (+6.2%/yr); 363 active listings in the ZIP; 14 comparable units currently listed for rent nearby; rentals lingering (median 44d on market — plan ~5-8 weeks vacancy on turnover, expect pricing pressure); 57% of comp listings sitting > 30 days — soft ceiling on asking rent; 1,298 units permitted in Calcasieu Parish in 2024 (526 in 5+ unit buildings).
- This rent runs 34% of the median local income ($50k/yr) — at the standard rent-burdened threshold; future hikes will face affordability resistance.
Forward outlook
- Local home prices are declining (-3.0%/yr); year-one equity from $657 of loan paydown is wiped out by about $3k of value loss. Plan a longer hold.
- Calcasieu County population projected at +11% by 2050 — modest demand growth; plan on rents tracking national, not racing it.
- At projected returns (-3.0% appreciation + 6.2% rent growth), your $27k cash investment doubles in ~5 years — after that, you're playing with house money.
Negotiation context
- It's been on market 84 days — a 6% lower offer ($89k) is reasonable based on typical stale-listing flexibility.
- 2 sale attempts since 3y ago; this cycle's ask has dropped $5k (5%) from the opening price — seller is motivated, your offer sets the floor, not the list.
- Current owner paid $55k; list at $95k implies a 73% gain — meaningful room to come down on a strong offer.
Risks & watch-outs
- Climate carrying-cost: severe wind risk, 99% chance of damaging wind over 30y; extreme-heat days projected 7→22/yr by 2055 (HVAC capex compounding) — expect insurance premiums to compound above CPI over the hold.
Questions for the listing agent
- It's been on market 84 days. Have you received any prior offers? Is the seller open to a 6% concession, seller financing, or rate buy-down credit?
- Built in 1962 — when were the roof, HVAC, electrical panel, plumbing, and water heater last replaced?
- Why hasn't it sold? Are there any deal-killer items the seller is aware of (foundation, flood, title, zoning, code violations)?
- Is there a deadline driving the sale (1031 exchange, divorce, estate, relocation)? That informs how much negotiation room exists.
- Schools are B-rated — typically a magnet for longer-tenancy family renters. What's the average tenant stay here, and is there a school-zone premium baked into asking?
- Crime grade is F in this area — have there been break-ins, vandalism, or insurance claims at this property in the last 3 years? What carrier currently insures it and at what premium?
- What's the average days-on-market for RENTAL listings here right now (not sales)? A rising rental-DOM trend means longer vacancies and softer asking-rent achievability than the comps imply.
- What's the recent tenant-quality profile in this submarket — average credit score on applications, eviction rate, late-payment / NSF rate, and stable-employment percentage? A property-management company in the area should have these aggregated.
- How much new for-sale + rental construction is in the pipeline within 1–3 miles? Heavy new supply typically softens prices + rents 12–24 months out; constrained supply supports both.
Investment metrics
- 1% rule
- 1.47% ✓
- Cap rate
- 13.21%
- Cash-on-cash
- 24.72%
- DSCR
- 2.10
- GRM
- 5.7
CMA / ARV
- ARV (median comp)
- $141,863
- List price
- $95,000
- Delta
- -33.03%
- Verdict
- UNDERPRICED
- Comps
- 20 within 1.0 mi
Show comp detail 12 sales within ~0.75 mi
| Address | Dist | Beds/Ba | Sqft | Sold | Price | $/sf | Match |
|---|---|---|---|---|---|---|---|
| 903 14th St | 0.09mi | 3/2.0 (+1) | 1,850 (+12%) | 1mo | $43,500 | $24 | 71 |
| 1713 Moss St | 0.55mi | 3/1.5 (+1) | 1,635 (-1%) | 4mo | $206,000 | $126 | 62 |
| 1404 Dautel St | 0.46mi | 3/2.0 (+1) | 1,523 (-8%) | 1mo | $75,000 | $49 | 59 |
| 806 Live Oak St | 0.04mi | 3/1.0 (+1) | 1,430 (-14%) | 10mo | $147,500 | $103 | 58 |
| 810 Gulf St | 0.52mi | 3/2.0 (+1) | 1,575 (-5%) | 6mo | $125,000 | $79 | 57 |
| 1410 Louisiana Ave | 0.75mi | 3/2.0 (+1) | 1,700 (+2%) | 3mo | $264,900 | $156 | 53 |
| 1319 9th St | 0.62mi | 3/2.0 (+1) | 1,736 (+5%) | 12mo | $222,000 | $128 | 48 |
| 612 9th St | 0.53mi | 3/2.0 (+1) | 1,527 (-8%) | 15mo | $152,500 | $100 | 45 |
| 2708 1st Ave | 0.52mi | 3/1.0 (+1) | 1,519 (-8%) | 14mo | $71,500 | $47 | 41 |
| 606 Alamo St | 0.55mi | 3/2.0 (+1) | 1,450 (-12%) | 11mo | $154,000 | $106 | 39 |
| 1522 Kirkman St | 0.67mi | 3/1.0 (+1) | 1,510 (-9%) | 15mo | $218,950 | $145 | 32 |
| 1226 7th St | 0.70mi | 3/1.0 (+1) | 1,446 (-13%) | 11mo | $142,000 | $98 | 28 |
Match score weights: distance 35% · size 25% · config 20% · recency 20%. Top-matched comps best support the ARV.
Projected returns pro-forma
-3.0% appreciation · 6.18% rent growth · sell at horizon
- IRR
- 21.4%
- Equity multiple
- 1.91×
- Total profit
- $24,086
- Equity at exit
- $14,165
- IRR
- 31.4%
- Equity multiple
- 4.23×
- Total profit
- $85,996
- Equity at exit
- $8,214
Cash invested: $26,600 (down + closing). Projections, not guarantees.
Landlord ↔ Tenant lean methodology
- Overall (STATE)
- 90 Strongly Landlord-Friendly
- State Louisiana
- 90 Strongly Landlord-Friendly · R+12
- County
- — inherits STATE
- City
- — inherits STATE
ZIP-level market 70601
- Rents YoY
- 6.2%
- Active inventory
- 363
- Price-to-rent
- 5.7×
Monthly cashflow live
- Estimated rent
- $1,400 high interval (Pro) →
- Mortgage (P&I)
- −$498
- Tax from tax record
- −$20 /mo · $243/yr
- Insurance
- −$40
- HOA
- −$0
- Vacancy / Maint / Mgmt
- −$294
- Net cashflow
- $548
Break-even live
UW: 25.0% down · 7.5% · 30yr · 1.5% tax · 5.0% vac · 8.0% maint · 8.0% mgmt
Financing live
Cash to close
- Down payment
- $23,750
- Closing costs
- $2,850
- Reserves months
- —
- Total cash needed
- —
Loan-product check · same deal, 3 products live
Conventional
25% down · 7.5% · 30yr
- Down + closing
- —
- Monthly P&I
- —
- Monthly cashflow
- —
- DSCR
- —
- Eligible?
- —
Personal DTI + credit; lowest rate.
DSCR
20% down · 8.5% · 30yr
- Down + closing
- —
- Monthly P&I
- —
- Monthly cashflow
- —
- DSCR
- —
- Eligible?
- —
No personal income docs; deal must DSCR.
Hard money
10% down · 12.0% · 12mo
- Down + closing
- —
- Monthly P&I
- —
- Monthly cashflow
- —
- DSCR
- —
- Eligible?
- —
Short-term bridge; refi at stabilization.
Rent comps 14 comps
| Address | Beds | Baths | Sqft | Rent | $/sqft | DOM | Units | Dist |
|---|---|---|---|---|---|---|---|---|
| 1300 16th St Lake Charles, LA | 2.0 | 1.5 | 1344 | $1,295 | $0.96 | 21d | 1 | 0.40mi |
| 1710 Granger St Lake Charles, LA | 3.0 | 2.5 | 1450 | $1,900 | $1.31 | 43d | 1 | 0.68mi |
| 1731 Elms St Lake Charles, LA | 3.0 | 2.0 | 1575 | $2,000 | $1.27 | 43d | 1 | 0.82mi |
| 1505 7th St Lake Charles, LA | 2.0 | 1.0 | 1054 | $900 | $0.85 | 43d | 1 | 0.84mi |
| 3206 Hodges St Lake Charles, LA | 2.0 | 1.0 | 1497 | $1,200 | $0.80 | 43d | 1 | 0.84mi |
| 3108 Aster St Unit M Lake Charles, LA | 2.0 | 1.0 | 1100 | $1,300 | $1.18 | 13d | 1 | 0.85mi |
| 125 East St Lake Charles, LA | 3.0 | 2.0 | 1138 | $3,850 | $3.38 | 43d | 1 | 0.85mi |
| 1812 Ethel St Lake Charles, LA | 3.0 | 2.0 | 1589 | $3,850 | $2.42 | 43d | 1 | 0.89mi |
| 2700 Ernest St Lake Charles, LA | 1.0–3.0 | 1.0–2.0 | 1054 | $1,333 | $1.26 | 13d | 1 | 0.96mi |
| 807 Camelia St Lake Charles, LA | 3.0 | 1.0 | 1322 | $1,500 | $1.13 | 43d | 1 | 1.08mi |
| 114 W Lagrange St Apt 18 Lake Charles, LA | 2.0 | 1.0 | 1200 | $1,300 | $1.08 | 21d | 1 | 1.23mi |
| 617 E School St Unit A Lake Charles, LA | 3.0 | 2.0 | 1800 | $2,500 | $1.39 | 43d | 1 | 1.31mi |
| 3601 1st Ave Lake Charles, LA | 3.0 | 2.0 | 1512 | $1,295 | $0.86 | 13d | 1 | 1.35mi |
| 3619 Texas St Lake Charles, LA | 1.0–3.0 | 1.0–2.0 | 950 | $994 | $1.05 | 13d | 6 | 1.47mi |
Listing history 23 events
-
2026-06-19days on market $95,000 Active 84 DOM
-
2026-06-18days on market $95,000 Active 83 DOM
-
2026-06-17days on market $95,000 Active 82 DOM
-
2026-06-16days on market $95,000 Active 81 DOM
-
2026-06-15days on market $95,000 Active 80 DOM
-
2026-06-14days on market $95,000 Active 78 DOM
-
2026-06-13days on market $95,000 Active 77 DOM
-
2026-06-10days on market $95,000 Active 75 DOM
-
2026-06-09days on market $95,000 Active 74 DOM
-
2026-06-08days on market $95,000 Active 73 DOM
-
2026-06-07days on market $95,000 Active 72 DOM
-
2026-06-05pricedays on market $95,000 Active 69 DOM
-
2026-06-02days on market $100,000 Active 67 DOM
-
2026-06-01days on market $100,000 Active 66 DOM
-
2026-05-31days on market $100,000 Active 65 DOM
-
2026-05-30days on market $100,000 Active 64 DOM
-
2026-03-27$100,000 Active 512-char remark
Show marketing remark (512 chars)
Situated in the heart of Lake Charles, this home offers solid bones and tons of potential on a generously sized lot. While it could benefit from a little TLC and cosmetic updates, it is in overall good condition—making it an ideal option for investors or buyers looking to add value without starting from scratch. Whether you're searching for your next rental property, light renovation project, or a home with room to grow, this property offers a great combination of location, condition, and opportunity.
-
2023-09-15historical $750
-
2023-09-08price $750
-
2023-07-12price $795
-
2023-04-04soldstatus 271-char remark
Show marketing remark (271 chars)
This pristine 2 bedroom, 2 bath you will not want to miss! This home has all the change of your "Garden District Homes" but at an affordable price. And centrally located to everything in Lake Charles. Call to make your appointment today, before you're too late!
-
2023-01-27$92,000 271-char remark
Show marketing remark (271 chars)
This pristine 2 bedroom, 2 bath you will not want to miss! This home has all the change of your "Garden District Homes" but at an affordable price. And centrally located to everything in Lake Charles. Call to make your appointment today, before you're too late!
-
2021-05-06soldstatus $55,000
ⓘ Source: listings_history table (triggers on properties + properties_extension) + one-shot
backfill from property_details.listing_events for pre-trigger history.
Tax reassessment forecast LA · Resets to sale price
- Current annual tax
- $243 · $20/mo
- Projected year-2 tax
- $522 · $44/mo
- Expected delta
- +$280/yr (+$23/mo · 115.4%)
ⓘ Screening estimate from a state-policy table — verify with the county assessor before closing.
Climate risk First Street
- Flood 1/10 Low FEMA zone X (unshaded) · 0% chance over 30 yrs
- Wildfire 1/10 Low
- Heat 9/10 Extreme 7 d/yr ≥109°F today · 22 d/yr by 30 yrs out
- Wind 9/10 Extreme 99% chance of damaging wind over 30 yrs
- Air quality 2/10 Low 1 unhealthy d/yr today · 1 by 30 yrs out
Nearby sold comps map
Loading sold comps map…
Walkable amenities ~0.75 mi
Loading nearby amenities…
Taxation est. · year 1
- Rental income
- $16,799
- − Mortgage interest
- −$5,321
- − Property taxes
- −$243
- − Insurance
- −$475
- − Repairs & maintenance
- −$1,344
- − Management
- −$1,344
- − Depreciation
- −$2,764
- Taxable income
- $5,308
- Est. tax owed @ 24.0%
- −$1,274
- After-tax cash flow
- $5,301/yr
For passive investors: Depreciation is non-cash, so a rental often shows a tax loss while cash-flowing — sheltering income. Rental losses are passive: they offset passive income freely, and up to $25,000/yr can offset ordinary (W-2) income if you actively participate and your MAGI is under $100k (phasing out to $0 by $150k); unused losses carry forward. On sale, claimed depreciation is recaptured at up to 25%, and gains may owe capital-gains tax (a 1031 exchange can defer both). Figures are a year-1 estimate at your 24.0% rate — not tax advice; consult a CPA.
Schools (NCES district)
- District
- Calcasieu Parish
- NCES district ID
- 2200330
- Math proficiency
- 30% ▼ -39.00%
- Reading proficiency
- 44% ▼ -33.00%
- Median HH income
- $44,700
- Composite
- 31.45/100
- National rank
- #5979
- State rank
- #29 of 98 in LA
Livability — Lake Charles
- Score
- 68/100
- State rank
- #95
- US rank
- #9820
Category grades
Schools grade is shown separately in the Schools card above.
Census & demographics
- Census place
- Lake Charles, LA
- County
- Calcasieu Parish · 170,889 people
- City population
- 133,538
- Metro
- Lake Charles, LA
- Population (ZIP)
- 30,872
- Household income
- $49,992
- Rent vs Own
- Severe rent burden
- 1304.0
Population outlook (Calcasieu County) Hauer SSP2
- Today (2025)
- 212,179 people
- By 2030
- 218,199 · +2.8%
- By 2040
- 228,486 · +7.7%
- By 2050
- 236,208 · +11.3%
- By 2075
- 251,696 · +18.6%
- By 2100
- 247,848 · +16.8%
Race, ethnicity, and origin ACS 2023
- Neighborhood character
- Diverse neighborhood (Simpson 0.55)
- Race & ethnicity
- Black 59% White 31% Two or more races 7% Hispanic / Latino 5%
- Common ancestry
- Lithuanian 7% Iranian 1% Serbian 1%
- Foreign-born
- 3% · Canada
- Languages at home
- 95% English-only · Spanish 2% French/Haitian/Cajun 1%
Political lean MEDSL · Calcasieu
- 2024 margin
- Solid R (+39.6) · D 29.5% · R 69.0% · Other 1.5%
- 2008→2024 swing
- -15.0pp toward R · 2008: -24.6pp · 2024: -39.6pp
- All cycles
- 2024: R+39.6 2020: R+35.2 2016: R+33.3 2012: R+28.7 2008: R+24.6
Not yet ingested
- Civics
- —
Market trends
- HPI YoY
- ▼ -109.32%
- Current HPI
- 55.6127
- Rent YoY
- ▲ 6.18%
- Metro
- Lake Charles, LA
- State GDP YoY
- ▲ 3.29%
- F500 in state
- 10
Industry mix (Fortune 500 HQ in LA)
| Industry | F500 HQs | Revenue |
|---|---|---|
| Telecommunications | 2 | $23B |
|
||
| Utilities | 1 | $12B |
|
||
| Wholesale / Distribution | 1 | $5B |
|
||
| Advertising | 1 | $2B |
|
||
Price history
+81.8% since first listed7 events — show timeline
- 2026-03-27 Listed $100,000 SWLAR
- 2023-09-15 Rental Removed $750 APPFOLIO
- 2023-09-08 Price Changed $750 APPFOLIO
- 2023-07-12 Price Changed $795 APPFOLIO
- 2023-04-04 Sold (MLS) — SWLAR
- 2023-01-27 Listed $92,000 SWLAR
- 2021-05-06 Sold (Public Records) $55,000 Public Records
Property tax history
-6.5%/yrLatest (2025): $243 · +1.3% YoY. Source: county tax records.
Cash-flow waterfall
monthlySold comps — $/sqft
last 12 mo · ≤1 miLoading sold comps…