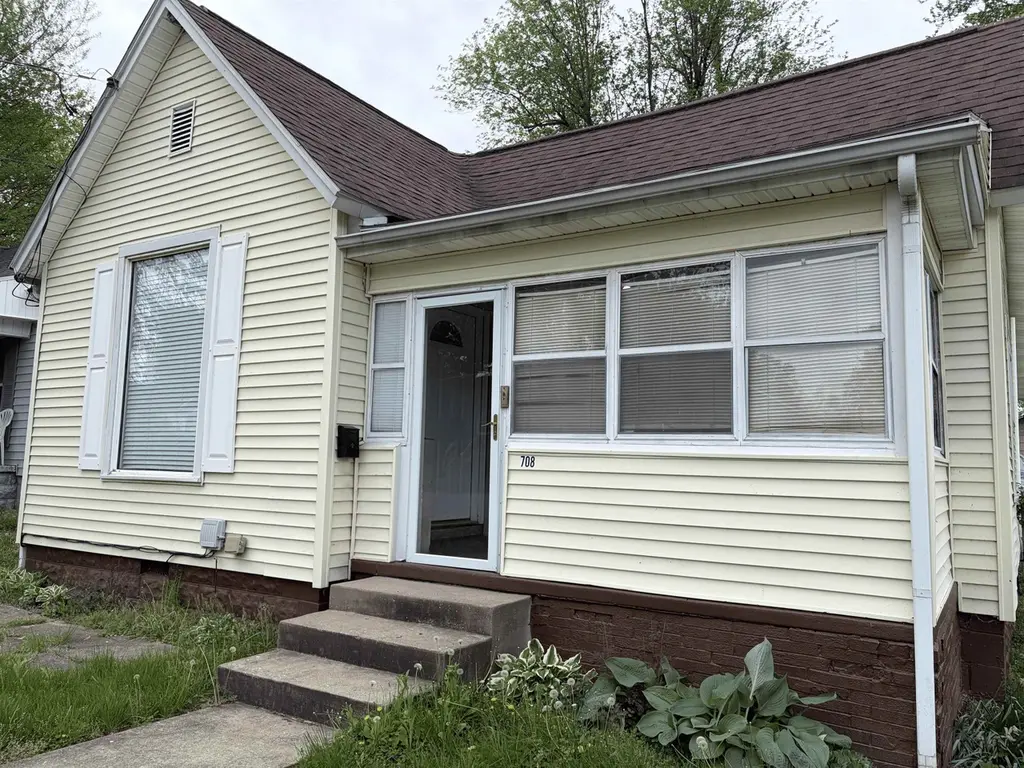
708 Plum St · Henderson, KY
Flood risk 1/10 · Minimal
- FEMA flood zone
- X (unshaded)
- Chance of flooding over 30 yrs
- 0.0%
- Est. flood insurance / yr
- $507 – $1,088
Fire risk 1/10 · Minimal
- Est. fire insurance / yr
- $839 – $1,559
Heat risk 5/10 · Moderate
- Hot days now (above 107°F)
- 7 days/yr
- Hot days in 30 yrs
- 19 days/yr
Wind risk 3/10 · Minor
- Chance of severe wind over 30 yrs
- 5.0%
Air-quality risk 3/10 · Minor
- Unhealthy air days now
- 2 days/yr
- Unhealthy air days in 30 yrs
- 3 days/yr
Risk factors via First Street. Map © Google.
Why this score? — see what drove the C- grade
The composite is a weighted blend of 9 inputs, each scored 0–100. Each bar is that input's sub-score; the figure is the points it added to the 100-point composite (weight × sub-score).
- Cash flow +21.5/30.0
- ARV discount +7.5/15.0
- DSCR +6.8/10.0
- 1% rule +4.4/10.0
- Livability +3.7/5.0
- Schools +3.4/10.0
- Rent growth +2.5/5.0
- Condition / age +2.5/5.0
- Appreciation +0.0/10.0
$124,777
🖨 Deal sheet 📄 Offer letter ✓ Due diligence
Listing remarks MLS
Home has been totally remodeled within the past 8 years. New kitchen with all new cabinets and appliances. Bath has large walk-in shower. New flooring in entire home.
Key facts
- New kitchen
- Totally remodeled
- New flooring
Tags
Neighborhood map
What this means for you Summary
Snapshot
- This is a 3-bed/1.0-bath single-family listed at $125k.
Deal economics
- At list price, monthly cash flow is $186 ($2k/yr) — positive.
- The deal already cash-flows at list — no discount required.
- To meet the 1% rule (rent ≥ 1% of price), the offer needs to be $117k (6.2% below list).
- Recommended offer: $117k (6.2% below list) — sets the bar for 1% rule.
Location & tenants
- Location reads 74/100 on livability (#114 in KY, #4,949 nationally) — a middle-class / working-renter tenant base. Strengths: cost of living A+, housing A+, health & safety A+; Watch: employment D, amenities F, commute F.
- Henderson County (suburban): math 40% / reading 41% proficiency, ranked #29 of 165 in KY (top 18%) — families likely to look elsewhere, expect single-tenant / working-renter base with shorter leases.
- Market conditions: 228 active listings in the ZIP; 92 units permitted in Henderson County in 2024 (0 in 5+ unit buildings).
Forward outlook
- Local home prices are declining (-3.0%/yr); year-one equity from $863 of loan paydown is wiped out by about $4k of value loss. Plan a longer hold.
- Henderson County population projected to shrink 5% by 2050 — rents likely to lag national; underwrite the cash flow, not the appreciation.
Negotiation context
- Only 14 days on market — expect competitive offers; lowballing is unlikely to land.
- 2 sale attempts with the ask held roughly flat each time — persistent listings suggest the price (not the market) is what's stuck; bring a comps-based counter.
Risks & watch-outs
- Watch-outs: built in 1905 — expect roof / HVAC / electrical / plumbing capex.
- Climate carrying-cost: extreme-heat days projected 7→19/yr by 2055 (HVAC capex compounding) — expect insurance premiums to compound above CPI over the hold.
Questions for the listing agent
- Built in 1905 — when were the roof, HVAC, electrical panel, plumbing, and water heater last replaced?
- Is there a deadline driving the sale (1031 exchange, divorce, estate, relocation)? That informs how much negotiation room exists.
- What's the average days-on-market for RENTAL listings here right now (not sales)? A rising rental-DOM trend means longer vacancies and softer asking-rent achievability than the comps imply.
- What's the recent tenant-quality profile in this submarket — average credit score on applications, eviction rate, late-payment / NSF rate, and stable-employment percentage? A property-management company in the area should have these aggregated.
- How much new for-sale + rental construction is in the pipeline within 1–3 miles? Heavy new supply typically softens prices + rents 12–24 months out; constrained supply supports both.
Investment metrics
- 1% rule
- 0.94% ✗
- Cap rate
- 8.08%
- Cash-on-cash
- 6.40%
- DSCR
- 1.28
- GRM
- 8.9
CMA / ARV
No comps found within radius.
Projected returns pro-forma
-3.0% appreciation · 3.0% rent growth · sell at horizon
- IRR
- -6.5%
- Equity multiple
- 0.76×
- Total profit
- $-8,413
- Equity at exit
- $18,605
- IRR
- 3.1%
- Equity multiple
- 1.22×
- Total profit
- $7,714
- Equity at exit
- $10,788
Cash invested: $34,938 (down + closing). Projections, not guarantees.
Landlord ↔ Tenant lean methodology
- Overall (STATE)
- 83 Strongly Landlord-Friendly
- State Kentucky
- 83 Strongly Landlord-Friendly · R+16
- County
- — inherits STATE
- City
- — inherits STATE
ZIP-level market 42420
- Home prices YoY
- -31.6%
- Active inventory
- 228
- Price-to-rent
- 8.9×
Monthly cashflow live
- Estimated rent
- $1,170 medium interval (Pro) →
- Mortgage (P&I)
- −$654
- Tax from tax record
- −$32 /mo · $382/yr
- Insurance
- −$52
- HOA
- −$0
- Vacancy / Maint / Mgmt
- −$246
- Net cashflow
- $186
Break-even live
UW: 25.0% down · 7.5% · 30yr · 1.5% tax · 5.0% vac · 8.0% maint · 8.0% mgmt
Financing live
Cash to close
- Down payment
- $31,194
- Closing costs
- $3,743
- Reserves months
- —
- Total cash needed
- —
Loan-product check · same deal, 3 products live
Conventional
25% down · 7.5% · 30yr
- Down + closing
- —
- Monthly P&I
- —
- Monthly cashflow
- —
- DSCR
- —
- Eligible?
- —
Personal DTI + credit; lowest rate.
DSCR
20% down · 8.5% · 30yr
- Down + closing
- —
- Monthly P&I
- —
- Monthly cashflow
- —
- DSCR
- —
- Eligible?
- —
No personal income docs; deal must DSCR.
Hard money
10% down · 12.0% · 12mo
- Down + closing
- —
- Monthly P&I
- —
- Monthly cashflow
- —
- DSCR
- —
- Eligible?
- —
Short-term bridge; refi at stabilization.
Listing history 4 events
-
2026-05-18status Pending 166-char remark
Show marketing remark (166 chars)
Home has been totally remodeled within the past 8 years. New kitchen with all new cabinets and appliances. Bath has large walk-in shower. New flooring in entire home.
-
2026-05-07status Active 166-char remark
Show marketing remark (166 chars)
Home has been totally remodeled within the past 8 years. New kitchen with all new cabinets and appliances. Bath has large walk-in shower. New flooring in entire home.
-
2026-04-23status Pending 166-char remark
Show marketing remark (166 chars)
Home has been totally remodeled within the past 8 years. New kitchen with all new cabinets and appliances. Bath has large walk-in shower. New flooring in entire home.
-
2026-04-17$124,777 Active 166-char remark
Show marketing remark (166 chars)
Home has been totally remodeled within the past 8 years. New kitchen with all new cabinets and appliances. Bath has large walk-in shower. New flooring in entire home.
ⓘ Source: listings_history table (triggers on properties + properties_extension) + one-shot
backfill from property_details.listing_events for pre-trigger history.
Tax reassessment forecast KY · Resets to sale price
- Current annual tax
- $382 · $32/mo
- Projected year-2 tax
- $1,073 · $89/mo
- Expected delta
- +$692/yr (+$58/mo · 181.2%)
ⓘ Screening estimate from a state-policy table — verify with the county assessor before closing.
Climate risk First Street
- Flood 1/10 Low FEMA zone X (unshaded) · 0% chance over 30 yrs
- Wildfire 1/10 Low
- Heat 5/10 Major 7 d/yr ≥107°F today · 19 d/yr by 30 yrs out
- Wind 3/10 Moderate 5% chance of damaging wind over 30 yrs
- Air quality 3/10 Moderate 2 unhealthy d/yr today · 3 by 30 yrs out
Nearby sold comps map
Loading sold comps map…
Walkable amenities ~0.75 mi
Loading nearby amenities…
Taxation est. · year 1
- Rental income
- $14,042
- − Mortgage interest
- −$6,989
- − Property taxes
- −$382
- − Insurance
- −$624
- − Repairs & maintenance
- −$1,123
- − Management
- −$1,123
- − Depreciation
- −$3,630
- Taxable income
- $170
- Est. tax owed @ 24.0%
- −$41
- After-tax cash flow
- $2,195/yr
For passive investors: Depreciation is non-cash, so a rental often shows a tax loss while cash-flowing — sheltering income. Rental losses are passive: they offset passive income freely, and up to $25,000/yr can offset ordinary (W-2) income if you actively participate and your MAGI is under $100k (phasing out to $0 by $150k); unused losses carry forward. On sale, claimed depreciation is recaptured at up to 25%, and gains may owe capital-gains tax (a 1031 exchange can defer both). Figures are a year-1 estimate at your 24.0% rate — not tax advice; consult a CPA.
Schools (NCES district)
- District
- Henderson County
- NCES district ID
- 2102710
- Math proficiency
- 40% ▼ -19.00%
- Reading proficiency
- 41% ▼ -16.00%
- Median HH income
- $41,772
- Composite
- 34.13/100
- National rank
- #5285
- State rank
- #29 of 165 in KY
Livability — Henderson
- Score
- 74/100
- State rank
- #114
- US rank
- #4949
Category grades
Schools grade is shown separately in the Schools card above.
Census & demographics
- Census place
- Henderson, KY
- Population (ZIP)
- 38,434
Population outlook (Henderson County) Hauer SSP2
- Today (2025)
- 46,910 people
- By 2030
- 46,841 · -0.1%
- By 2040
- 46,018 · -1.9%
- By 2050
- 44,390 · -5.4%
- By 2075
- 40,442 · -13.8%
- By 2100
- 33,538 · -28.5%
Race, ethnicity, and origin ACS 2023
- Neighborhood character
- Predominantly White (83%)
- Race & ethnicity
- White 83% Black 8% Two or more races 5% Hispanic / Latino 4%
- Common ancestry
- Slovak 2% Romanian 1% Italian 1%
- Foreign-born
- 1% · Canada
- Languages at home
- 97% English-only · Spanish 2%
Political lean MEDSL · Henderson
- 2024 margin
- Strong R (+29.2) · D 34.7% · R 64.0% · Other 1.3%
- 2008→2024 swing
- -31.9pp toward R · 2008: 2.6pp · 2024: -29.2pp
- All cycles
- 2024: R+29.2 2020: R+24.6 2016: R+27.7 2012: R+11.8 2008: D+2.6
Not yet ingested
- Civics
- —
Market trends
- HPI YoY
- ▼ -95.69%
- Current HPI
- 207.5676
- Rent YoY
- —
- Metro
- —
- State GDP YoY
- ▲ 1.81%
- F500 in state
- 4
Industry mix (Fortune 500 HQ in KY)
| Industry | F500 HQs | Revenue |
|---|---|---|
| Healthcare | 1 | $118B |
|
||
| Food / Beverage | 1 | $7B |
|
||
Price history
4 events — show timeline
- 2026-05-18 Pending — HABOR
- 2026-05-07 Relisted — HABOR
- 2026-04-23 Pending — HABOR
- 2026-04-17 Listed $124,777 HABOR
Property tax history
+2.6%/yrLatest (2024): $382 · -1.1% YoY. Source: county tax records.
Cash-flow waterfall
monthlySold comps — $/sqft
last 12 mo · ≤1 miLoading sold comps…