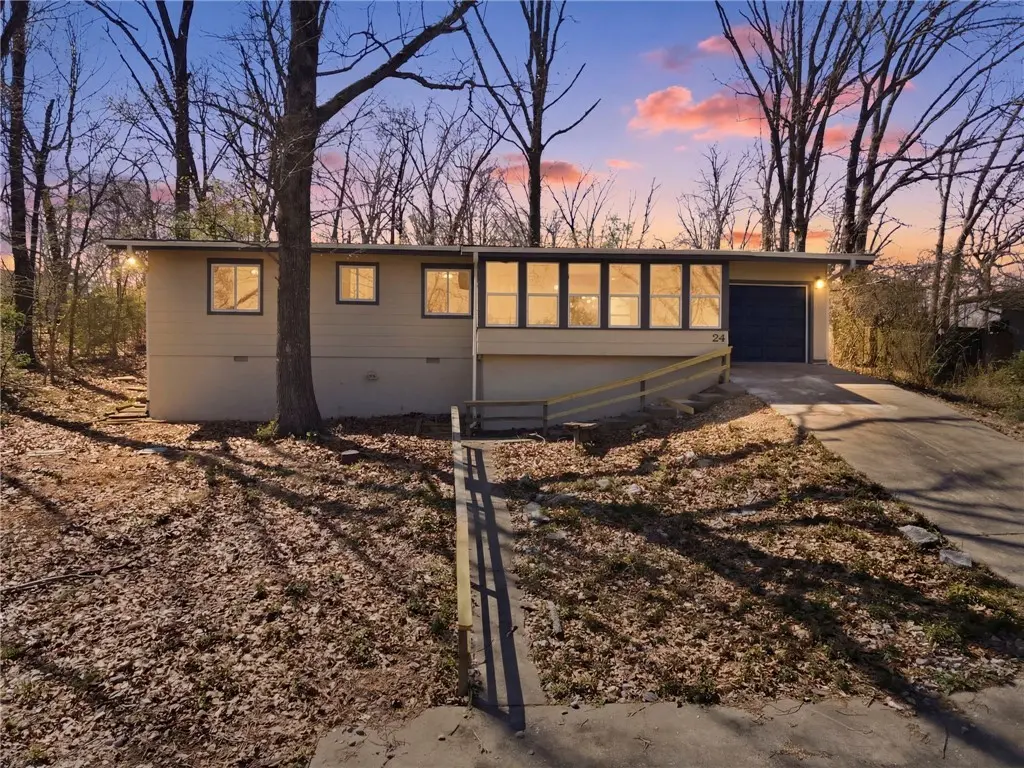
24 Tamworth Cir · Bella Vista, AR
Flood risk 1/10 · Minimal
- FEMA flood zone
- X (unshaded)
- Chance of flooding over 30 yrs
- 0.0%
- Est. flood insurance / yr
- $507 – $1,088
Fire risk 3/10 · Minor
- Est. fire insurance / yr
- $1,499 – $2,785
Heat risk 4/10 · Minor
- Hot days now (above 105°F)
- 7 days/yr
- Hot days in 30 yrs
- 20 days/yr
Wind risk 2/10 · Minimal
- Chance of severe wind over 30 yrs
- 2.0%
Air-quality risk 2/10 · Minimal
- Unhealthy air days now
- 0 days/yr
- Unhealthy air days in 30 yrs
- 1 days/yr
Risk factors via First Street. Map © Google.
Why this score? — see what drove the F grade
The composite is a weighted blend of 9 inputs, each scored 0–100. Each bar is that input's sub-score; the figure is the points it added to the 100-point composite (weight × sub-score).
- Cash flow +13.5/30.0
- Schools +5.2/10.0
- DSCR +4.1/10.0
- Livability +3.4/5.0
- 1% rule +2.9/10.0
- Rent growth +2.5/5.0
- Condition / age +2.5/5.0
- ARV discount +0.5/15.0
- Appreciation +0.0/10.0
$269,000
🖨 Deal sheet (PDF) 📄 Offer letter ✓ Due diligence
Listing remarks MLS
Lake Avalon living, walking distance to entrance of Lake Avalon Dam area. Lot slopes in front and then levels out nicely, close to all amenities of Bella Vista.
Key facts
- Quartz countertops
- Lake views
- New lvp floors
Tags
Property features AI
Finance
- HOA & community: Bella Vista POA with monthly fees; HOA covers grounds and structure maintenance; Community amenities include golf, tennis courts, trails/paths, park, and pool
Exterior
- Parking: Garage door opener
- Security: Smoke detector(s)
- Utilities: Electricity available; Natural gas available; Public water; Recycling collection
- Home design: Single-story home; Faces northeast; Residential zoning; Entry on main level
- Construction: Masonite siding; Metal roof; Crawlspace foundation; Built 25+ years ago
- Exterior features: Concrete driveway; Patio; City lot near park in a subdivision; Public paved road frontage; Community pool
Interior
- Kitchen: Electric range; Microwave; Range hood; Disposal; Plumbed for ice maker
- Flooring: Luxury vinyl plank; Tile
- Bathrooms: 2 full bathrooms
- Heating & cooling: Central heating; Central air conditioning
- Interior features: Ceiling fan(s); Programmable thermostat; Quartz counters; Sunroom; Double-pane vinyl windows
- Laundry & utility: Washer hookup; Dryer hookup; Gas water heater
Neighborhood map
What this means for you Summary
Snapshot
- This is a 3-bed/1.5-bath single-family listed at $269k.
Deal economics
- At list price, monthly cash flow is $11 ($133/yr) — positive.
- The deal already cash-flows at list — no discount required.
- To meet the 1% rule (rent ≥ 1% of price), the offer needs to be $212k (21.2% below list).
- Recommended offer: $212k (21.2% below list) — sets the bar for 1% rule.
- Cap rate 6.3% vs local median 3.6% in Bella Vista — top-decile yield for the area; either an underpriced asset or a hidden risk that comps aren't pricing in. Stress-test before assuming the spread holds.
Location & tenants
- Location reads 67/100 on livability (#111 in AR) — a middle-class / working-renter tenant base. Strengths: cost of living A+, housing A+, schools A; Watch: amenities F, commute F, health & safety F.
- Bentonville School District (urban): math 59% / reading 59% proficiency, ranked #3 of 238 in AR (top 1%) — acceptable for families but not a draw, mixed tenant base, ~2y average lease.
- Market conditions: 838 active listings in the ZIP; 5 comparable units currently listed for rent nearby; rentals at typical pace (median 16d on market — plan ~3-4 weeks tenant-placement turnaround); solid renter incomes; 4,359 units permitted in Benton County in 2024 (402 in 5+ unit buildings).
- This rent runs 31% of the median local income ($82k/yr) — at the standard rent-burdened threshold; future hikes will face affordability resistance.
Forward outlook
- Local home prices are declining (-3.0%/yr); year-one equity from $2k of loan paydown is wiped out by about $8k of value loss. Plan a longer hold.
- Benton County population projected at +56% by 2050 — long-run rental-demand tailwind backs the buy-and-hold thesis.
Negotiation context
- It's been on market 47 days — a 3% lower offer ($261k) is reasonable based on typical stale-listing flexibility.
- 4 sale attempts since 13y ago with the ask held roughly flat each time — persistent listings suggest the price (not the market) is what's stuck; bring a comps-based counter.
- Current owner paid $55k; list at $269k implies a 389% gain — meaningful room to come down on a strong offer.
Questions for the listing agent
- It's been on market 47 days. Have you received any prior offers? Is the seller open to a 21% concession, seller financing, or rate buy-down credit?
- Is there a deadline driving the sale (1031 exchange, divorce, estate, relocation)? That informs how much negotiation room exists.
- Schools are A-rated — typically a magnet for longer-tenancy family renters. What's the average tenant stay here, and is there a school-zone premium baked into asking?
- The area grade is low — what's the realistic commute time and amenity access for the typical tenant pool here? Any planned neighborhood developments (good or bad) we should know about?
- What's the average days-on-market for RENTAL listings here right now (not sales)? A rising rental-DOM trend means longer vacancies and softer asking-rent achievability than the comps imply.
- What's the recent tenant-quality profile in this submarket — average credit score on applications, eviction rate, late-payment / NSF rate, and stable-employment percentage? A property-management company in the area should have these aggregated.
- How much new for-sale + rental construction is in the pipeline within 1–3 miles? Heavy new supply typically softens prices + rents 12–24 months out; constrained supply supports both.
Investment metrics
- 1% rule
- 0.79% ✗
- Cap rate
- 6.34%
- Cash-on-cash
- 0.18%
- DSCR
- 1.01
- GRM
- 10.6
CMA / ARV
- ARV (on-the-fly)
- $232,944
- Comps found
- 12
Show comp detail 12 sales within ~0.75 mi
| Address | Dist | Beds/Ba | Sqft | Sold | Price | $/sf | Match |
|---|---|---|---|---|---|---|---|
| 20 Cromer Dr | 0.52mi | 2/1.5 (-1) | 1,132 (+2%) | 2mo | $234,000 | $207 | 65 |
| 18 Duvall Ln | 0.37mi | 2/2.0 (-1) | 1,152 (+4%) | 6mo | $250,000 | $217 | 64 |
| 11 Duvall Ln | 0.39mi | 3/2.0 | 1,152 (+4%) | 12mo | $280,000 | $243 | 62 |
| 8 Basore Dr | 0.58mi | 2/1.0 (-1) | 1,132 (+2%) | 3mo | $183,500 | $162 | 59 |
| 3 Holt Ln | 0.46mi | 2/2.0 (-1) | 1,164 (+5%) | 5mo | $235,000 | $202 | 58 |
| 32 Gillingham Dr | 0.37mi | 2/2.0 (-1) | 1,015 (-8%) | 7mo | $225,000 | $222 | 56 |
| 24 Burnham Dr | 0.67mi | 2/2.0 (-1) | 1,108 (+0%) | 7mo | $242,000 | $218 | 55 |
| 24 Cromer Dr | 0.50mi | 2/1.0 (-1) | 992 (-10%) | 1mo | $209,000 | $211 | 52 |
| 4 Rea Cir | 0.70mi | 3/2.0 | 1,200 (+9%) | 9mo | $295,000 | $246 | 43 |
| 8 Pratt Ln | 0.69mi | 2/1.5 (-1) | 1,024 (-7%) | 9mo | $190,000 | $186 | 43 |
| 4 Orr Ln | 0.70mi | 2/1.0 (-1) | 1,050 (-5%) | 11mo | $215,000 | $205 | 43 |
| 9 Billingsley Dr | 0.74mi | 2/1.0 (-1) | 1,056 (-4%) | 12mo | $189,900 | $180 | 41 |
Match score weights: distance 35% · size 25% · config 20% · recency 20%. Top-matched comps best support the ARV.
Projected returns pro-forma
-3.0% appreciation · 3.0% rent growth · sell at horizon
- IRR
- -16.1%
- Equity multiple
- 0.43×
- Total profit
- $-42,970
- Equity at exit
- $40,109
- IRR
- -7.8%
- Equity multiple
- 0.51×
- Total profit
- $-36,864
- Equity at exit
- $23,258
Cash invested: $75,320 (down + closing). Projections, not guarantees.
Landlord ↔ Tenant lean methodology
- Overall (STATE)
- 92 Strongly Landlord-Friendly
- State Arkansas
- 92 Strongly Landlord-Friendly · R+14
- County
- — inherits STATE
- City
- — inherits STATE
ZIP-level market 72715
- Home prices YoY
- -6.6%
- Active inventory
- 838
- Price-to-rent
- 10.6×
Monthly cashflow live
- Estimated rent
- $2,120 high interval (Pro) →
- Mortgage (P&I)
- −$1,411
- Tax from tax record
- −$141 /mo · $1,692/yr
- Insurance
- −$112
- HOA
- −$0
- Vacancy / Maint / Mgmt
- −$445
- Net cashflow
- $11
Break-even live
Sensitivity live
| Price | -10% $163 | -5% $87 | +0% $11 | +5% $-65 | +10% $-141 |
|---|---|---|---|---|---|
| Rent | -10% $-156 | -5% $-73 | +0% $11 | +5% $95 | +10% $179 |
| Rate | -1.0pp $147 | -0.5pp $80 | base $11 | +0.5pp $-59 | +1.0pp $-130 |
UW: 25.0% down · 7.5% · 30yr · 1.5% tax · 5.0% vac · 8.0% maint · 8.0% mgmt
Financing live
Cash to close
- Down payment
- $67,250
- Closing costs
- $8,070
- Reserves months
- —
- Total cash needed
- —
Loan-product check · same deal, 3 products live
Conventional
25% down · 7.5% · 30yr
- Down + closing
- —
- Monthly P&I
- —
- Monthly cashflow
- —
- DSCR
- —
- Eligible?
- —
Personal DTI + credit; lowest rate.
DSCR
20% down · 8.5% · 30yr
- Down + closing
- —
- Monthly P&I
- —
- Monthly cashflow
- —
- DSCR
- —
- Eligible?
- —
No personal income docs; deal must DSCR.
Hard money
10% down · 12.0% · 12mo
- Down + closing
- —
- Monthly P&I
- —
- Monthly cashflow
- —
- DSCR
- —
- Eligible?
- —
Short-term bridge; refi at stabilization.
Rent comps 5 comps
| Address | Beds | Baths | Sqft | Rent | $/sqft | DOM | Units | Dist |
|---|---|---|---|---|---|---|---|---|
| 26 Purfleet Dr Bella Vista, AR | 3.0 | 2.0 | 1276 | $1,575 | $1.23 | 16d | 1 | 0.56mi |
| 6 Connie Ln Bella Vista, AR | 3.0 | 2.0 | 1440 | $2,250 | $1.56 | 25d | 1 | 0.96mi |
| 9 Hartlepool Dr Bella Vista, AR | 3.0 | 2.0 | 1264 | $1,500 | $1.19 | 45d | 1 | 1.09mi |
| 13 Yarmouth Dr Bella Vista, AR | 2.0 | 2.0 | 1237 | $2,100 | $1.70 | 16d | 1 | 1.34mi |
| 9 August Ln Unit 1363327P Bella Vista, AR | 2.0 | 1.5 | 1173 | $3,153 | $2.69 | 16d | 1 | 1.46mi |
Listing history 25 events
-
2026-06-22days on market $269,000 Active 47 DOM
-
2026-06-18days on market $269,000 Active 44 DOM
-
2026-06-17days on market $269,000 Active 43 DOM
-
2026-06-16days on market $269,000 Active 42 DOM
-
2026-06-15days on market $269,000 Active 41 DOM
-
2026-06-14days on market $269,000 Active 39 DOM
-
2026-06-10days on market $269,000 Active 36 DOM
-
2026-06-09days on market $269,000 Active 35 DOM
-
2026-06-08days on market $269,000 Active 34 DOM
-
2026-06-07days on market $269,000 Active 33 DOM
-
2026-06-05days on market $269,000 Active 30 DOM
-
2026-06-03days on market $269,000 Active 29 DOM
-
2026-06-02days on market $269,000 Active 28 DOM
-
2026-06-01days on market $269,000 Active 27 DOM
-
2026-05-31days on market $269,000 Active 26 DOM
-
2026-05-31days on market $269,000 Active 25 DOM
-
2026-05-12status Active
-
2026-04-10status Pending
-
2026-04-03$269,000 Active
-
2024-10-29soldstatus $55,000
-
2021-04-08soldstatus $8,000 160-char remark
Show marketing remark (160 chars)
Lake Avalon living, walking distance to entrance of Lake Avalon Dam area. Lot slopes in front and then levels out nicely, close to all amenities of Bella Vista.
-
2019-11-04$8,000 160-char remark
Show marketing remark (160 chars)
Lake Avalon living, walking distance to entrance of Lake Avalon Dam area. Lot slopes in front and then levels out nicely, close to all amenities of Bella Vista.
-
2013-09-13soldstatus $27,000 227-char remark
Show marketing remark (227 chars)
GREAT LOCATION ACROSS FROM THE LAKE. GREAT FOR FIRST TIME BUYER OR INVESTOR. THE HOME IS FULL OF CHARM AND JUST WAITING FOR SOMEONE TO MAKE IT THEIR OWN. ,Property was built prior to 1978 and lead-based paint potentially exists
-
2013-05-16$27,000 227-char remark
Show marketing remark (227 chars)
GREAT LOCATION ACROSS FROM THE LAKE. GREAT FOR FIRST TIME BUYER OR INVESTOR. THE HOME IS FULL OF CHARM AND JUST WAITING FOR SOMEONE TO MAKE IT THEIR OWN. ,Property was built prior to 1978 and lead-based paint potentially exists
-
2001-07-17soldstatus $60,000
ⓘ Source: listings_history table (triggers on properties + properties_extension) + one-shot
backfill from property_details.listing_events for pre-trigger history.
Tax reassessment forecast AR · Resets to sale price
- Current annual tax
- $1,692 · $141/mo
- Projected year-2 tax
- $1,722 · $143/mo
- Expected delta
- +$30/yr (+$2/mo · 1.8%)
ⓘ Screening estimate from a state-policy table — verify with the county assessor before closing.
Climate risk First Street
- Flood 1/10 Low FEMA zone X (unshaded) · 0% chance over 30 yrs
- Wildfire 3/10 Moderate
- Heat 4/10 Moderate 7 d/yr ≥105°F today · 20 d/yr by 30 yrs out
- Wind 2/10 Low 2% chance of damaging wind over 30 yrs
- Air quality 2/10 Low 0 unhealthy d/yr today · 1 by 30 yrs out
Nearby sold comps map
Loading sold comps map…
Walkable amenities ~0.75 mi
Loading nearby amenities…
Taxation est. · year 1
- Rental income
- $25,440
- − Mortgage interest
- −$15,068
- − Property taxes
- −$1,692
- − Insurance
- −$1,345
- − Repairs & maintenance
- −$2,035
- − Management
- −$2,035
- − Depreciation
- −$7,825
- Taxable loss
- −$4,560
- Est. tax savings @ 24.0%
- +$1,094
- After-tax cash flow
- $1,228/yr
For passive investors: Depreciation is non-cash, so a rental often shows a tax loss while cash-flowing — sheltering income. Rental losses are passive: they offset passive income freely, and up to $25,000/yr can offset ordinary (W-2) income if you actively participate and your MAGI is under $100k (phasing out to $0 by $150k); unused losses carry forward. On sale, claimed depreciation is recaptured at up to 25%, and gains may owe capital-gains tax (a 1031 exchange can defer both). Figures are a year-1 estimate at your 24.0% rate — not tax advice; consult a CPA.
Schools (NCES district)
- District
- Bentonville School District
- NCES district ID
- 0503060
- Math proficiency
- 59% ▼ -8.00%
- Reading proficiency
- 59% ▼ -6.00%
- Median HH income
- $66,721
- Composite
- 51.85/100
- National rank
- #1661
- State rank
- #3 of 238 in AR
Livability — Bella Vista
- Score
- 67/100
- State rank
- #111
- US rank
- #11129
Category grades
Schools grade is shown separately in the Schools card above.
Census & demographics
- Census place
- Bella Vista, AR
- County
- Benton County · 259,241 people
- City population
- 31,638
- Metro
- Fayetteville-Springdale-Rogers, AR
- Population (ZIP)
- 17,288
- Household income
- $82,447
- Rent vs Own
- Severe rent burden
- 107.0
Population outlook (Benton County) Hauer SSP2
- Today (2025)
- 318,683 people
- By 2030
- 353,481 · +10.9%
- By 2040
- 425,280 · +33.4%
- By 2050
- 497,239 · +56.0%
- By 2075
- 662,114 · +107.8%
- By 2100
- 776,431 · +143.6%
Race, ethnicity, and origin ACS 2023
- Neighborhood character
- Predominantly White (84%)
- Race & ethnicity
- White 84% Two or more races 12% Hispanic / Latino 6% Asian 1%
- Hispanic origin (detail)
- Mexican 2% Dominican 2%
- Common ancestry
- Lithuanian 4% Slovak 4% Portuguese 2%
- Foreign-born
- 3% · Canada
- Languages at home
- 97% English-only · Spanish 2%
Political lean MEDSL · Benton
- 2024 margin
- Strong R (+27.0) · D 35.2% · R 62.1% · Other 2.7%
- 2008→2024 swing
- +9.6pp toward D · 2008: -36.5pp · 2024: -27.0pp
- All cycles
- 2024: R+27.0 2020: R+26.4 2016: R+34.9 2012: R+40.4 2008: R+36.5
Not yet ingested
- Civics
- —
Market trends
- HPI YoY
- ▼ -21.53%
- Current HPI
- 304.946
- Rent YoY
- —
- Metro
- Fayetteville-Springdale-Rogers, AR
- State GDP YoY
- ▲ 3.80%
- F500 in state
- 10
Industry mix (Fortune 500 HQ in AR)
| Industry | F500 HQs | Revenue |
|---|---|---|
| Retail | 1 | $681B |
|
||
| Food / Agriculture | 1 | $53B |
|
||
| Retail / Energy | 1 | $22B |
|
||
| Transportation / Logistics | 1 | $12B |
|
||
| Energy | 1 | $4B |
|
||
Price history
+348.3% since first listed9 events — show timeline
- 2026-05-12 Relisted — NWARMLS
- 2026-04-10 Pending — NWARMLS
- 2026-04-03 Listed $269,000 NWARMLS
- 2024-10-29 Sold (Public Records) $55,000 Public Records
- 2021-04-08 Sold (MLS) $8,000 NWARMLS
- 2019-11-04 Listed $8,000 NWARMLS
- 2013-09-13 Sold (MLS) $27,000 NWARMLS
- 2013-05-16 Listed $27,000 NWARMLS
- 2001-07-17 Sold (Public Records) $60,000 Public Records
Property tax history
+11.4%/yrLatest (2025): $1,692 · +261.0% YoY. Source: county tax records.
Cash-flow waterfall
monthlySold comps — $/sqft
last 12 mo · ≤1 miLoading sold comps…