68 Yefim · Roseville, CA
Flood risk No data
- FEMA flood zone
- —
- Chance of flooding over 30 yrs
- —
- Est. flood insurance / yr
- —
Fire risk No data
- Est. fire insurance / yr
- —
Heat risk No data
- Hot days now (above threshold)
- —
- Hot days in 30 yrs
- —
Wind risk No data
- Chance of severe wind over 30 yrs
- —
Air-quality risk No data
- Unhealthy air days now
- —
- Unhealthy air days in 30 yrs
- —
Risk factors via First Street. Map © Google.
Why this score? — see what drove the B+ grade
The composite is a weighted blend of 9 inputs, each scored 0–100. Each bar is that input's sub-score; the figure is the points it added to the 100-point composite (weight × sub-score).
- Cash flow +30.0/30.0
- ARV discount +15.0/15.0
- 1% rule +10.0/10.0
- DSCR +10.0/10.0
- Schools +5.1/10.0
- Livability +3.9/5.0
- Rent growth +3.4/5.0
- Condition / age +2.5/5.0
- Appreciation +0.0/10.0
$86,900
🖨 Deal sheet 📄 Offer letter ✓ Due diligence
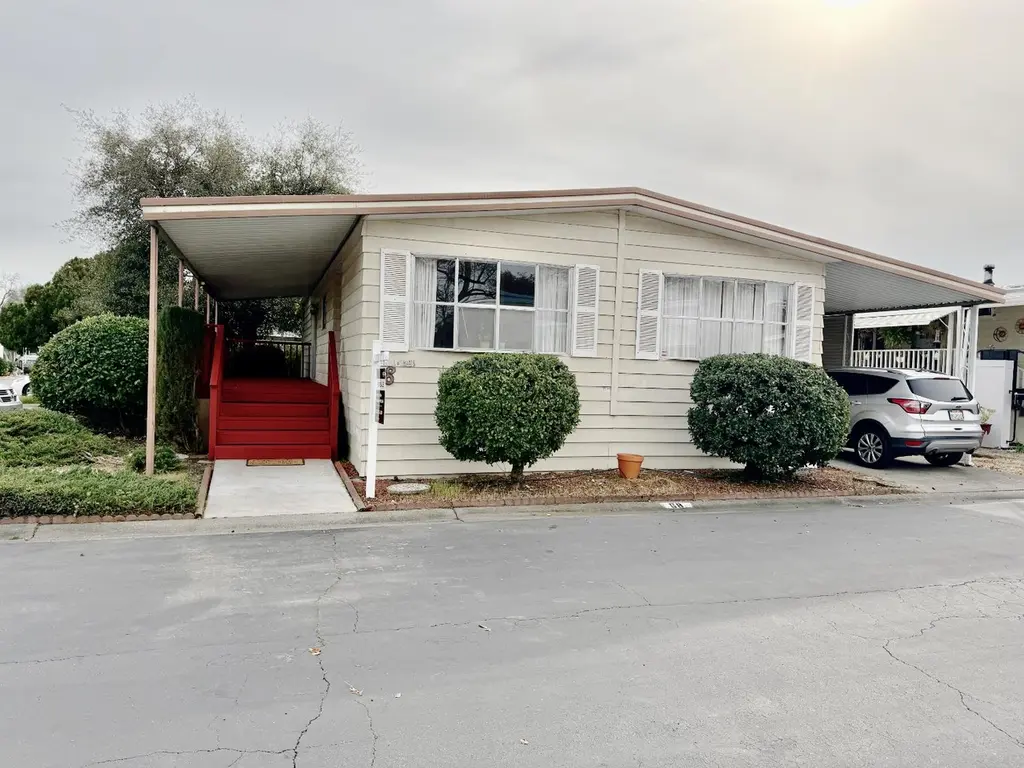
Listing remarks
Welcome to Country Villa, a vibrant 55+ community. This move-in ready 2-bedroom, 2-bath home features newer PEX plumbing, a redwood deck, a wheelchair lift, and a bright, spacious floorplan . The kitchen offers cream cabinets, included appliances (fridge), a built-in breakfast table, and tile floors that continue into both bathrooms. Enjoy a huge living room and formal dining area framed by two large windows that flood the space with natural light. Both tub and shower stalls are in excellent condition. Bedroom, laundry area, hallway, and den area just freshly painted. Outside, guest parking is conveniently adjacent to the unit, and a generous storage shed (stays with the home) plus garden s
Key facts
- Tile floors
- Newer pex plumbing
- Redwood deck
Tags
Property features AI
Finance
- Other: Land lease amount listed (agent to confirm)
- Financial info: Land lease: No
- HOA & community: No association; Senior community
Exterior
- Parking: Covered parking for 2 vehicles
- Utilities: Gas plumbed with individual gas meter; Public water; Public sewer; Electric service (other)
- Home design: Manufactured in park; Double wide; Hillcrest make; Built in 1978
- Construction: Vinyl skirting; Other roof
- Exterior features: Corner lot; Regular-shaped lot; Storage; Shed(s); Covered deck; Porch
Interior
- Kitchen: Built-in electric oven; Gas cook top; Range hood; Dishwasher; Laminate countertops
- Bedrooms: 2 bedrooms (includes master bedroom)
- Flooring: Carpet; Tile
- Bathrooms: 2 full bathrooms; Tub; Shower stall(s)
- Heating & cooling: Central heating; Central air conditioning; Ceiling fans
- Interior features: Built-in electric oven; Gas cook top; Range hood; Dishwasher; Laminate counters; Covered deck; Porch; Storage area; Pets allowed
- Laundry & utility: Washer included; Dryer included; Indoor laundry room
Neighborhood map
What this means for you Summary
Snapshot
- This is a 2-bed/2.0-bath manufactured listed at $87k.
Deal economics
- At list price, monthly cash flow is $1k ($14k/yr) — positive.
- The deal already cash-flows at list — no discount required.
- Meets the 1% rule at list price ($2k rent vs $87k).
- Cap rate 22.9% vs local median 2.8% in Roseville — top-decile yield for the area; either an underpriced asset or a hidden risk that comps aren't pricing in. Stress-test before assuming the spread holds.
Location & tenants
- Location reads 77/100 on livability (#90 in CA, #3,239 nationally) — a middle-class / working-renter tenant base. Strengths: commute A+, employment A+, housing A+; Watch: cost of living F.
- Roseville Joint Union High (urban): math 42% / reading 71% proficiency, ranked #86 of 517 in CA (top 17%) — acceptable for families but not a draw, mixed tenant base, ~2y average lease.
- Market conditions: Rents rising (+3.5%/yr); 118 active listings in the ZIP; 8 comparable units currently listed for rent nearby; rentals leasing fast (median 8d on market — plan ~1-2 weeks tenant-placement turnaround); solid renter incomes; 3,535 units permitted in Placer County in 2024 (689 in 5+ unit buildings).
Forward outlook
- Local home prices are declining (-3.0%/yr); year-one equity from $601 of loan paydown is wiped out by about $3k of value loss. Plan a longer hold.
- Placer County population projected at +20% by 2050 — long-run rental-demand tailwind backs the buy-and-hold thesis.
- At projected returns (-3.0% appreciation + 3.5% rent growth), your $24k cash investment doubles in ~2 years — after that, you're playing with house money.
Negotiation context
- Only 14 days on market — expect competitive offers; lowballing is unlikely to land.
Questions for the listing agent
- Built in 1978 — when were the roof, HVAC, electrical panel, plumbing, and water heater last replaced?
- Is there a deadline driving the sale (1031 exchange, divorce, estate, relocation)? That informs how much negotiation room exists.
- Schools are B-rated — typically a magnet for longer-tenancy family renters. What's the average tenant stay here, and is there a school-zone premium baked into asking?
- What's the average days-on-market for RENTAL listings here right now (not sales)? A rising rental-DOM trend means longer vacancies and softer asking-rent achievability than the comps imply.
- What's the recent tenant-quality profile in this submarket — average credit score on applications, eviction rate, late-payment / NSF rate, and stable-employment percentage? A property-management company in the area should have these aggregated.
- How much new for-sale + rental construction is in the pipeline within 1–3 miles? Heavy new supply typically softens prices + rents 12–24 months out; constrained supply supports both.
Investment metrics
- 1% rule
- 2.63% ✓
- Cap rate
- 22.90%
- Cash-on-cash
- 59.32%
- DSCR
- 3.64
- GRM
- 3.2
CMA / ARV
- ARV (on-the-fly)
- $104,832
- Comps found
- 12
Show comp detail 12 sales within ~0.75 mi
| Address | Dist | Beds/Ba | Sqft | Sold | Price | $/sf | Match |
|---|---|---|---|---|---|---|---|
| 79 Olga Way | 0.05mi | 3/2.0 (+1) | 1,440 (+7%) | 1mo | $155,000 | $108 | 80 |
| 156 Rimma Way | 0.12mi | 2/2.0 | 1,440 (+7%) | 3mo | $115,000 | $80 | 80 |
| 66 Yefim Way | 0.02mi | 2/2.0 | 1,296 (-4%) | 19mo | $95,000 | $73 | 77 |
| 14 Olga Way | 0.21mi | 2/2.0 | 1,440 (+7%) | 5mo | $110,000 | $76 | 74 |
| 10 Rimma Way | 0.18mi | 2/2.0 | 1,272 (-5%) | 12mo | $83,900 | $66 | 73 |
| 72 Lora Way | 0.05mi | 2/2.0 | 1,440 (+7%) | 16mo | $79,950 | $56 | 73 |
| 21 Olga Way | 0.12mi | 2/2.0 | 1,152 (-14%) | 1mo | $90,000 | $78 | 70 |
| 7 Rimma Way | 0.16mi | 2/2.0 | 1,272 (-5%) | 17mo | $135,000 | $106 | 69 |
| 143 Olga Way | 0.17mi | 3/2.0 (+1) | 1,440 (+7%) | 7mo | $84,000 | $58 | 69 |
| 164 Rimma Way | 0.13mi | 2/2.0 | 1,248 (-7%) | 16mo | $122,000 | $98 | 69 |
| 71 Lora Way | 0.04mi | 2/2.0 | 1,150 (-14%) | 15mo | $86,500 | $75 | 61 |
| 150 Rimma Way | 0.12mi | 3/2.0 (+1) | 1,527 (+14%) | 14mo | $130,000 | $85 | 55 |
Match score weights: distance 35% · size 25% · config 20% · recency 20%. Top-matched comps best support the ARV.
Projected returns pro-forma
-3.0% appreciation · 3.54% rent growth · sell at horizon
- IRR
- 58.6%
- Equity multiple
- 3.62×
- Total profit
- $63,813
- Equity at exit
- $12,957
- IRR
- 63.6%
- Equity multiple
- 7.56×
- Total profit
- $159,532
- Equity at exit
- $7,514
Cash invested: $24,332 (down + closing). Projections, not guarantees.
Landlord ↔ Tenant lean methodology
- Overall (STATE)
- 18 Strongly Tenant-Friendly
- State California
- 18 Strongly Tenant-Friendly · D+13
- County
- — inherits STATE
- City
- — inherits STATE
ZIP-level market 95661
- Rents YoY
- 3.5%
- Active inventory
- 118
- Price-to-rent
- 3.2×
Monthly cashflow live
- Estimated rent
- $2,283 high interval (Pro) →
- Mortgage (P&I)
- −$456
- Tax est. 1.5%
- −$109 /mo · $1,304/yr
- Insurance
- −$36
- HOA
- −$0
- Vacancy / Maint / Mgmt
- −$479
- Net cashflow
- $1,203
Break-even live
UW: 25.0% down · 7.5% · 30yr · 1.5% tax · 5.0% vac · 8.0% maint · 8.0% mgmt
Financing live
Cash to close
- Down payment
- $21,725
- Closing costs
- $2,607
- Reserves months
- —
- Total cash needed
- —
Loan-product check · same deal, 3 products live
Conventional
25% down · 7.5% · 30yr
- Down + closing
- —
- Monthly P&I
- —
- Monthly cashflow
- —
- DSCR
- —
- Eligible?
- —
Personal DTI + credit; lowest rate.
DSCR
20% down · 8.5% · 30yr
- Down + closing
- —
- Monthly P&I
- —
- Monthly cashflow
- —
- DSCR
- —
- Eligible?
- —
No personal income docs; deal must DSCR.
Hard money
10% down · 12.0% · 12mo
- Down + closing
- —
- Monthly P&I
- —
- Monthly cashflow
- —
- DSCR
- —
- Eligible?
- —
Short-term bridge; refi at stabilization.
Rent comps 8 comps
| Address | Beds | Baths | Sqft | Rent | $/sqft | DOM | Units | Dist |
|---|---|---|---|---|---|---|---|---|
| 1911 Wildwood Way Apt 1 Roseville, CA | 2.0 | 1.0 | 900 | $1,595 | $1.77 | 1d | 1 | 0.42mi |
| 1812A S Cirby Way Unit B Roseville, CA | 2.0 | 1.0 | 1000 | $2,300 | $2.30 | 1d | 1 | 0.63mi |
| 1519 Pine Valley Cir Roseville, CA | 3.0 | 2.0 | 1577 | $2,750 | $1.74 | 10d | 1 | 0.99mi |
| 1801 Eureka Rd Roseville, CA | 1.0–2.0 | 1.0–2.0 | 862 | $4,222 | $4.90 | 1d | 11 | 1.02mi |
| 7898 Claypool Way Citrus Heights, CA | 3.0 | 2.0 | 1317 | $2,500 | $1.90 | 17d | 1 | 1.21mi |
| 8208 Charlotte Ave Citrus Heights, CA | 3.0 | 2.0 | 1401 | $2,750 | $1.96 | 7d | 1 | 1.23mi |
| 8800 Sierra College Blvd Roseville, CA | 1.0–3.0 | 1.0–2.0 | 1034 | $2,322 | $2.24 | 1d | 45 | 1.34mi |
| 8629 El Sobrante Way Orangevale, CA | 3.0 | 2.0 | 1117 | $2,500 | $2.24 | 43d | 1 | 1.44mi |
Listing history 9 events
-
2026-06-13statusdays on market $86,900 Pending 14 DOM
-
2026-06-09days on market $86,900 Active 12 DOM
-
2026-06-08days on market $86,900 Active 11 DOM
-
2026-06-07days on market $86,900 Active 10 DOM
-
2026-06-05days on market $86,900 Active 7 DOM
-
2026-06-03days on market $86,900 Active 6 DOM
-
2026-06-02days on market $86,900 Active 5 DOM
-
2026-06-01days on market $86,900 Active 4 DOM
-
2026-05-31days on market $86,900 Active 3 DOM
ⓘ Source: listings_history table (triggers on properties + properties_extension) + one-shot
backfill from property_details.listing_events for pre-trigger history.
Nearby sold comps map
Loading sold comps map…
Walkable amenities ~0.75 mi
Loading nearby amenities…
Taxation est. · year 1
- Rental income
- $27,394
- − Mortgage interest
- −$4,868
- − Property taxes
- −$1,304
- − Insurance
- −$434
- − Repairs & maintenance
- −$2,192
- − Management
- −$2,192
- − Depreciation
- −$2,528
- Taxable income
- $13,877
- Est. tax owed @ 24.0%
- −$3,331
- After-tax cash flow
- $11,104/yr
For passive investors: Depreciation is non-cash, so a rental often shows a tax loss while cash-flowing — sheltering income. Rental losses are passive: they offset passive income freely, and up to $25,000/yr can offset ordinary (W-2) income if you actively participate and your MAGI is under $100k (phasing out to $0 by $150k); unused losses carry forward. On sale, claimed depreciation is recaptured at up to 25%, and gains may owe capital-gains tax (a 1031 exchange can defer both). Figures are a year-1 estimate at your 24.0% rate — not tax advice; consult a CPA.
Schools (NCES district)
- District
- Roseville Joint Union High
- NCES district ID
- 0633630
- Math proficiency
- 42% ▼ -6.00%
- Reading proficiency
- 71% ▼ -3.00%
- Median HH income
- $81,930
- Composite
- 51.11/100
- National rank
- #1763
- State rank
- #86 of 517 in CA
Livability — Roseville
- Score
- 77/100
- State rank
- #90
- US rank
- #3239
Category grades
Schools grade is shown separately in the Schools card above.
Census & demographics
- Census place
- Roseville, CA
- County
- Placer County · 390,510 people
- City population
- 161,837
- Metro
- Sacramento-Roseville-Folsom, CA
- Population (ZIP)
- 32,589
- Household income
- $105,925
- Rent vs Own
- Severe rent burden
- 1617.0
Population outlook (Placer County) Hauer SSP2
- Today (2025)
- 422,709 people
- By 2030
- 444,249 · +5.1%
- By 2040
- 480,192 · +13.6%
- By 2050
- 506,390 · +19.8%
- By 2075
- 550,219 · +30.2%
- By 2100
- 547,760 · +29.6%
Race, ethnicity, and origin ACS 2023
- Neighborhood character
- Predominantly White (68%)
- Race & ethnicity
- White 68% Hispanic / Latino 15% Two or more races 13% Asian 9% Black 2%
- Hispanic origin (detail)
- Mexican 11%
- Common ancestry
- Lithuanian 2% Portuguese 2% Italian 2%
- Foreign-born
- 13% · Canada, China, Vietnam
- Languages at home
- 83% English-only · Spanish 5% Other Indo-European 4% Russian/Polish/Slavic 3%
Political lean MEDSL · Placer
- 2024 margin
- Lean R (+8.5) · D 44.3% · R 52.8% · Other 2.9%
- 2008→2024 swing
- +2.8pp toward D · 2008: -11.3pp · 2024: -8.5pp
- All cycles
- 2024: R+8.5 2020: R+6.7 2016: R+11.3 2012: R+20.1 2008: R+11.3
Not yet ingested
- Civics
- —
Market trends
- HPI YoY
- ▼ -442.54%
- Current HPI
- 274.7033
- Rent YoY
- ▲ 3.54%
- Metro
- Sacramento-Roseville-Folsom, CA
- State GDP YoY
- ▲ 3.21%
- F500 in state
- 116
Industry mix (Fortune 500 HQ in CA)
| Industry | F500 HQs | Revenue |
|---|---|---|
| Technology | 27 | $1,492B |
|
||
| Financial Services | 3 | $174B |
|
||
| Retail | 3 | $44B |
|
||
| Insurance | 3 | $26B |
|
||
| Media / Entertainment | 2 | $115B |
|
||
| Pharmaceuticals / Biotech | 2 | $62B |
|
||
Cash-flow waterfall
monthlySold comps — $/sqft
last 12 mo · ≤1 miLoading sold comps…