8250 Lankershim Blvd #112 · Los Angeles, CA
Flood risk 1/10 · Minimal
- FEMA flood zone
- X (unshaded)
- Chance of flooding over 30 yrs
- 0.0%
- Est. flood insurance / yr
- $507 – $1,088
Fire risk 1/10 · Minimal
- Est. fire insurance / yr
- $659 – $1,223
Heat risk 7/10 · Major
- Hot days now (above 96°F)
- 7 days/yr
- Hot days in 30 yrs
- 21 days/yr
Wind risk 1/10 · Minimal
- Chance of severe wind over 30 yrs
- —
Air-quality risk 5/10 · Moderate
- Unhealthy air days now
- 7 days/yr
- Unhealthy air days in 30 yrs
- 9 days/yr
Risk factors via First Street. Map © Google.
Why this score? — see what drove the B- grade
The composite is a weighted blend of 9 inputs, each scored 0–100. Each bar is that input's sub-score; the figure is the points it added to the 100-point composite (weight × sub-score).
- Cash flow +30.0/30.0
- 1% rule +10.0/10.0
- DSCR +10.0/10.0
- ARV discount +6.2/15.0
- Condition / age +4.0/5.0
- Schools +3.6/10.0
- Livability +3.4/5.0
- Rent growth +1.8/5.0
- Appreciation +0.0/10.0
$215,000
🖨 Deal sheet 📄 Offer letter ✓ Due diligence
Listing remarks
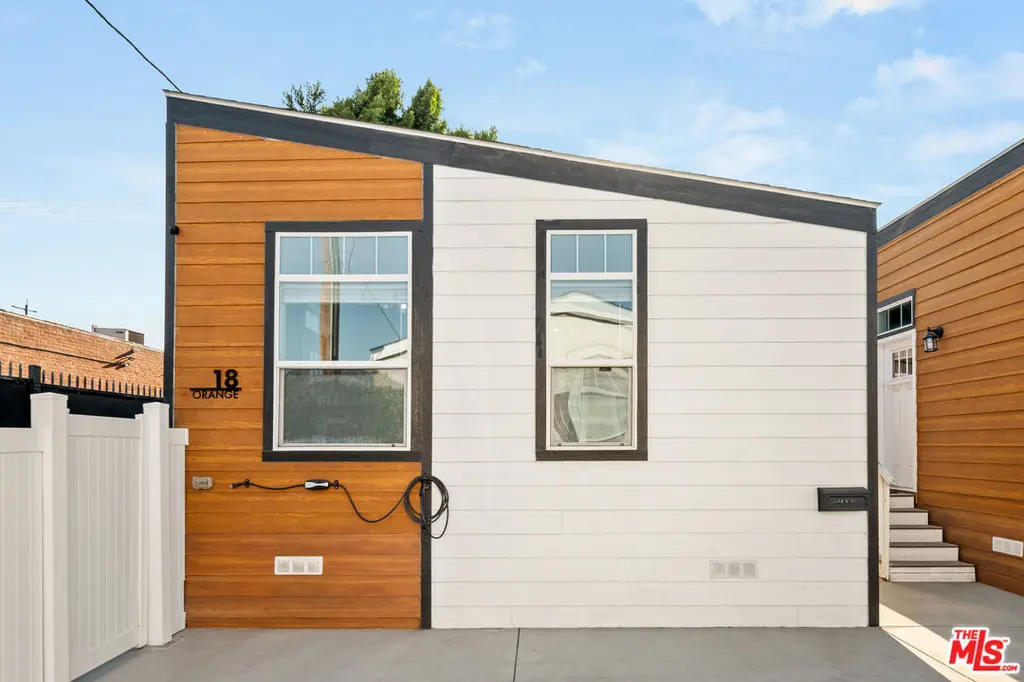
* Space 112 is labeled as Orange 18 * Discover the perfect blend of comfort and convenience in this delightful 3-bedroom, 2-bathroom manufactured home. Situated in the vibrant North Hollywood community, this cozy home spans over 1,000 square feet, providing plenty of space for living and entertaining. The interior boasts a spacious living area, a modern kitchen with up-to-date appliances, and ample storage space. Retreat to the master bedroom, complete with its own bathroom, for a touch of privacy and relaxation. The additional bedrooms offer flexibility for your family, guests, or a home office. Outside, enjoy the sunny California weather and take advantage of the community amenities incl
Key facts
- 9.63 acre lot
- Parking
- Community pool
Property features AI
Finance
- Other: Zoning: LARMP; Directions: From the 5 North, take exit 152 to Lankershim; left on Lankershim, park is on the left.
- Financial info: Monthly lease amount applicable; Annual land lease applicable
- HOA & community: Clubhouse; Pool; Fitness center; Card room; Pets allowed (per association rules); 120 units in the community
Exterior
- Parking: Driveway
- Home design: Residential mobile home; Lease land type
- Exterior features: Community pool
Interior
- Kitchen: Dishwasher; Microwave; Refrigerator
- Flooring: Laminate floors
- Bathrooms: 2 full bathrooms
- Heating & cooling: Central heat; Central cooling
- Interior features: Living room; Laminate floors
- Laundry & utility: Laundry inside; Washer; Dryer
Neighborhood map
What this means for you Summary
Snapshot
- This is a 3-bed/2.0-bath manufactured listed at $215k. Condition is rated good.
Deal economics
- At list price, monthly cash flow is $1k ($13k/yr) — positive.
- The deal already cash-flows at list — no discount required.
- Meets the 1% rule at list price ($3k rent vs $215k).
- Recommended offer: $212k (1.5% below list) — sets the bar for market timing.
- Cap rate 12.4% vs local median 2.1% in Los Angeles — top-decile yield for the area; either an underpriced asset or a hidden risk that comps aren't pricing in. Stress-test before assuming the spread holds.
Location & tenants
- Location reads 68/100 on livability (#273 in CA) — a middle-class / working-renter tenant base. Strengths: amenities A+, commute A+, employment B; Watch: health & safety C-, schools D+, crime F.
- Los Angeles Unified (urban): math 29% / reading 54% proficiency, ranked #223 of 517 in CA (top 43%) — families likely to look elsewhere, expect single-tenant / working-renter base with shorter leases; 67% free/reduced lunch — lower-income household profile, screen leases tightly.
- Market conditions: Rents soft (-3.0%/yr); 75 active listings in the ZIP; 40 comparable units currently listed for rent nearby; rentals at typical pace (median 24d on market — plan ~3-4 weeks tenant-placement turnaround); 40% of comp listings sitting > 30 days — soft ceiling on asking rent; 19,697 units permitted in Los Angeles County in 2024 (9,426 in 5+ unit buildings).
- At $3,262/mo this rent would consume 60% of the median local household income ($65k/yr) (locally 3600% of renters already pay >50% of income on rent) — very limited rent-growth headroom before tenants either downsize or default.
Forward outlook
- Local home prices are declining (-3.0%/yr); year-one equity from $1k of loan paydown is wiped out by about $6k of value loss. Plan a longer hold.
- Los Angeles County population projected at +9% by 2050 — modest demand growth; plan on rents tracking national, not racing it.
- At projected returns (-3.0% appreciation + 0.0% rent growth), your $60k cash investment doubles in ~7 years — after that, you're playing with house money.
Negotiation context
- It's been on market 28 days — a 2% lower offer ($212k) is reasonable based on typical stale-listing flexibility.
Risks & watch-outs
- Climate carrying-cost: extreme-heat days projected 7→21/yr by 2055 (HVAC capex compounding) — expect insurance premiums to compound above CPI over the hold.
Questions for the listing agent
- Is there a deadline driving the sale (1031 exchange, divorce, estate, relocation)? That informs how much negotiation room exists.
- Schools are D-rated, which usually means shorter tenancies and higher turnover. Who's the typical renter profile here, and what's been the actual vacancy rate?
- Crime grade is F in this area — have there been break-ins, vandalism, or insurance claims at this property in the last 3 years? What carrier currently insures it and at what premium?
- What's the average days-on-market for RENTAL listings here right now (not sales)? A rising rental-DOM trend means longer vacancies and softer asking-rent achievability than the comps imply.
- What's the recent tenant-quality profile in this submarket — average credit score on applications, eviction rate, late-payment / NSF rate, and stable-employment percentage? A property-management company in the area should have these aggregated.
- How much new for-sale + rental construction is in the pipeline within 1–3 miles? Heavy new supply typically softens prices + rents 12–24 months out; constrained supply supports both.
Investment metrics
- 1% rule
- 1.52% ✓
- Cap rate
- 12.38%
- Cash-on-cash
- 21.75%
- DSCR
- 1.97
- GRM
- 5.5
CMA / ARV
- ARV (on-the-fly)
- $209,132
- Comps found
- 4
Show comp detail 4 sales within ~0.75 mi
| Address | Dist | Beds/Ba | Sqft | Sold | Price | $/sf | Match |
|---|---|---|---|---|---|---|---|
| 8250 Lankershim Blvd #198 | 0.07mi | 3/2.0 | 1,056 (-2%) | 7mo | $250,000 | $237 | 87 |
| 8250 Lankershim Blvd Unit Orange 18 | 0.08mi | 3/2.0 | 1,078 (0%) | 22mo | $184,950 | $172 | 78 |
| 8250 Lankershim Blvd #33 | 0.07mi | 3/2.0 | 1,224 (+14%) | 3mo | $225,000 | $184 | 72 |
| 8250 Lankershim Blvd #10 | 0.08mi | 3/2.0 | 980 (-9%) | 16mo | $189,950 | $194 | 68 |
Match score weights: distance 35% · size 25% · config 20% · recency 20%. Top-matched comps best support the ARV.
Projected returns pro-forma
-3.0% appreciation · 0.0% rent growth · sell at horizon
- IRR
- 10.9%
- Equity multiple
- 1.42×
- Total profit
- $25,141
- Equity at exit
- $32,057
- IRR
- 17.4%
- Equity multiple
- 2.24×
- Total profit
- $74,630
- Equity at exit
- $18,589
Cash invested: $60,200 (down + closing). Projections, not guarantees.
Landlord ↔ Tenant lean methodology
- Overall (CITY)
- 0 Strongly Tenant-Friendly
- State California
- 18 Strongly Tenant-Friendly · D+13
- County
- — inherits STATE
- City Los Angeles
- 0 Strongly Tenant-Friendly · D+22
ZIP-level market 91605
- Rents YoY
- -3.0%
- Active inventory
- 75
- Price-to-rent
- 5.5×
Monthly cashflow live
- Estimated rent
- $3,262 high interval (Pro) →
- Mortgage (P&I)
- −$1,127
- Tax est. 1.5%
- −$269 /mo · $3,225/yr
- Insurance
- −$90
- HOA
- −$0
- Vacancy / Maint / Mgmt
- −$685
- Net cashflow
- $1,091
Break-even live
UW: 25.0% down · 7.5% · 30yr · 1.5% tax · 5.0% vac · 8.0% maint · 8.0% mgmt
Financing live
Cash to close
- Down payment
- $53,750
- Closing costs
- $6,450
- Reserves months
- —
- Total cash needed
- —
Loan-product check · same deal, 3 products live
Conventional
25% down · 7.5% · 30yr
- Down + closing
- —
- Monthly P&I
- —
- Monthly cashflow
- —
- DSCR
- —
- Eligible?
- —
Personal DTI + credit; lowest rate.
DSCR
20% down · 8.5% · 30yr
- Down + closing
- —
- Monthly P&I
- —
- Monthly cashflow
- —
- DSCR
- —
- Eligible?
- —
No personal income docs; deal must DSCR.
Hard money
10% down · 12.0% · 12mo
- Down + closing
- —
- Monthly P&I
- —
- Monthly cashflow
- —
- DSCR
- —
- Eligible?
- —
Short-term bridge; refi at stabilization.
Rent comps 40 comps
| Address | Beds | Baths | Sqft | Rent | $/sqft | DOM | Units | Dist |
|---|---|---|---|---|---|---|---|---|
| 11836 Rialto St Sun Valley, CA | 3.0 | 2.0 | 1412 | $3,950 | $2.80 | 24d | 1 | 0.44mi |
| 11969 Redbank St Sun Valley, CA | 3.0 | 2.5 | 1500 | $3,600 | $2.40 | 24d | 1 | 0.53mi |
| 11554 Arminta St North Hollywood, CA | 2.0 | 2.0 | 800 | $3,395 | $4.24 | 7d | 1 | 0.53mi |
| 11967 Redbank St Unit 1/2 Sun Valley, CA | 2.0 | 2.0 | 800 | $3,250 | $4.06 | 24d | 1 | 0.54mi |
| 11840 Arminta St North Hollywood, CA | 3.0 | 2.0 | 1200 | $3,500 | $2.92 | 10d | 1 | 0.56mi |
| 11842 Arminta St North Hollywood, CA | 2.0 | 2.5 | 1020 | $3,000 | $2.94 | 7d | 1 | 0.56mi |
| 7834 Beck Ave North Hollywood, CA | 3.0 | 2.5 | 1500 | $4,950 | $3.30 | 43d | 1 | 0.58mi |
| 11911 Stagg St North Hollywood, CA | 3.0 | 2.0 | 1330 | $4,000 | $3.01 | 4d | 1 | 0.68mi |
| 11911 Stagg St North Hollywood, CA | 3.0 | 2.0 | 1330 | $4,000 | $3.01 | 24d | 1 | 0.68mi |
| 8209 Bellingham Ave North Hollywood, CA | 2.0 | 2.0 | 1050 | $3,200 | $3.05 | 7d | 1 | 0.69mi |
| 8391 San Fernando Rd Sun Valley, CA | 3.0 | 2.0 | 897 | $3,000 | $3.34 | 43d | 1 | 0.71mi |
| 11145 Roscoe Blvd Sun Valley, CA | 3.0 | 2.0 | 1500 | $3,250 | $2.17 | 24d | 1 | 0.73mi |
| 8935 Telfair Ave Sun Valley, CA | 3.0 | 2.0 | 1375 | $3,600 | $2.62 | 43d | 1 | 0.77mi |
| 8505 Cranford Ave Sun Valley, CA | 2.0 | 2.5 | 1200 | $3,600 | $3.00 | 43d | 1 | 0.81mi |
| 9031 El Dorado Ave Sun Valley, CA | 3.0 | 2.0 | 1000 | $3,150 | $3.15 | 17d | 1 | 0.82mi |
| 7820 Vantage Ave North Hollywood, CA | 3.0 | 1.0 | 1028 | $3,125 | $3.04 | 43d | 1 | 0.83mi |
| 7739 Laurel Canyon Blvd North Hollywood, CA | 2.0 | 1.0 | 900 | $2,195 | $2.44 | 17d | 1 | 0.88mi |
| 12045 Keswick St North Hollywood, CA | 2.0–3.0 | 2.0 | 1176 | $2,905 | $2.47 | 2d | 2 | 0.89mi |
| 12406 Cantara St North Hollywood, CA | 3.0 | 3.5 | 1300 | $3,850 | $2.96 | 24d | 1 | 0.97mi |
| 11038 Arminta St Sun Valley, CA | 2.0–3.0 | 1.0–2.0 | 975 | $3,200 | $3.28 | 2d | 3 | 1.02mi |
| 8168 Whitsett Ave North Hollywood, CA | 2.0 | 1.0 | 800 | $2,800 | $3.50 | 43d | 1 | 1.03mi |
| 11721 Runnymede St North Hollywood, CA | 1.0–3.0 | 1.0–2.0 | 954 | $3,200 | $3.35 | 15d | 2 | 1.04mi |
| 11731 Runnymede St Unit 3 North Hollywood, CA | 3.0 | 2.0 | 1120 | $3,000 | $2.68 | 16d | 1 | 1.04mi |
| 7719 Rhodes Ave North Hollywood, CA | 3.0 | 2.0 | 1302 | $6,000 | $4.61 | 43d | 1 | 1.06mi |
| 10960 Ratner St Unit 03 Sun Valley, CA | 2.0 | 2.5 | 1145 | $2,595 | $2.27 | 43d | 1 | 1.06mi |
| 11252 Saticoy St Sun Valley, CA | 3.0 | 2.5 | 1152 | $3,800 | $3.30 | 7d | 1 | 1.06mi |
| 7740 Case Ave Sun Valley, CA | 3.0 | 2.0 | 1180 | $3,950 | $3.35 | 43d | 1 | 1.07mi |
| 11246 Saticoy St Sun Valley, CA | 3.0 | 2.0 | 1235 | $3,500 | $2.83 | 43d | 1 | 1.07mi |
| 10938 Olinda St Sun Valley, CA | 2.0 | 2.0 | 800 | $2,700 | $3.38 | 10d | 1 | 1.08mi |
| 11322 Covello St Sun Valley, CA | 2.0 | 2.0 | 1050 | $3,200 | $3.05 | 24d | 1 | 1.08mi |
| 11744 Runnymede St North Hollywood, CA | 2.0–3.0 | 1.0–2.0 | 950 | $2,950 | $3.11 | 5d | 2 | 1.08mi |
| 7401 Lankershim Blvd North Hollywood, CA | 1.0–2.0 | 1.0–2.0 | 862 | $2,850 | $3.31 | 24d | 4 | 1.11mi |
| 11000 Penrose St Sun Valley, CA | 2.0 | 3.0 | 1401 | $3,900 | $2.78 | 13d | 1 | 1.11mi |
| 7418 Farmdale Ave North Hollywood, CA | 3.0 | 2.0 | 996 | $3,800 | $3.82 | 43d | 1 | 1.13mi |
| 7408 Radford Ave North Hollywood, CA | 3.0 | 2.0 | 1250 | $3,350 | $2.68 | 43d | 1 | 1.13mi |
| 10817 White St Sun Valley, CA | 2.0 | 1.0 | 750 | $1,895 | $2.53 | 43d | 1 | 1.13mi |
| 7810 Wilkinson Ave North Hollywood, CA | 2.0 | 1.0 | 1100 | $2,800 | $2.55 | 1d | 1 | 1.14mi |
| 7810 Wilkinson Ave North Hollywood, CA | 2.0 | 1.0 | 1100 | $3,000 | $2.73 | 43d | 1 | 1.14mi |
| 7858 Craner Ave Sun Valley, CA | 3.0 | 2.0 | 1190 | $4,000 | $3.36 | 43d | 1 | 1.15mi |
| 7744 Vineland Ave Sun Valley, CA | 3.0 | 2.0 | 1260 | $3,400 | $2.70 | 43d | 1 | 1.17mi |
Listing history 14 events
-
2026-06-18days on market $215,000 Active 28 DOM
-
2026-06-17days on market $215,000 Active 27 DOM
-
2026-06-16days on market $215,000 Active 26 DOM
-
2026-06-15days on market $215,000 Active 25 DOM
-
2026-06-13days on market $215,000 Active 23 DOM
-
2026-06-09days on market $215,000 Active 19 DOM
-
2026-06-08days on market $215,000 Active 18 DOM
-
2026-06-07days on market $215,000 Active 17 DOM
-
2026-06-04days on market $215,000 Active 14 DOM
-
2026-06-03days on market $215,000 Active 13 DOM
-
2026-06-02days on market $215,000 Active 12 DOM
-
2026-06-01days on market $215,000 Active 11 DOM
-
2026-05-31days on market $215,000 Active 10 DOM
-
2026-05-21$215,000 Active
ⓘ Source: listings_history table (triggers on properties + properties_extension) + one-shot
backfill from property_details.listing_events for pre-trigger history.
Climate risk First Street
- Flood 1/10 Low FEMA zone X (unshaded) · 0% chance over 30 yrs
- Wildfire 1/10 Low
- Heat 7/10 Severe 7 d/yr ≥96°F today · 21 d/yr by 30 yrs out
- Wind 1/10 Low
- Air quality 5/10 Major 7 unhealthy d/yr today · 9 by 30 yrs out
Nearby sold comps map
Loading sold comps map…
Walkable amenities ~0.75 mi
Loading nearby amenities…
Taxation est. · year 1
- Rental income
- $39,143
- − Mortgage interest
- −$12,043
- − Property taxes
- −$3,225
- − Insurance
- −$1,075
- − Repairs & maintenance
- −$3,131
- − Management
- −$3,131
- − Depreciation
- −$6,255
- Taxable income
- $10,282
- Est. tax owed @ 24.0%
- −$2,468
- After-tax cash flow
- $10,625/yr
For passive investors: Depreciation is non-cash, so a rental often shows a tax loss while cash-flowing — sheltering income. Rental losses are passive: they offset passive income freely, and up to $25,000/yr can offset ordinary (W-2) income if you actively participate and your MAGI is under $100k (phasing out to $0 by $150k); unused losses carry forward. On sale, claimed depreciation is recaptured at up to 25%, and gains may owe capital-gains tax (a 1031 exchange can defer both). Figures are a year-1 estimate at your 24.0% rate — not tax advice; consult a CPA.
Condition & rehab AI · 21 photos
This well-maintained, modern manufactured home in North Hollywood offers a comfortable living space with a good condition score and minimal repairs needed. The property's location and community amenities add significant value.
Value-add opportunities
- Both paint exterior — enhances curb appeal and value
- Resale install new flooring in bathrooms — improves aesthetics and functionality
- Both install smart home features — increases convenience and marketability
Renovation cost estimate screening
Value-add ROI direction
- Both paint exterior — enhances curb appeal and value ↑
- Resale install new flooring in bathrooms — improves aesthetics and functionality ↑
- Both install smart home features — increases convenience and marketability ↑
ⓘ Cost ranges are severity-bucket heuristics (US national rule-of-thumb). Get contractor quotes + a written scope before underwriting a rehab budget.
Schools (NCES district)
- District
- Los Angeles Unified
- NCES district ID
- 0622710
- Math proficiency
- 29% ▼ -4.00%
- Reading proficiency
- 54% ▲ 10.00%
- Median HH income
- $50,403
- Composite
- 35.67/100
- National rank
- #4875
- State rank
- #223 of 517 in CA
Livability — Los Angeles
- Score
- 68/100
- State rank
- #273
- US rank
- #9237
Category grades
Schools grade is shown separately in the Schools card above.
Census & demographics
- Census place
- Los Angeles, CA
- County
- Los Angeles County · 9,444,647 people
- City population
- 3,838,149
- Metro
- Los Angeles-Long Beach-Anaheim, CA
- Population (ZIP)
- 49,868
- Household income
- $65,481
- Rent vs Own
- Severe rent burden
- 3600.0
Population outlook (Los Angeles County) Hauer SSP2
- Today (2025)
- 10,940,515 people
- By 2030
- 11,256,481 · +2.9%
- By 2040
- 11,729,929 · +7.2%
- By 2050
- 11,948,407 · +9.2%
- By 2075
- 11,818,114 · +8.0%
- By 2100
- 10,842,928 · -0.9%
Race, ethnicity, and origin ACS 2023
- Neighborhood character
- Majority Hispanic (62%)
- Race & ethnicity
- Hispanic / Latino 62% White 26% Two or more races 22% Asian 8% Black 2% Native American 1%
- Hispanic origin (detail)
- Mexican 35%
- Common ancestry
- Lithuanian 1% Romanian 1%
- Foreign-born
- 47% · Canada, South Korea, Vietnam
- Languages at home
- 23% English-only · Spanish 55% Other Indo-European 15% Tagalog/Filipino 3%
Political lean MEDSL · Los Angeles
- 2024 margin
- Solid D (+32.9) · D 64.8% · R 31.9% · Other 3.3%
- 2008→2024 swing
- -7.4pp toward R · 2008: 40.4pp · 2024: 32.9pp
- All cycles
- 2024: D+32.9 2020: D+44.2 2016: D+48.0 2012: D+40.0 2008: D+40.4
Not yet ingested
- Civics
- —
Market trends
- HPI YoY
- ▼ -991.52%
- Current HPI
- 504.7685
- Rent YoY
- ▼ -2.95%
- Metro
- Los Angeles-Long Beach-Anaheim, CA
- State GDP YoY
- ▲ 3.21%
- F500 in state
- 116
Industry mix (Fortune 500 HQ in CA)
| Industry | F500 HQs | Revenue |
|---|---|---|
| Technology | 27 | $1,492B |
|
||
| Financial Services | 3 | $174B |
|
||
| Retail | 3 | $44B |
|
||
| Insurance | 3 | $26B |
|
||
| Media / Entertainment | 2 | $115B |
|
||
| Pharmaceuticals / Biotech | 2 | $62B |
|
||
Price history
1 event — show timeline
- 2026-05-21 Listed $215,000 TheMLS
Cash-flow waterfall
monthlySold comps — $/sqft
last 12 mo · ≤1 miLoading sold comps…