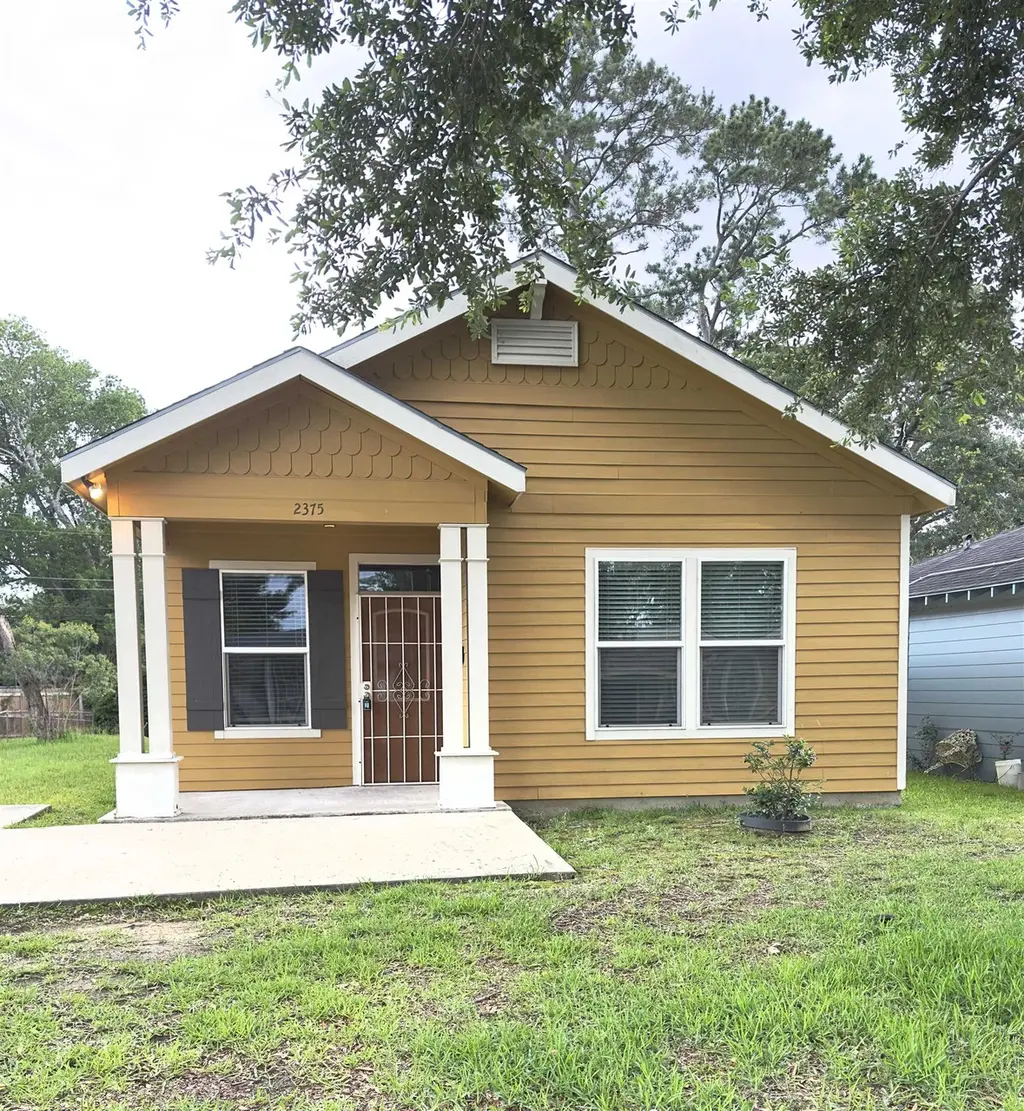
2375 Ranier St · Beaumont, TX
Flood risk 8/10 · Major
- FEMA flood zone
- X
- Chance of flooding over 30 yrs
- 0.99%
- Est. flood insurance / yr
- $507 – $1,088
Fire risk 1/10 · Minimal
- Est. fire insurance / yr
- $1,222 – $2,270
Heat risk 9/10 · Severe
- Hot days now (above 109°F)
- 7 days/yr
- Hot days in 30 yrs
- 24 days/yr
Wind risk 9/10 · Severe
- Chance of severe wind over 30 yrs
- 99.0%
Air-quality risk 2/10 · Minimal
- Unhealthy air days now
- 1 days/yr
- Unhealthy air days in 30 yrs
- 1 days/yr
Risk factors via First Street. Map © Google.
Why this score? — see what drove the D+ grade
The composite is a weighted blend of 9 inputs, each scored 0–100. Each bar is that input's sub-score; the figure is the points it added to the 100-point composite (weight × sub-score).
- ARV discount +12.3/15.0
- Cash flow +10.5/30.0
- Appreciation +8.1/10.0
- 1% rule +3.9/10.0
- Livability +3.2/5.0
- DSCR +3.0/10.0
- Rent growth +2.5/5.0
- Condition / age +2.5/5.0
- Schools +1.5/10.0
$140,000
🖨 Deal sheet 📄 Offer letter ✓ Due diligence
Listing remarks MLS
This adorable 2 bedroom 2 bath home hosts a cozy living room with a high tray ceiling, a dining room off the entry way, wood vinyl plank flooring throughout, indoor laundry room, and plenty of extra storage space. The kitchen offers black appliances, including refrigerator and vented microwave, modern dark wood cabinets, a spacious pantry, and beautiful modern pendant lights over the breakfast bar. The bedrooms offer spacious walk in closets, both bathrooms are handicap accessible, spacious back yard for entertaining, home is only 4 years old.
Key facts
- Versatile space
- Roomy kitchen
- Handicap accessible
Tags
Property features AI
Exterior
- Utilities: Public water; Public sewer
- Home design: Single family residence; Residential property
- Construction: Slab foundation
- Exterior features: Chain link fence; Composition roof
Interior
- Kitchen: Dishwasher; Refrigerator; Range; Disposal
- Flooring: Laminate
- Bathrooms: 2 full bathrooms
- Heating & cooling: Central heating (electric); Central air; Ceiling fan(s)
- Interior features: Breakfast bar
Neighborhood map
What this means for you Summary
Snapshot
- This is a 2-bed/2.0-bath single-family listed at $140k.
Deal economics
- At list price, monthly cash flow is $-138 ($-2k/yr) — negative.
- To cash-flow at today's rent, offer at most $116k (17.4% below list).
- To meet the 1% rule (rent ≥ 1% of price), the offer needs to be $125k (10.7% below list).
- Recommended offer: $116k (17.4% below list) — sets the bar for cash-flow.
Location & tenants
- Location reads 64/100 on livability (#739 in TX) — a middle-class / working-renter tenant base. Strengths: cost of living A+, housing A+, health & safety A+; Watch: employment D, schools D-, crime F.
- Beaumont ISD (urban): math 14% / reading 22% proficiency, ranked #789 of 826 in TX (top 96%) — low school quality limits family demand, transient renter base, plan for 1-2y turnover; 69% free/reduced lunch — lower-income household profile, screen leases tightly.
- Market conditions: 73 active listings in the ZIP; 5 comparable units currently listed for rent nearby; rentals leasing fast (median 14d on market — plan ~1-2 weeks tenant-placement turnaround); 343 units permitted in Jefferson County in 2024 (0 in 5+ unit buildings).
- This rent runs 31% of the median local income ($49k/yr) — at the standard rent-burdened threshold; future hikes will face affordability resistance.
Forward outlook
- In year one you build about $10k of equity ($968 loan paydown + $9k appreciation (6.2% local appreciation)).
- By year 4, paydown + projected appreciation supports a ~$33k cash-out refi (75% LTV) — recoverable capital for the next deal without selling this one.
Negotiation context
- Only 11 days on market — expect competitive offers; lowballing is unlikely to land.
- 2 sale attempts since 8y ago with the ask held roughly flat each time — persistent listings suggest the price (not the market) is what's stuck; bring a comps-based counter.
Risks & watch-outs
- Watch-outs: flood insurance adds $66/mo.
- Climate carrying-cost: severe flood risk; severe wind risk, 99% chance of damaging wind over 30y; extreme-heat days projected 7→24/yr by 2055 (HVAC capex compounding) — expect insurance premiums to compound above CPI over the hold.
Questions for the listing agent
- What do current leases actually rent for vs. the listed asking? Can we see a recent rent roll and the last 12 months of T-12 income?
- What's the actual annual flood-insurance premium (NFIP or private), and is the property in a SFHA with mandatory coverage?
- Is there a deadline driving the sale (1031 exchange, divorce, estate, relocation)? That informs how much negotiation room exists.
- Schools are D-rated, which usually means shorter tenancies and higher turnover. Who's the typical renter profile here, and what's been the actual vacancy rate?
- Crime grade is F in this area — have there been break-ins, vandalism, or insurance claims at this property in the last 3 years? What carrier currently insures it and at what premium?
- The area grade is low — what's the realistic commute time and amenity access for the typical tenant pool here? Any planned neighborhood developments (good or bad) we should know about?
- What's the average days-on-market for RENTAL listings here right now (not sales)? A rising rental-DOM trend means longer vacancies and softer asking-rent achievability than the comps imply.
- What's the recent tenant-quality profile in this submarket — average credit score on applications, eviction rate, late-payment / NSF rate, and stable-employment percentage? A property-management company in the area should have these aggregated.
- How much new for-sale + rental construction is in the pipeline within 1–3 miles? Heavy new supply typically softens prices + rents 12–24 months out; constrained supply supports both.
Investment metrics
- 1% rule
- 0.89% ✗
- Cap rate
- 5.68%
- Cash-on-cash
- -2.19%
- DSCR
- 0.90
- GRM
- 9.3
CMA / ARV
- ARV (on-the-fly)
- $156,770
- Comps found
- 7
Show comp detail 7 sales within ~0.75 mi
| Address | Dist | Beds/Ba | Sqft | Sold | Price | $/sf | Match |
|---|---|---|---|---|---|---|---|
| 2450 Columbia St | 0.11mi | 2/2.0 | 1,404 (+9%) | 6mo | $135,000 | $96 | 74 |
| 2340 Columbia St | 0.11mi | 3/2.0 (+1) | 1,353 (+5%) | 18mo | $79,900 | $59 | 66 |
| 3190 Cartwright St | 0.36mi | 3/2.0 (+1) | 1,301 (+1%) | 14mo | $204,900 | $157 | 64 |
| 3145 Roberts St | 0.46mi | 2/1.0 | 1,290 (+0%) | 14mo | $75,000 | $58 | 62 |
| 2360 Clearview St | 0.25mi | 3/1.0 (+1) | 1,213 (-6%) | 24mo | $147,990 | $122 | 50 |
| 3137 Dorothy Ave | 0.68mi | 3/2.0 (+1) | 1,300 (+1%) | 17mo | $205,990 | $158 | 48 |
| 3131 Dorothy Ave | 0.69mi | 3/2.0 (+1) | 1,357 (+6%) | 15mo | $214,990 | $158 | 41 |
Match score weights: distance 35% · size 25% · config 20% · recency 20%. Top-matched comps best support the ARV.
Projected returns pro-forma
6.25% appreciation · 3.0% rent growth · sell at horizon
- IRR
- 12.6%
- Equity multiple
- 1.86×
- Total profit
- $33,856
- Equity at exit
- $90,249
- IRR
- 13.3%
- Equity multiple
- 3.71×
- Total profit
- $106,168
- Equity at exit
- $165,630
Cash invested: $39,200 (down + closing). Projections, not guarantees.
Landlord ↔ Tenant lean methodology
- Overall (STATE)
- 87 Strongly Landlord-Friendly
- State Texas
- 87 Strongly Landlord-Friendly · R+5
- County
- — inherits STATE
- City
- — inherits STATE
ZIP-level market 77701
- Home prices YoY
- 3.8%
- Active inventory
- 73
- Price-to-rent
- 9.3×
Monthly cashflow live
- Estimated rent
- $1,250 high interval (Pro) →
- Mortgage (P&I)
- −$734
- Tax from tax record
- −$267 /mo · $3,202/yr
- Insurance
- −$58
- Flood insurance flood zone
- −$66 /mo · $798/yr
- HOA
- −$0
- Vacancy / Maint / Mgmt
- −$263
- Net cashflow
- $-138
Break-even live
UW: 25.0% down · 7.5% · 30yr · 1.5% tax · 5.0% vac · 8.0% maint · 8.0% mgmt
Financing live
Cash to close
- Down payment
- $35,000
- Closing costs
- $4,200
- Reserves months
- —
- Total cash needed
- —
Loan-product check · same deal, 3 products live
Conventional
25% down · 7.5% · 30yr
- Down + closing
- —
- Monthly P&I
- —
- Monthly cashflow
- —
- DSCR
- —
- Eligible?
- —
Personal DTI + credit; lowest rate.
DSCR
20% down · 8.5% · 30yr
- Down + closing
- —
- Monthly P&I
- —
- Monthly cashflow
- —
- DSCR
- —
- Eligible?
- —
No personal income docs; deal must DSCR.
Hard money
10% down · 12.0% · 12mo
- Down + closing
- —
- Monthly P&I
- —
- Monthly cashflow
- —
- DSCR
- —
- Eligible?
- —
Short-term bridge; refi at stabilization.
Rent comps 5 comps
| Address | Beds | Baths | Sqft | Rent | $/sqft | DOM | Units | Dist |
|---|---|---|---|---|---|---|---|---|
| 2450 S 8th St Beaumont, TX | 3.0 | 1.0 | 940 | $1,450 | $1.54 | 13d | 1 | 0.19mi |
| 3255 Waverly St Beaumont, TX | 3.0 | 2.0 | 1152 | $1,600 | $1.39 | 23d | 1 | 0.75mi |
| 690 E Avenue Unit A Beaumont, TX | 3.0 | 1.0 | 1300 | $975 | $0.75 | 13d | 1 | 1.24mi |
| 2350 Pecos St Unit B Beaumont, TX | 1.0 | 1.0 | 980 | $935 | $0.95 | 23d | 1 | 1.31mi |
| 1425 Washington Village Pkwy Beaumont, TX | 1.0–2.0 | 1.0 | 861 | $1,065 | $1.24 | 13d | 1 | 1.33mi |
Listing history 11 events
-
2026-06-18days on market $140,000 Active 11 DOM
-
2026-06-17days on market $140,000 Active 10 DOM
-
2026-06-16days on market $140,000 Active 9 DOM
-
2026-06-15days on market $140,000 Active 8 DOM
-
2026-06-14days on market $140,000 Active 6 DOM
-
2026-06-13days on market $140,000 Active 5 DOM
-
2026-06-10days on market $140,000 Active 3 DOM
-
2026-06-09days on market $140,000 Active 2 DOM
-
2026-06-08days on market $140,000 Active 1 DOM
-
2026-06-07remarks 391-char remark
-
2026-06-07$140,000 Active 2 DOM
ⓘ Source: listings_history table (triggers on properties + properties_extension) + one-shot
backfill from property_details.listing_events for pre-trigger history.
Tax reassessment forecast TX · Resets to sale price
- Current annual tax
- $3,202 · $267/mo
- Projected year-2 tax
- $3,202 · $267/mo
- Expected delta
- $0/yr ($0/mo · 0.0%)
ⓘ Screening estimate from a state-policy table — verify with the county assessor before closing.
Climate risk First Street
- Flood 8/10 Severe FEMA zone X · 99% chance over 30 yrs
- Wildfire 1/10 Low
- Heat 9/10 Extreme 7 d/yr ≥109°F today · 24 d/yr by 30 yrs out
- Wind 9/10 Extreme 99% chance of damaging wind over 30 yrs
- Air quality 2/10 Low 1 unhealthy d/yr today · 1 by 30 yrs out
Nearby sold comps map
Loading sold comps map…
Walkable amenities ~0.75 mi
Loading nearby amenities…
Taxation est. · year 1
- Rental income
- $15,006
- − Mortgage interest
- −$7,842
- − Property taxes
- −$3,202
- − Insurance
- −$1,498
- − Repairs & maintenance
- −$1,200
- − Management
- −$1,200
- − Depreciation
- −$4,073
- Taxable loss
- −$4,010
- Est. tax savings @ 24.0%
- +$962
- After-tax cash flow
- $-693/yr
For passive investors: Depreciation is non-cash, so a rental often shows a tax loss while cash-flowing — sheltering income. Rental losses are passive: they offset passive income freely, and up to $25,000/yr can offset ordinary (W-2) income if you actively participate and your MAGI is under $100k (phasing out to $0 by $150k); unused losses carry forward. On sale, claimed depreciation is recaptured at up to 25%, and gains may owe capital-gains tax (a 1031 exchange can defer both). Figures are a year-1 estimate at your 24.0% rate — not tax advice; consult a CPA.
Schools (NCES district)
- District
- Beaumont ISD
- NCES district ID
- 4809670
- Math proficiency
- 14% ▼ -13.00%
- Reading proficiency
- 22% ▼ -7.00%
- Median HH income
- $41,683
- Composite
- 15.43/100
- National rank
- #9316
- State rank
- #789 of 826 in TX
Livability — Beaumont
- Score
- 64/100
- State rank
- #739
- US rank
- #13710
Category grades
Schools grade is shown separately in the Schools card above.
Census & demographics
- Census place
- Beaumont, TX
- County
- Jefferson County · 203,592 people
- City population
- 125,901
- Metro
- Beaumont-Port Arthur, TX
- Population (ZIP)
- 12,381
- Household income
- $49,181
- Rent vs Own
- Severe rent burden
- 516.0
Population outlook (Jefferson County) Hauer SSP2
- Today (2025)
- 259,015 people
- By 2030
- 260,685 · +0.6%
- By 2040
- 263,309 · +1.7%
- By 2050
- 265,237 · +2.4%
- By 2075
- 270,193 · +4.3%
- By 2100
- 255,628 · -1.3%
Race, ethnicity, and origin ACS 2023
- Neighborhood character
- Diverse neighborhood (Simpson 0.60)
- Race & ethnicity
- Hispanic / Latino 44% Black 44% Two or more races 21% White 8% Asian 3%
- Hispanic origin (detail)
- Mexican 38%
- Common ancestry
- Lithuanian 1%
- Foreign-born
- 21% · Canada, Vietnam
- Languages at home
- 56% English-only · Spanish 40% Vietnamese 3%
Political lean MEDSL · Jefferson
- 2024 margin
- Lean R (+8.9) · D 45.1% · R 54.0%
- 2008→2024 swing
- -11.1pp toward R · 2008: 2.2pp · 2024: -8.9pp
- All cycles
- 2024: R+8.9 2020: R+1.6 2016: R+0.5 2012: D+1.6 2008: D+2.2
Not yet ingested
- Civics
- —
Market trends
- HPI YoY
- ▲ 6.25%
- Current HPI
- 170.1843
- Rent YoY
- —
- Metro
- Beaumont-Port Arthur, TX
- State GDP YoY
- ▲ 3.95%
- F500 in state
- 110
Industry mix (Fortune 500 HQ in TX)
| Industry | F500 HQs | Revenue |
|---|---|---|
| Energy | 16 | $1,198B |
|
||
| Technology | 5 | $198B |
|
||
| Engineering / Construction | 4 | $72B |
|
||
| Energy Services | 3 | $60B |
|
||
| Utilities | 3 | $41B |
|
||
| Healthcare | 2 | $330B |
|
||
Price history
+55.6% since first listed4 events — show timeline
- 2026-06-05 Listed $140,000 BBOR
- 2019-02-07 Sold (Public Records) — Public Records
- 2019-01-18 Sold (MLS) — BBOR
- 2018-11-24 Listed $89,999 BBOR
Property tax history
+8.7%/yrLatest (2025): $3,202 · -7.3% YoY. Source: county tax records.
Cash-flow waterfall
monthlySold comps — $/sqft
last 12 mo · ≤1 miLoading sold comps…