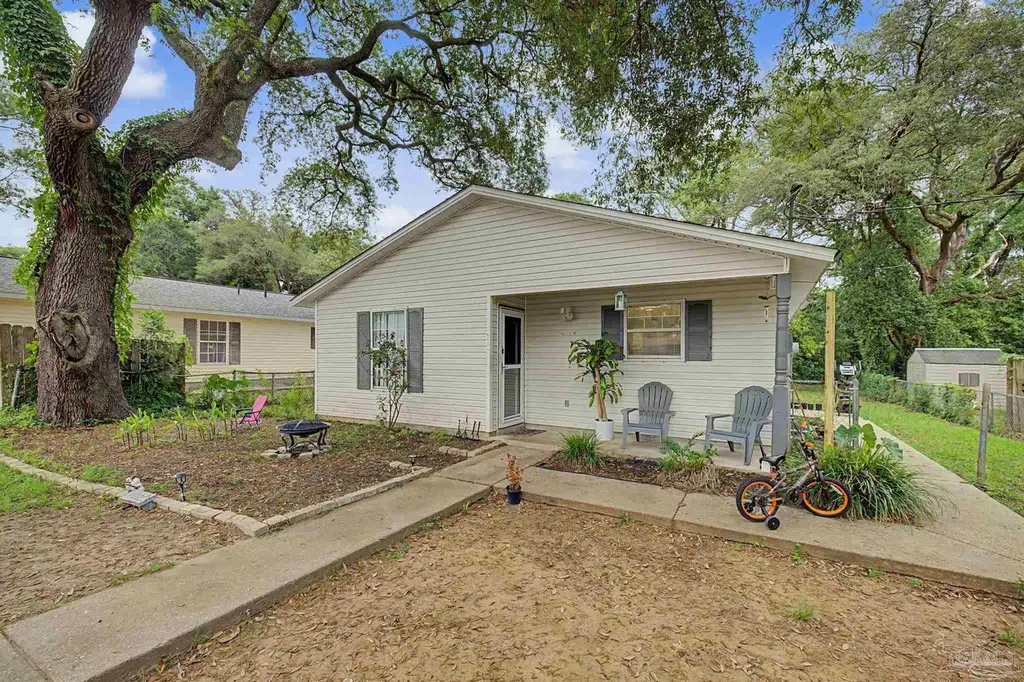
6150 Denver Ave · Bellview, FL
Flood risk 1/10 · Minimal
- FEMA flood zone
- X (unshaded)
- Chance of flooding over 30 yrs
- 0.0%
- Est. flood insurance / yr
- $507 – $1,088
Fire risk 1/10 · Minimal
- Est. fire insurance / yr
- $947 – $1,759
Heat risk 10/10 · Severe
- Hot days now (above 105°F)
- 7 days/yr
- Hot days in 30 yrs
- 23 days/yr
Wind risk 9/10 · Severe
- Chance of severe wind over 30 yrs
- 99.0%
Air-quality risk 1/10 · Minimal
- Unhealthy air days now
- 0 days/yr
- Unhealthy air days in 30 yrs
- 0 days/yr
Risk factors via First Street. Map © Google.
Why this score? — see what drove the C+ grade
The composite is a weighted blend of 9 inputs, each scored 0–100. Each bar is that input's sub-score; the figure is the points it added to the 100-point composite (weight × sub-score).
- Cash flow +26.1/30.0
- ARV discount +8.9/15.0
- DSCR +8.8/10.0
- 1% rule +5.7/10.0
- Rent growth +3.6/5.0
- Schools +3.6/10.0
- Livability +3.4/5.0
- Condition / age +2.5/5.0
- Appreciation +0.0/10.0
$195,000
🖨 Deal sheet 📄 Offer letter ✓ Due diligence
Listing remarks
ONE OF THE FINEST PENSACOLA HEIGHTS HAS TO OFFER! This home has 4 bedrooms and 2 bathrooms and its stunning and modern. .. updated within the last 5 years. This home is move-in ready and has great eye appeal! You will love the state-of- the-art gourmet kitchen, complete with a huge kitchen island! The owners are proactive and stays on top of any needed repairs! The septic tank drain lines were cleaned out recently. The roof and HVAC are less than 6 years old, but the hot water heater is original heater and absolutely no trouble with it yet according to the owners. The easy-to-clean vinyl siding is attractive and in excellent condition! The ceramic tiles outshine many homes in the area t
Key facts
- 8,712 sq ft lot
- Built 2003
- Listed 49 days
Property features AI
Finance
- HOA & community: No homeowners association
Exterior
- Parking: Driveway; Open parking available
- Utilities: Copper electrical wiring; Septic tank
- Home design: Single-story home; Resale property; Not attached to other units; Homestead property; County-maintained road access
- Construction: Frame construction; Slab foundation; Composition roof; Built as a one-level structure
- Exterior features: Interior lot
Interior
- Kitchen: Remodeled kitchen; Kitchen updated within 1–5 years
- Bedrooms: Master bedroom on the first floor (approx. 14 x 15); Additional bedroom on the first floor (approx. 14 x 9)
- Flooring: See remarks
- Bathrooms: Two full bathrooms; Bathrooms recently updated (within 1–5 years)
- Heating & cooling: Central heating; Central air conditioning
- Interior features: Bonus room; Storm door(s)
- Laundry & utility: Electric water heater
Neighborhood map
What this means for you Summary
Snapshot
- This is a 4-bed/1.0-bath single-family listed at $195k.
Deal economics
- At list price, monthly cash flow is $494 ($6k/yr) — positive.
- The deal already cash-flows at list — no discount required.
- Meets the 1% rule at list price ($2k rent vs $195k).
- Recommended offer: $189k (3.0% below list) — sets the bar for market timing.
- Cap rate 9.3% vs local median 5.2% in Bellview — top-decile yield for the area; either an underpriced asset or a hidden risk that comps aren't pricing in. Stress-test before assuming the spread holds.
Location & tenants
- Location reads 67/100 on livability (#561 in FL) — a middle-class / working-renter tenant base. Strengths: cost of living A+, housing A+; Watch: schools D+, amenities F, commute F.
- Escambia (suburban): math 40% / reading 45% proficiency, ranked #56 of 73 in FL (top 77%) — families likely to look elsewhere, expect single-tenant / working-renter base with shorter leases.
- Market conditions: Rents rising fast (+4.4%/yr); 417 active listings in the ZIP; 10 comparable units currently listed for rent nearby; rentals at typical pace (median 24d on market — plan ~3-4 weeks tenant-placement turnaround); solid renter incomes; 1,479 units permitted in Escambia County in 2024 (0 in 5+ unit buildings).
- This rent runs 33% of the median local income ($75k/yr) — at the standard rent-burdened threshold; future hikes will face affordability resistance.
Forward outlook
- Local home prices are declining (-3.0%/yr); year-one equity from $1k of loan paydown is wiped out by about $6k of value loss. Plan a longer hold.
- Escambia County population projected at +13% by 2050 — modest demand growth; plan on rents tracking national, not racing it.
- At projected returns (-3.0% appreciation + 4.4% rent growth), your $55k cash investment doubles in ~9 years — after that, you're playing with house money.
Negotiation context
- It's been on market 49 days — a 3% lower offer ($189k) is reasonable based on typical stale-listing flexibility.
- 2 sale attempts since 7y ago; this cycle's ask has dropped $15k (7%) from the opening price — seller is motivated, your offer sets the floor, not the list.
Risks & watch-outs
- Climate carrying-cost: severe wind risk, 99% chance of damaging wind over 30y; extreme-heat days projected 7→23/yr by 2055 (HVAC capex compounding) — expect insurance premiums to compound above CPI over the hold.
Questions for the listing agent
- It's been on market 49 days. Have you received any prior offers? Is the seller open to a 3% concession, seller financing, or rate buy-down credit?
- Is there a deadline driving the sale (1031 exchange, divorce, estate, relocation)? That informs how much negotiation room exists.
- Schools are D-rated, which usually means shorter tenancies and higher turnover. Who's the typical renter profile here, and what's been the actual vacancy rate?
- What's the average days-on-market for RENTAL listings here right now (not sales)? A rising rental-DOM trend means longer vacancies and softer asking-rent achievability than the comps imply.
- What's the recent tenant-quality profile in this submarket — average credit score on applications, eviction rate, late-payment / NSF rate, and stable-employment percentage? A property-management company in the area should have these aggregated.
- How much new for-sale + rental construction is in the pipeline within 1–3 miles? Heavy new supply typically softens prices + rents 12–24 months out; constrained supply supports both.
Investment metrics
- 1% rule
- 1.07% ✓
- Cap rate
- 9.33%
- Cash-on-cash
- 10.86%
- DSCR
- 1.48
- GRM
- 7.8
CMA / ARV
- ARV (median comp)
- $201,185
- List price
- $195,000
- Delta
- -3.07%
- Verdict
- FAIR
- Comps
- 20 within 1.0 mi
Show comp detail 12 sales within ~0.75 mi
| Address | Dist | Beds/Ba | Sqft | Sold | Price | $/sf | Match |
|---|---|---|---|---|---|---|---|
| 6112 Dallas Ave | 0.21mi | 3/1.5 (-1) | 1,180 (-1%) | 9mo | $197,000 | $167 | 73 |
| 6203 Chicago Ave | 0.33mi | 3/2.0 (-1) | 1,156 (-3%) | 9mo | $210,000 | $182 | 62 |
| 6107 Louisville Ave | 0.05mi | 3/2.0 (-1) | 1,352 (+13%) | 8mo | $235,000 | $174 | 60 |
| 5903 Louisville Ave | 0.30mi | 3/1.0 (-1) | 1,048 (-12%) | 1mo | $195,000 | $186 | 60 |
| 2842 Godwin Ln | 0.67mi | 3/2.0 (-1) | 1,184 (-1%) | 3mo | $219,000 | $185 | 55 |
| 6027 Dallas Ave | 0.20mi | 3/2.0 (-1) | 1,336 (+12%) | 8mo | $239,000 | $179 | 55 |
| 2052 Sequoia Cir | 0.46mi | 3/2.0 (-1) | 1,300 (+9%) | 4mo | $229,500 | $177 | 52 |
| 1704 Garlia Ct | 0.56mi | 3/2.0 (-1) | 1,285 (+7%) | 9mo | $223,000 | $174 | 45 |
| 1523 Galvin Ave | 0.62mi | 3/2.0 (-1) | 1,333 (+12%) | 2mo | $228,000 | $171 | 41 |
| 6636 Dallas Ave | 0.67mi | 3/2.0 (-1) | 1,300 (+9%) | 4mo | $192,000 | $148 | 41 |
| 4664 Kingston Dr | 0.74mi | 3/1.5 (-1) | 1,300 (+9%) | 8mo | $200,000 | $154 | 38 |
| 1054 Simpson St | 0.62mi | 3/2.0 (-1) | 1,370 (+14%) | 8mo | $225,000 | $164 | 31 |
Match score weights: distance 35% · size 25% · config 20% · recency 20%. Top-matched comps best support the ARV.
Projected returns pro-forma
-3.0% appreciation · 4.42% rent growth · sell at horizon
- IRR
- 1.3%
- Equity multiple
- 1.05×
- Total profit
- $2,822
- Equity at exit
- $29,075
- IRR
- 12.2%
- Equity multiple
- 2.02×
- Total profit
- $55,459
- Equity at exit
- $16,860
Cash invested: $54,600 (down + closing). Projections, not guarantees.
Landlord ↔ Tenant lean methodology
- Overall (STATE)
- 87 Strongly Landlord-Friendly
- State Florida
- 87 Strongly Landlord-Friendly · R+3
- County
- — inherits STATE
- City
- — inherits STATE
ZIP-level market 32526
- Home prices YoY
- -28.3%
- Rents YoY
- 4.4%
- Active inventory
- 417
- Price-to-rent
- 7.8×
Monthly cashflow live
- Estimated rent
- $2,094 high interval (Pro) →
- Mortgage (P&I)
- −$1,023
- Tax from tax record
- −$57 /mo · $680/yr
- Insurance
- −$81
- HOA
- −$0
- Vacancy / Maint / Mgmt
- −$440
- Net cashflow
- $494
Break-even live
UW: 25.0% down · 7.5% · 30yr · 1.5% tax · 5.0% vac · 8.0% maint · 8.0% mgmt
Financing live
Cash to close
- Down payment
- $48,750
- Closing costs
- $5,850
- Reserves months
- —
- Total cash needed
- —
Loan-product check · same deal, 3 products live
Conventional
25% down · 7.5% · 30yr
- Down + closing
- —
- Monthly P&I
- —
- Monthly cashflow
- —
- DSCR
- —
- Eligible?
- —
Personal DTI + credit; lowest rate.
DSCR
20% down · 8.5% · 30yr
- Down + closing
- —
- Monthly P&I
- —
- Monthly cashflow
- —
- DSCR
- —
- Eligible?
- —
No personal income docs; deal must DSCR.
Hard money
10% down · 12.0% · 12mo
- Down + closing
- —
- Monthly P&I
- —
- Monthly cashflow
- —
- DSCR
- —
- Eligible?
- —
Short-term bridge; refi at stabilization.
Rent comps 10 comps
| Address | Beds | Baths | Sqft | Rent | $/sqft | DOM | Units | Dist |
|---|---|---|---|---|---|---|---|---|
| 6322 Louisville Ave Pensacola, FL | 3.0 | 2.0 | 1001 | $2,147 | $2.14 | 23d | 1 | 0.21mi |
| 6225 Mobile Hwy Pensacola, FL | 1.0–3.0 | 1.0–2.0 | 1036 | $2,595 | $2.50 | 14d | 15 | 0.45mi |
| 6081 Royal Port Ct Pensacola, FL | 3.0 | 2.5 | 1428 | $1,850 | $1.30 | 23d | 1 | 0.52mi |
| 5472 Dover Ave Pensacola, FL | 3.0 | 2.0 | 840 | $1,300 | $1.55 | 23d | 1 | 0.60mi |
| 5877 Tryton Cir Pensacola, FL | 4.0 | 2.0 | 1419 | $1,825 | $1.29 | 23d | 1 | 0.72mi |
| 2702 Massachusetts Ave Pensacola, FL | 1.0–3.0 | 1.0–2.5 | 1150 | $1,745 | $1.52 | 14d | 9 | 1.16mi |
| 2821 Hillcrest Ave #7 Pensacola, FL | 3.0 | 2.0 | 1000 | $1,195 | $1.20 | 14d | 1 | 1.37mi |
| 3230 Palmdale Ave Pensacola, FL | 3.0 | 2.0 | 1300 | $1,500 | $1.15 | 23d | 1 | 1.37mi |
| 3216 Two Sisters Way Pensacola, FL | 3.0 | 2.0 | 1117 | $1,700 | $1.52 | 23d | 1 | 1.44mi |
| 4930 Laceiba Dr Pensacola, FL | 3.0 | 1.5 | 1020 | $1,300 | $1.27 | 21d | 1 | 1.45mi |
Listing history 17 events
-
2026-06-18days on market $195,000 Active 49 DOM
-
2026-06-17days on market $195,000 Active 48 DOM
-
2026-06-16days on market $195,000 Active 47 DOM
-
2026-06-15days on market $195,000 Active 46 DOM
-
2026-06-14days on market $195,000 Active 44 DOM
-
2026-06-10days on market $195,000 Active 41 DOM
-
2026-06-09days on market $195,000 Active 40 DOM
-
2026-06-08days on market $195,000 Active 39 DOM
-
2026-06-07days on market $195,000 Active 38 DOM
-
2026-06-03days on market $195,000 Active 34 DOM
-
2026-06-02days on market $195,000 Active 33 DOM
-
2026-06-01days on market $195,000 Active 32 DOM
-
2026-05-31days on market $195,000 Active 31 DOM
-
2026-05-31days on market $195,000 Active 30 DOM
-
2026-04-28$210,000 Active 1247-char remark
-
2020-02-01historical
-
2019-11-19$114,900
ⓘ Source: listings_history table (triggers on properties + properties_extension) + one-shot
backfill from property_details.listing_events for pre-trigger history.
Tax reassessment forecast FL · Resets to sale price
- Current annual tax
- $680 · $57/mo
- Projected year-2 tax
- $1,618 · $135/mo
- Expected delta
- +$938/yr (+$78/mo · 138.0%)
ⓘ Screening estimate from a state-policy table — verify with the county assessor before closing.
Climate risk First Street
- Flood 1/10 Low FEMA zone X (unshaded) · 0% chance over 30 yrs
- Wildfire 1/10 Low
- Heat 10/10 Extreme 7 d/yr ≥105°F today · 23 d/yr by 30 yrs out
- Wind 9/10 Extreme 99% chance of damaging wind over 30 yrs
- Air quality 1/10 Low 0 unhealthy d/yr today · 0 by 30 yrs out
Nearby sold comps map
Loading sold comps map…
Walkable amenities ~0.75 mi
Loading nearby amenities…
Taxation est. · year 1
- Rental income
- $25,133
- − Mortgage interest
- −$10,923
- − Property taxes
- −$680
- − Insurance
- −$975
- − Repairs & maintenance
- −$2,011
- − Management
- −$2,011
- − Depreciation
- −$5,673
- Taxable income
- $2,861
- Est. tax owed @ 24.0%
- −$687
- After-tax cash flow
- $5,242/yr
For passive investors: Depreciation is non-cash, so a rental often shows a tax loss while cash-flowing — sheltering income. Rental losses are passive: they offset passive income freely, and up to $25,000/yr can offset ordinary (W-2) income if you actively participate and your MAGI is under $100k (phasing out to $0 by $150k); unused losses carry forward. On sale, claimed depreciation is recaptured at up to 25%, and gains may owe capital-gains tax (a 1031 exchange can defer both). Figures are a year-1 estimate at your 24.0% rate — not tax advice; consult a CPA.
Schools (NCES district)
- District
- Escambia
- NCES district ID
- 1200510
- Math proficiency
- 40% ▼ -9.00%
- Reading proficiency
- 45% ▼ -4.00%
- Median HH income
- $44,649
- Composite
- 36.04/100
- National rank
- #4773
- State rank
- #56 of 73 in FL
Livability — Bellview
- Score
- 67/100
- State rank
- #561
- US rank
- #10731
Category grades
Schools grade is shown separately in the Schools card above.
Census & demographics
- Census place
- Bellview, FL
- County
- Escambia County · 301,722 people
- Metro
- Pensacola-Ferry Pass-Brent, FL
- Population (ZIP)
- 44,680
- Household income
- $75,098
- Rent vs Own
- Severe rent burden
- 1166.0
Population outlook (Escambia County) Hauer SSP2
- Today (2025)
- 334,637 people
- By 2030
- 345,779 · +3.3%
- By 2040
- 364,828 · +9.0%
- By 2050
- 378,514 · +13.1%
- By 2075
- 403,220 · +20.5%
- By 2100
- 386,125 · +15.4%
Race, ethnicity, and origin ACS 2023
- Neighborhood character
- Predominantly White (66%)
- Race & ethnicity
- White 66% Black 19% Two or more races 8% Hispanic / Latino 5% Asian 3%
- Common ancestry
- Lithuanian 2% Slovak 2% Serbian 2%
- Foreign-born
- 5% · Canada, China
- Languages at home
- 94% English-only · Spanish 2% Tagalog/Filipino 1% Other Indo-European 1%
Political lean MEDSL · Escambia
- 2024 margin
- R (+19.5) · D 39.7% · R 59.2% · Other 1.1%
- 2008→2024 swing
- -0.2pp no change · 2008: -19.3pp · 2024: -19.5pp
- All cycles
- 2024: R+19.5 2020: R+15.1 2016: R+20.6 2012: R+20.6 2008: R+19.3
Not yet ingested
- Civics
- —
Market trends
- HPI YoY
- ▼ -99.68%
- Current HPI
- 252.6406
- Rent YoY
- ▲ 4.42%
- Metro
- Pensacola-Ferry Pass-Brent, FL
- State GDP YoY
- ▲ 3.28%
- F500 in state
- 36
Industry mix (Fortune 500 HQ in FL)
| Industry | F500 HQs | Revenue |
|---|---|---|
| Industrial Technology | 2 | $29B |
|
||
| Insurance | 2 | $17B |
|
||
| Retail | 1 | $60B |
|
||
| Technology Distribution | 1 | $58B |
|
||
| Homebuilding | 1 | $35B |
|
||
| Technology Manufacturing | 1 | $35B |
|
||
Price history
+69.7% since first listed4 events — show timeline
- 2026-05-22 Price Changed $195,000 PARMLS
- 2026-04-28 Listed $210,000 PARMLS
- 2020-02-01 Listing Removed — PARMLS
- 2019-11-19 Listed $114,900 PARMLS
Property tax history
+3.0%/yrLatest (2025): $680 · +24.6% YoY. Source: county tax records.
Cash-flow waterfall
monthlySold comps — $/sqft
last 12 mo · ≤1 miLoading sold comps…