 🏗️ New Construction
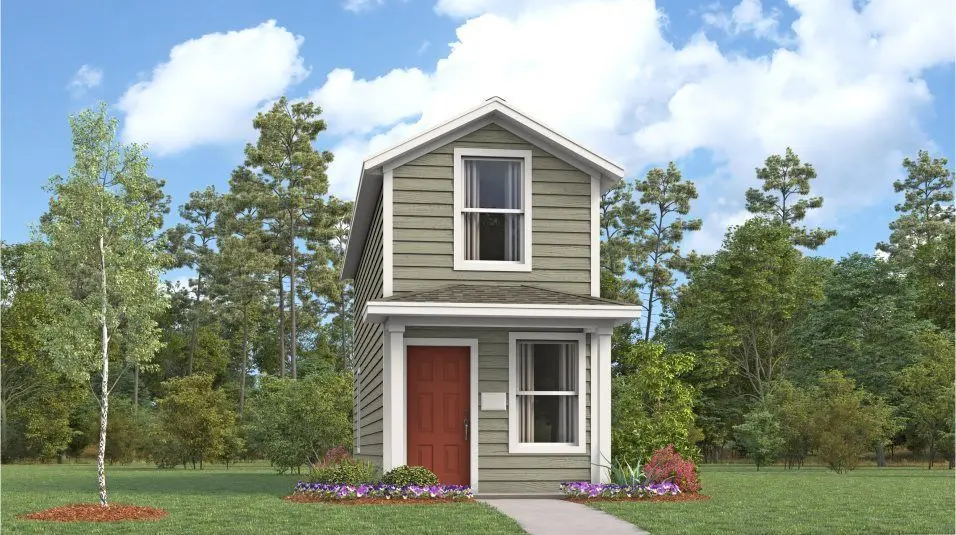
Henley Plan · San Antonio, TX
Flood risk No data
- FEMA flood zone
- —
- Chance of flooding over 30 yrs
- —
- Est. flood insurance / yr
- —
Fire risk No data
- Est. fire insurance / yr
- —
Heat risk No data
- Hot days now (above threshold)
- —
- Hot days in 30 yrs
- —
Wind risk No data
- Chance of severe wind over 30 yrs
- —
Air-quality risk No data
- Unhealthy air days now
- —
- Unhealthy air days in 30 yrs
- —
Risk factors via First Street. Map © Google.
Why this score? — see what drove the D grade
The composite is a weighted blend of 9 inputs, each scored 0–100. Each bar is that input's sub-score; the figure is the points it added to the 100-point composite (weight × sub-score).
- Cash flow +14.2/30.0
- ARV discount +7.5/15.0
- Condition / age +4.8/5.0
- DSCR +4.3/10.0
- 1% rule +4.0/10.0
- Livability +4.0/5.0
- Rent growth +2.2/5.0
- Schools +1.9/10.0
- Appreciation +0.0/10.0
$129,999
🖨 Deal sheet 📄 Offer letter ✓ Due diligence
Listing remarks MLS
The first level of this two-story home is host to an open floorplan shared between the kitchen and living room, helping to maximize the footprint of the home. The owner's suite is situated at the back of the home, complete with an en-suite bathroom. Upstairs, a versatile loft provides additional shared living space with another bathroom.
Key facts
- Listed 591 days
Neighborhood map
What this means for you Summary
Snapshot
- This is a 1-bed/2.0-bath single-family listed at $130k. Condition is rated excellent.
Deal economics
- At list price, monthly cash flow is $21 ($252/yr) — positive.
- The deal already cash-flows at list — no discount required.
- To meet the 1% rule (rent ≥ 1% of price), the offer needs to be $116k (10.7% below list).
- Recommended offer: $114k (12.0% below list) — sets the bar for market timing.
- Cap rate 6.5% vs local median 3.8% in San Antonio — top-decile yield for the area; either an underpriced asset or a hidden risk that comps aren't pricing in. Stress-test before assuming the spread holds.
Location & tenants
- Location reads 80/100 on livability (#31 in TX, #1,616 nationally) — a professional / high-income tenant draw. Strengths: amenities A+, commute A+, cost of living A+; Watch: schools C-, crime F.
- East Central ISD (rural): math 16% / reading 25% proficiency, ranked #758 of 826 in TX (top 92%) — low school quality limits family demand, transient renter base, plan for 1-2y turnover; 61% free/reduced lunch — lower-income household profile, screen leases tightly.
- Market conditions: Rents soft (-1.1%/yr); 1152 active listings in the ZIP; 1 comparable units currently listed for rent nearby; solid renter incomes; 8,308 units permitted in Bexar County in 2024 (2,506 in 5+ unit buildings).
- This rent is only 15% of the median local income ($91k/yr) — well below the 30% rent-burden line; pricing power to push rent on renewal without tenant pushback.
Forward outlook
- Local home prices are declining (-3.0%/yr); year-one equity from $896 of loan paydown is wiped out by about $4k of value loss. Plan a longer hold.
- Bexar County population projected at +50% by 2050 — long-run rental-demand tailwind backs the buy-and-hold thesis.
Negotiation context
- It's been on market 591 days — a 12% lower offer ($114k) is reasonable based on typical stale-listing flexibility.
Questions for the listing agent
- It's been on market 591 days. Have you received any prior offers? Is the seller open to a 12% concession, seller financing, or rate buy-down credit?
- Why hasn't it sold? Are there any deal-killer items the seller is aware of (foundation, flood, title, zoning, code violations)?
- Is there a deadline driving the sale (1031 exchange, divorce, estate, relocation)? That informs how much negotiation room exists.
- Crime grade is F in this area — have there been break-ins, vandalism, or insurance claims at this property in the last 3 years? What carrier currently insures it and at what premium?
- The area grade is low — what's the realistic commute time and amenity access for the typical tenant pool here? Any planned neighborhood developments (good or bad) we should know about?
- What's the average days-on-market for RENTAL listings here right now (not sales)? A rising rental-DOM trend means longer vacancies and softer asking-rent achievability than the comps imply.
- What's the recent tenant-quality profile in this submarket — average credit score on applications, eviction rate, late-payment / NSF rate, and stable-employment percentage? A property-management company in the area should have these aggregated.
- How much new for-sale + rental construction is in the pipeline within 1–3 miles? Heavy new supply typically softens prices + rents 12–24 months out; constrained supply supports both.
Investment metrics
- 1% rule
- 0.90% ✗
- Cap rate
- 6.49%
- Cash-on-cash
- 0.69%
- DSCR
- 1.03
- GRM
- 9.3
CMA / ARV
- ARV (median comp)
- $129,596
- List price
- $129,999
- Delta
- 0.31%
- Verdict
- FAIR
- Comps
- 20 within 1.0 mi
Show comp detail 6 sales within ~0.75 mi
| Address | Dist | Beds/Ba | Sqft | Sold | Price | $/sf | Match |
|---|---|---|---|---|---|---|---|
| 5030 Daisy Blossom | 0.13mi | 1/2.0 | 661 (0%) | 13mo | $137,999 | $209 | 83 |
| 5010 Daisy Blossom | 0.13mi | 1/2.0 | 661 (0%) | 14mo | $127,999 | $194 | 83 |
| 4978 Daisy Blossom | 0.12mi | 1/2.0 | 661 (0%) | 14mo | $129,709 | $196 | 83 |
| 5023 Daisy Blossom | 0.10mi | 1/2.0 | 661 (0%) | 16mo | $113,999 | $172 | 82 |
| 5011 Daisy Blossom | 0.10mi | 1/2.0 | 661 (0%) | 16mo | $106,739 | $161 | 82 |
| 4962 Daisy Blossom | 0.12mi | 1/2.0 | 661 (0%) | 16mo | $125,139 | $189 | 81 |
Match score weights: distance 35% · size 25% · config 20% · recency 20%. Top-matched comps best support the ARV.
Projected returns pro-forma
-3.0% appreciation · 0.0% rent growth · sell at horizon
- IRR
- -18.6%
- Equity multiple
- 0.36×
- Total profit
- $-23,046
- Equity at exit
- $19,323
- IRR
- -18.6%
- Equity multiple
- 0.13×
- Total profit
- $-31,416
- Equity at exit
- $11,205
Cash invested: $36,287 (down + closing). Projections, not guarantees.
Landlord ↔ Tenant lean methodology
- Overall (STATE)
- 87 Strongly Landlord-Friendly
- State Texas
- 87 Strongly Landlord-Friendly · R+5
- County
- — inherits STATE
- City
- — inherits STATE
ZIP-level market 78109
- Home prices YoY
- -17.8%
- Rents YoY
- -1.1%
- Active inventory
- 1152
- Price-to-rent
- 9.3×
Monthly cashflow live
- Estimated rent
- $1,160 medium interval (Pro) →
- Mortgage (P&I)
- −$680
- Tax est. 1.5%
- −$162 /mo · $1,944/yr
- Insurance
- −$54
- HOA
- −$0
- Vacancy / Maint / Mgmt
- −$244
- Net cashflow
- $21
Break-even live
UW: 25.0% down · 7.5% · 30yr · 1.5% tax · 5.0% vac · 8.0% maint · 8.0% mgmt
Financing live
Cash to close
- Down payment
- $32,399
- Closing costs
- $3,888
- Reserves months
- —
- Total cash needed
- —
Loan-product check · same deal, 3 products live
Conventional
25% down · 7.5% · 30yr
- Down + closing
- —
- Monthly P&I
- —
- Monthly cashflow
- —
- DSCR
- —
- Eligible?
- —
Personal DTI + credit; lowest rate.
DSCR
20% down · 8.5% · 30yr
- Down + closing
- —
- Monthly P&I
- —
- Monthly cashflow
- —
- DSCR
- —
- Eligible?
- —
No personal income docs; deal must DSCR.
Hard money
10% down · 12.0% · 12mo
- Down + closing
- —
- Monthly P&I
- —
- Monthly cashflow
- —
- DSCR
- —
- Eligible?
- —
Short-term bridge; refi at stabilization.
Rent comps 1 comps
| Address | Beds | Baths | Sqft | Rent | $/sqft | DOM | Units | Dist |
|---|---|---|---|---|---|---|---|---|
| 12414 San Crispin Converse, TX | 1.0 | 1.0 | 675 | $970 | $1.44 | 44d | 1 | 0.87mi |
Listing history 22 events
-
2026-06-18days on market $129,999 Active 591 DOM
-
2026-06-17days on market $129,999 Active 590 DOM
-
2026-06-16days on market $129,999 Active 589 DOM
-
2026-06-15days on market $129,999 Active 588 DOM
-
2026-06-13days on market $129,999 Active 586 DOM
-
2026-06-09days on market $129,999 Active 582 DOM
-
2026-06-08days on market $129,999 Active 581 DOM
-
2026-06-07days on market $129,999 Active 580 DOM
-
2026-06-04days on market $129,999 Active 577 DOM
-
2026-06-03days on market $129,999 Active 576 DOM
-
2026-06-02days on market $129,999 Active 575 DOM
-
2026-06-01days on market $129,999 Active 574 DOM
-
2026-05-31days on market $129,999 Active 573 DOM
-
2025-08-23price $129,999 339-char remark
Show marketing remark (339 chars)
The first level of this two-story home is host to an open floorplan shared between the kitchen and living room, helping to maximize the footprint of the home. The owner's suite is situated at the back of the home, complete with an en-suite bathroom. Upstairs, a versatile loft provides additional shared living space with another bathroom.
-
2025-03-11price $147,999 339-char remark
Show marketing remark (339 chars)
The first level of this two-story home is host to an open floorplan shared between the kitchen and living room, helping to maximize the footprint of the home. The owner's suite is situated at the back of the home, complete with an en-suite bathroom. Upstairs, a versatile loft provides additional shared living space with another bathroom.
-
2024-12-08price $137,999 339-char remark
Show marketing remark (339 chars)
The first level of this two-story home is host to an open floorplan shared between the kitchen and living room, helping to maximize the footprint of the home. The owner's suite is situated at the back of the home, complete with an en-suite bathroom. Upstairs, a versatile loft provides additional shared living space with another bathroom.
-
2024-11-26price $140,999 339-char remark
Show marketing remark (339 chars)
The first level of this two-story home is host to an open floorplan shared between the kitchen and living room, helping to maximize the footprint of the home. The owner's suite is situated at the back of the home, complete with an en-suite bathroom. Upstairs, a versatile loft provides additional shared living space with another bathroom.
-
2024-11-23price $143,999 339-char remark
Show marketing remark (339 chars)
The first level of this two-story home is host to an open floorplan shared between the kitchen and living room, helping to maximize the footprint of the home. The owner's suite is situated at the back of the home, complete with an en-suite bathroom. Upstairs, a versatile loft provides additional shared living space with another bathroom.
-
2024-11-18price $145,999 339-char remark
Show marketing remark (339 chars)
The first level of this two-story home is host to an open floorplan shared between the kitchen and living room, helping to maximize the footprint of the home. The owner's suite is situated at the back of the home, complete with an en-suite bathroom. Upstairs, a versatile loft provides additional shared living space with another bathroom.
-
2024-11-15price $148,999 339-char remark
Show marketing remark (339 chars)
The first level of this two-story home is host to an open floorplan shared between the kitchen and living room, helping to maximize the footprint of the home. The owner's suite is situated at the back of the home, complete with an en-suite bathroom. Upstairs, a versatile loft provides additional shared living space with another bathroom.
-
2024-11-09price $154,999 339-char remark
Show marketing remark (339 chars)
The first level of this two-story home is host to an open floorplan shared between the kitchen and living room, helping to maximize the footprint of the home. The owner's suite is situated at the back of the home, complete with an en-suite bathroom. Upstairs, a versatile loft provides additional shared living space with another bathroom.
-
2024-11-04$159,999 Active 339-char remark
Show marketing remark (339 chars)
The first level of this two-story home is host to an open floorplan shared between the kitchen and living room, helping to maximize the footprint of the home. The owner's suite is situated at the back of the home, complete with an en-suite bathroom. Upstairs, a versatile loft provides additional shared living space with another bathroom.
ⓘ Source: listings_history table (triggers on properties + properties_extension) + one-shot
backfill from property_details.listing_events for pre-trigger history.
Nearby sold comps map
Loading sold comps map…
Walkable amenities ~0.75 mi
Loading nearby amenities…
Taxation est. · year 1
- Rental income
- $13,923
- − Mortgage interest
- −$7,259
- − Property taxes
- −$1,944
- − Insurance
- −$648
- − Repairs & maintenance
- −$1,114
- − Management
- −$1,114
- − Depreciation
- −$3,770
- Taxable loss
- −$1,926
- Est. tax savings @ 24.0%
- +$462
- After-tax cash flow
- $714/yr
For passive investors: Depreciation is non-cash, so a rental often shows a tax loss while cash-flowing — sheltering income. Rental losses are passive: they offset passive income freely, and up to $25,000/yr can offset ordinary (W-2) income if you actively participate and your MAGI is under $100k (phasing out to $0 by $150k); unused losses carry forward. On sale, claimed depreciation is recaptured at up to 25%, and gains may owe capital-gains tax (a 1031 exchange can defer both). Figures are a year-1 estimate at your 24.0% rate — not tax advice; consult a CPA.
Condition & rehab AI · 6 photos
This single-family home is in excellent condition with modern finishes and a well-maintained exterior. It offers a good return on investment with minimal updates needed to enhance its curb appeal and marketability.
Value-add opportunities
- Both Painting exterior siding — Enhances curb appeal and value.
- Both Landscaping improvements — Enhances curb appeal and value.
- Both Add smart home features — Improves convenience and marketability.
- Both Install energy-efficient windows — Reduces energy costs and enhances curb appeal.
Renovation cost estimate screening
Value-add ROI direction
- Both Painting exterior siding — Enhances curb appeal and value. ↑
- Both Landscaping improvements — Enhances curb appeal and value. ↑
- Both Add smart home features — Improves convenience and marketability. ↑
- Both Install energy-efficient windows — Reduces energy costs and enhances curb appeal. ↑
ⓘ Cost ranges are severity-bucket heuristics (US national rule-of-thumb). Get contractor quotes + a written scope before underwriting a rehab budget.
Schools (NCES district)
- District
- East Central ISD
- NCES district ID
- 4817850
- Math proficiency
- 16% ▼ -12.00%
- Reading proficiency
- 25% ▼ -6.00%
- Median HH income
- $53,941
- Composite
- 18.67/100
- National rank
- #8887
- State rank
- #758 of 826 in TX
Livability — San Antonio
- Score
- 80/100
- State rank
- #31
- US rank
- #1616
Category grades
Schools grade is shown separately in the Schools card above.
Census & demographics
- County
- Bexar County · 1,990,555 people
- City population
- 1,806,925
- Metro
- San Antonio-New Braunfels, TX
- Population (ZIP)
- 63,067
- Household income
- $91,320
- Rent vs Own
- Severe rent burden
- 1732.0
Population outlook (Bexar County) Hauer SSP2
- Today (2025)
- 2,336,851 people
- By 2030
- 2,560,728 · +9.6%
- By 2040
- 3,020,569 · +29.3%
- By 2050
- 3,493,522 · +49.5%
- By 2075
- 4,668,459 · +99.8%
- By 2100
- 5,533,242 · +136.8%
Race, ethnicity, and origin ACS 2023
- Neighborhood character
- Diverse neighborhood (Simpson 0.69)
- Race & ethnicity
- Hispanic / Latino 44% White 27% Two or more races 21% Black 21% Asian 3%
- Hispanic origin (detail)
- Mexican 29% Puerto Rican 4%
- Common ancestry
- Lithuanian 1% Romanian 1% Italian 1%
- Foreign-born
- 11% · Canada, Vietnam, South Korea
- Languages at home
- 71% English-only · Spanish 23% Tagalog/Filipino 1% Other Asian/Pacific 1%
Political lean MEDSL · Bexar
- 2024 margin
- Lean D (+9.8) · D 54.3% · R 44.6% · Other 1.1%
- 2008→2024 swing
- +4.2pp toward D · 2008: 5.6pp · 2024: 9.8pp
- All cycles
- 2024: D+9.8 2020: D+18.2 2016: D+13.5 2012: D+4.6 2008: D+5.6
Not yet ingested
- Civics
- —
Market trends
- HPI YoY
- ▼ -51.02%
- Current HPI
- 236.4923
- Rent YoY
- ▼ -1.08%
- Metro
- San Antonio-New Braunfels, TX
- State GDP YoY
- ▲ 3.95%
- F500 in state
- 110
Industry mix (Fortune 500 HQ in TX)
| Industry | F500 HQs | Revenue |
|---|---|---|
| Energy | 16 | $1,198B |
|
||
| Technology | 5 | $198B |
|
||
| Engineering / Construction | 4 | $72B |
|
||
| Energy Services | 3 | $60B |
|
||
| Utilities | 3 | $41B |
|
||
| Healthcare | 2 | $330B |
|
||
Price history
-18.8% since first listed9 events — show timeline
- 2025-08-23 Price Changed $129,999 Zillow
- 2025-03-11 Price Changed $147,999 Zillow
- 2024-12-08 Price Changed $137,999 Zillow
- 2024-11-26 Price Changed $140,999 Zillow
- 2024-11-23 Price Changed $143,999 Zillow
- 2024-11-18 Price Changed $145,999 Zillow
- 2024-11-15 Price Changed $148,999 Zillow
- 2024-11-09 Price Changed $154,999 Zillow
- 2024-11-04 Listed $159,999 Zillow
Cash-flow waterfall
monthlySold comps — $/sqft
last 12 mo · ≤1 miLoading sold comps…