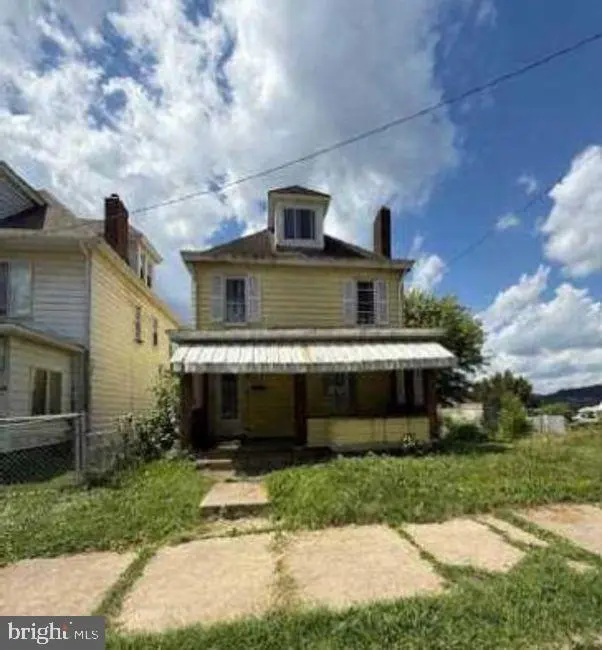
1341 Taylor Ave · New Kensington, PA
Flood risk 1/10 · Minimal
- FEMA flood zone
- X (unshaded)
- Chance of flooding over 30 yrs
- 0.0%
- Est. flood insurance / yr
- $507 – $1,088
Fire risk 1/10 · Minimal
- Est. fire insurance / yr
- $511 – $949
Heat risk 4/10 · Minor
- Hot days now (above 97°F)
- 7 days/yr
- Hot days in 30 yrs
- 18 days/yr
Wind risk 2/10 · Minimal
- Chance of severe wind over 30 yrs
- 0.0%
Air-quality risk 4/10 · Minor
- Unhealthy air days now
- 5 days/yr
- Unhealthy air days in 30 yrs
- 6 days/yr
Risk factors via First Street. Map © Google.
Why this score? — see what drove the B- grade
The composite is a weighted blend of 9 inputs, each scored 0–100. Each bar is that input's sub-score; the figure is the points it added to the 100-point composite (weight × sub-score).
- Cash flow +30.0/30.0
- 1% rule +10.0/10.0
- DSCR +10.0/10.0
- ARV discount +7.5/15.0
- Livability +3.5/5.0
- Rent growth +3.0/5.0
- Condition / age +2.5/5.0
- Schools +1.9/10.0
- Appreciation +0.0/10.0
$37,400
🖨 Deal sheet 📄 Offer letter ✓ Due diligence
Listing remarks MLS
AUCTION-HOME CANNOT BE SHOWN - This Colonial style single family home offers 4 bedrooms and 2 bathrooms with approximately 1831 square feet of living space on a 0.11 acre lot. The foreclosure deed has been recorded, allowing for shorter closing timelines. There are no inspection or financing contingencies on this cash only purchase. No Buyer Premium on this property. The seller has closing representation in this transaction. The buyer has the right to select their own title/closing company or may use the sellers title company. The buyer is responsible for all closing costs in this transaction. It is a criminal offense to trespass on this property. NO TRESPASSING.
Key facts
- 4,791 sq ft lot
- Garage
- Built 1900
Neighborhood map
What this means for you Summary
Snapshot
- This is a 4-bed/2.0-bath other listed at $37k.
Deal economics
- At list price, monthly cash flow is $921 ($11k/yr) — positive.
- The deal already cash-flows at list — no discount required.
- Meets the 1% rule at list price ($1k rent vs $37k).
- Recommended offer: $35k (6.0% below list) — sets the bar for market timing.
- Cap rate 35.9% vs local median 7.2% in New Kensington — top-decile yield for the area; either an underpriced asset or a hidden risk that comps aren't pricing in. Stress-test before assuming the spread holds.
Location & tenants
- Location reads 69/100 on livability (#840 in PA) — a middle-class / working-renter tenant base. Strengths: cost of living A+, housing A+; Watch: schools C-, employment D, crime F.
- New Kensington-Arnold SD (suburban): math 16% / reading 31% proficiency, ranked #483 of 539 in PA (top 90%) — low school quality limits family demand, transient renter base, plan for 1-2y turnover.
- Market conditions: Rents rising (+1.9%/yr); 167 active listings in the ZIP; 5 comparable units currently listed for rent nearby; rentals leasing fast (median 2d on market — plan ~1-2 weeks tenant-placement turnaround); 415 units permitted in Westmoreland County in 2024 (10 in 5+ unit buildings).
Forward outlook
- Local home prices are declining (-3.0%/yr); year-one equity from $259 of loan paydown is wiped out by about $1k of value loss. Plan a longer hold.
- Westmoreland County population projected at -19% by 2050 — secular population decline; favor cash flow + early exit over multi-decade hold.
- At projected returns (-3.0% appreciation + 1.9% rent growth), your $10k cash investment doubles in ~2 years — after that, you're playing with house money.
Negotiation context
- It's been on market 63 days — a 6% lower offer ($35k) is reasonable based on typical stale-listing flexibility.
- 4 sale attempts since 26y ago with the ask held roughly flat each time — persistent listings suggest the price (not the market) is what's stuck; bring a comps-based counter.
Risks & watch-outs
- Watch-outs: built in 1900 — expect roof / HVAC / electrical / plumbing capex.
Questions for the listing agent
- It's been on market 63 days. Have you received any prior offers? Is the seller open to a 6% concession, seller financing, or rate buy-down credit?
- Built in 1900 — when were the roof, HVAC, electrical panel, plumbing, and water heater last replaced?
- Why hasn't it sold? Are there any deal-killer items the seller is aware of (foundation, flood, title, zoning, code violations)?
- Is there a deadline driving the sale (1031 exchange, divorce, estate, relocation)? That informs how much negotiation room exists.
- Crime grade is F in this area — have there been break-ins, vandalism, or insurance claims at this property in the last 3 years? What carrier currently insures it and at what premium?
- What's the average days-on-market for RENTAL listings here right now (not sales)? A rising rental-DOM trend means longer vacancies and softer asking-rent achievability than the comps imply.
- What's the recent tenant-quality profile in this submarket — average credit score on applications, eviction rate, late-payment / NSF rate, and stable-employment percentage? A property-management company in the area should have these aggregated.
- How much new for-sale + rental construction is in the pipeline within 1–3 miles? Heavy new supply typically softens prices + rents 12–24 months out; constrained supply supports both.
Investment metrics
- 1% rule
- 3.99% ✓
- Cap rate
- 35.85%
- Cash-on-cash
- 105.56%
- DSCR
- 5.70
- GRM
- 2.1
CMA / ARV
- ARV (median comp)
- $122,021
- List price
- $37,400
- Delta
- -69.35%
- Verdict
- UNDERPRICED
- Comps
- 20 within 1.0 mi
Projected returns pro-forma
-3.0% appreciation · 1.9% rent growth · sell at horizon
- IRR
- —
- Equity multiple
- 5.87×
- Total profit
- $51,000
- Equity at exit
- $5,576
- IRR
- —
- Equity multiple
- 11.84×
- Total profit
- $113,491
- Equity at exit
- $3,234
Cash invested: $10,472 (down + closing). Projections, not guarantees.
Landlord ↔ Tenant lean methodology
- Overall (STATE)
- 62 Landlord-Friendly
- State Pennsylvania
- 62 Landlord-Friendly · EVEN
- County
- — inherits STATE
- City
- — inherits STATE
ZIP-level market 15068
- Home prices YoY
- -12.2%
- Rents YoY
- 1.9%
- Active inventory
- 167
- Price-to-rent
- 2.1×
Monthly cashflow live
- Estimated rent
- $1,493 high interval (Pro) →
- Mortgage (P&I)
- −$196
- Tax est. 1.5%
- −$47 /mo · $561/yr
- Insurance
- −$16
- HOA
- −$0
- Vacancy / Maint / Mgmt
- −$314
- Net cashflow
- $921
Break-even live
UW: 25.0% down · 7.5% · 30yr · 1.5% tax · 5.0% vac · 8.0% maint · 8.0% mgmt
Financing live
Cash to close
- Down payment
- $9,350
- Closing costs
- $1,122
- Reserves months
- —
- Total cash needed
- —
Loan-product check · same deal, 3 products live
Conventional
25% down · 7.5% · 30yr
- Down + closing
- —
- Monthly P&I
- —
- Monthly cashflow
- —
- DSCR
- —
- Eligible?
- —
Personal DTI + credit; lowest rate.
DSCR
20% down · 8.5% · 30yr
- Down + closing
- —
- Monthly P&I
- —
- Monthly cashflow
- —
- DSCR
- —
- Eligible?
- —
No personal income docs; deal must DSCR.
Hard money
10% down · 12.0% · 12mo
- Down + closing
- —
- Monthly P&I
- —
- Monthly cashflow
- —
- DSCR
- —
- Eligible?
- —
Short-term bridge; refi at stabilization.
Rent comps 5 comps
| Address | Beds | Baths | Sqft | Rent | $/sqft | DOM | Units | Dist |
|---|---|---|---|---|---|---|---|---|
| 1330 Woodmont Ave New Kensington, PA | 3.0 | 1.0 | 1250 | $1,100 | $0.88 | 10d | 1 | 0.07mi |
| 826 North St New Kensington, PA | 4.0 | 1.5 | 1250 | $1,495 | $1.20 | 1d | 1 | 0.14mi |
| 1922 Kenneth Ave New Kensington, PA | 5.0 | 2.0 | 1800 | $2,150 | $1.19 | 7d | 1 | 0.54mi |
| 1922 Kenneth Ave New Kensington, PA | 5.0 | 2.0 | 1800 | $2,100 | $1.17 | 1d | 1 | 0.54mi |
| 300 Craigdell Rd New Kensington, PA | 3.0 | 2.0 | 1300 | $1,130 | $0.87 | 1d | 1 | 1.07mi |
Listing history 23 events
-
2026-06-18days on market $37,400 Active 63 DOM
-
2026-06-17days on market $37,400 Active 62 DOM
-
2026-06-16days on market $37,400 Active 61 DOM
-
2026-06-15days on market $37,400 Active 60 DOM
-
2026-06-13days on market $37,400 Active 58 DOM
-
2026-06-09days on market $37,400 Active 54 DOM
-
2026-06-08days on market $37,400 Active 53 DOM
-
2026-06-07days on market $37,400 Active 52 DOM
-
2026-06-05days on market $37,400 Active 49 DOM
-
2026-06-03days on market $37,400 Active 48 DOM
-
2026-06-02days on market $37,400 Active 47 DOM
-
2026-06-01days on market $37,400 Active 46 DOM
-
2026-05-31days on market $37,400 Active 45 DOM
-
2026-04-16$37,400 Active 671-char remark
Show marketing remark (671 chars)
AUCTION-HOME CANNOT BE SHOWN - This Colonial style single family home offers 4 bedrooms and 2 bathrooms with approximately 1831 square feet of living space on a 0.11 acre lot. The foreclosure deed has been recorded, allowing for shorter closing timelines. There are no inspection or financing contingencies on this cash only purchase. No Buyer Premium on this property. The seller has closing representation in this transaction. The buyer has the right to select their own title/closing company or may use the sellers title company. The buyer is responsible for all closing costs in this transaction. It is a criminal offense to trespass on this property. NO TRESPASSING.
-
2009-03-31soldstatus $77,500
-
2009-03-26soldstatus $77,500 273-char remark
Show marketing remark (273 chars)
Spacious and bright, all new kitchen & baths, new windows, carpet, tile, furnace, AC, & appliances. Full BA 1st flr. 3rd flr 24X12 w/ 3 windows, fenced yard, 1 car det‌‌‌‌‌‌‌‌‌‌‌‌ gar
-
2009-03-26price $79,900 273-char remark
Show marketing remark (273 chars)
Spacious and bright, all new kitchen & baths, new windows, carpet, tile, furnace, AC, & appliances. Full BA 1st flr. 3rd flr 24X12 w/ 3 windows, fenced yard, 1 car det‌‌‌‌‌‌‌‌‌‌‌‌ gar
-
2008-10-25$77,500 273-char remark
Show marketing remark (273 chars)
Spacious and bright, all new kitchen & baths, new windows, carpet, tile, furnace, AC, & appliances. Full BA 1st flr. 3rd flr 24X12 w/ 3 windows, fenced yard, 1 car det‌‌‌‌‌‌‌‌‌‌‌‌ gar
-
2008-04-09soldstatus $18,550
-
2008-02-08$20,000
-
2001-03-26soldstatus $37,900
-
2001-03-01soldstatus $37,900
-
2000-11-21$37,900
ⓘ Source: listings_history table (triggers on properties + properties_extension) + one-shot
backfill from property_details.listing_events for pre-trigger history.
Climate risk First Street
- Flood 1/10 Low FEMA zone X (unshaded) · 0% chance over 30 yrs
- Wildfire 1/10 Low
- Heat 4/10 Moderate 7 d/yr ≥97°F today · 18 d/yr by 30 yrs out
- Wind 2/10 Low 0% chance of damaging wind over 30 yrs
- Air quality 4/10 Moderate 5 unhealthy d/yr today · 6 by 30 yrs out
Nearby sold comps map
Loading sold comps map…
Walkable amenities ~0.75 mi
Loading nearby amenities…
Taxation est. · year 1
- Rental income
- $17,919
- − Mortgage interest
- −$2,095
- − Property taxes
- −$561
- − Insurance
- −$187
- − Repairs & maintenance
- −$1,434
- − Management
- −$1,434
- − Depreciation
- −$1,088
- Taxable income
- $11,121
- Est. tax owed @ 24.0%
- −$2,669
- After-tax cash flow
- $8,386/yr
For passive investors: Depreciation is non-cash, so a rental often shows a tax loss while cash-flowing — sheltering income. Rental losses are passive: they offset passive income freely, and up to $25,000/yr can offset ordinary (W-2) income if you actively participate and your MAGI is under $100k (phasing out to $0 by $150k); unused losses carry forward. On sale, claimed depreciation is recaptured at up to 25%, and gains may owe capital-gains tax (a 1031 exchange can defer both). Figures are a year-1 estimate at your 24.0% rate — not tax advice; consult a CPA.
Schools (NCES district)
- District
- New Kensington-Arnold SD
- NCES district ID
- 4216740
- Math proficiency
- 16% ▼ -7.00%
- Reading proficiency
- 31% ▼ -13.00%
- Median HH income
- $34,386
- Composite
- 19.26/100
- National rank
- #8805
- State rank
- #483 of 539 in PA
Livability — New Kensington
- Score
- 69/100
- State rank
- #840
- US rank
- #8791
Category grades
Schools grade is shown separately in the Schools card above.
Census & demographics
- Census place
- New Kensington, PA
- County
- Westmoreland County · 183,777 people
- City population
- 36,203
- Metro
- Pittsburgh, PA
- Population (ZIP)
- 36,203
- Household income
- $63,426
- Rent vs Own
- Severe rent burden
- 967.0
Population outlook (Westmoreland County) Hauer SSP2
- Today (2025)
- 342,555 people
- By 2030
- 331,717 · -3.2%
- By 2040
- 304,976 · -11.0%
- By 2050
- 277,444 · -19.0%
- By 2075
- 224,607 · -34.4%
- By 2100
- 171,084 · -50.1%
Race, ethnicity, and origin ACS 2023
- Neighborhood character
- Predominantly White (88%)
- Race & ethnicity
- White 88% Black 8% Two or more races 3% Hispanic / Latino 1%
- Common ancestry
- Romanian 12% Subsaharan African 2% Serbian 1%
- Foreign-born
- 1%
- Languages at home
- 97% English-only · Spanish 1% Other Indo-European 0%
Political lean MEDSL · Westmoreland
- 2024 margin
- Strong R (+28.4) · D 35.4% · R 63.9%
- 2008→2024 swing
- -11.7pp toward R · 2008: -16.7pp · 2024: -28.4pp
- All cycles
- 2024: R+28.4 2020: R+28.3 2016: R+31.3 2012: R+23.7 2008: R+16.7
Not yet ingested
- Civics
- —
Market trends
- HPI YoY
- ▼ -42.50%
- Current HPI
- 305.926
- Rent YoY
- ▲ 1.90%
- Metro
- Pittsburgh, PA
- State GDP YoY
- ▲ 1.68%
- F500 in state
- 34
Industry mix (Fortune 500 HQ in PA)
| Industry | F500 HQs | Revenue |
|---|---|---|
| Healthcare | 2 | $309B |
|
||
| Insurance | 2 | $27B |
|
||
| Telecommunications / Media | 1 | $124B |
|
||
| Industrial Distribution | 1 | $22B |
|
||
| Financial Services | 1 | $20B |
|
||
| Chemicals / Materials | 1 | $18B |
|
||
Price history
-1.3% since first listed10 events — show timeline
- 2026-04-16 Listed $37,400 BRIGHT MLS
- 2009-03-31 Sold (Public Records) $77,500 Public Records
- 2009-03-26 Price Changed $79,900 West Penn MLS
- 2009-03-26 Sold (MLS) $77,500 West Penn MLS
- 2008-10-25 Listed $77,500 West Penn MLS
- 2008-04-09 Sold (MLS) $18,550 West Penn MLS
- 2008-02-08 Listed $20,000 West Penn MLS
- 2001-03-26 Sold (MLS) $37,900 West Penn MLS
- 2001-03-01 Sold (Public Records) $37,900 Public Records
- 2000-11-21 Listed $37,900 West Penn MLS
Property tax history
+2.0%/yrLatest (2026): $2,158 · +0.0% YoY. Source: county tax records.
Cash-flow waterfall
monthlySold comps — $/sqft
last 12 mo · ≤1 miLoading sold comps…