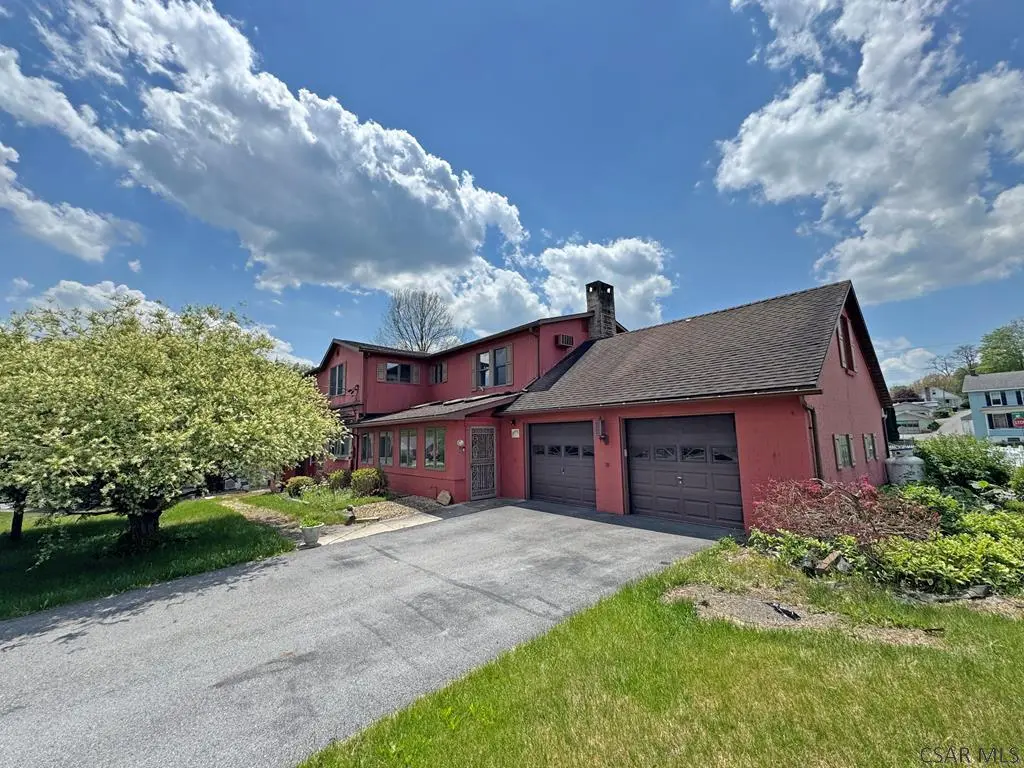
527 Main St · Summerhill, PA
Flood risk 4/10 · Minor
- FEMA flood zone
- X (unshaded)
- Chance of flooding over 30 yrs
- 0.24%
- Est. flood insurance / yr
- $473 – $860
Fire risk 1/10 · Minimal
- Est. fire insurance / yr
- $511 – $949
Heat risk 3/10 · Minor
- Hot days now (above 92°F)
- 8 days/yr
- Hot days in 30 yrs
- 20 days/yr
Wind risk 2/10 · Minimal
- Chance of severe wind over 30 yrs
- —
Air-quality risk 3/10 · Minor
- Unhealthy air days now
- 2 days/yr
- Unhealthy air days in 30 yrs
- 4 days/yr
Risk factors via First Street. Map © Google.
Why this score? — see what drove the D- grade
The composite is a weighted blend of 9 inputs, each scored 0–100. Each bar is that input's sub-score; the figure is the points it added to the 100-point composite (weight × sub-score).
- Cash flow +9.2/30.0
- Appreciation +8.1/10.0
- ARV discount +5.2/15.0
- Schools +3.7/10.0
- Livability +3.2/5.0
- 1% rule +2.6/10.0
- DSCR +2.6/10.0
- Rent growth +2.5/5.0
- Condition / age +2.5/5.0
$179,500
🖨 Deal sheet (PDF) 📄 Offer letter ✓ Due diligence
Listing remarks MLS
Large 4 bedroom home with 3.5 baths, a living room with flagstone flooring, stained glass windows, fireplace & buit in shelving, hardwood floors and ceramic tile throughout. Large eat in kitchen with many of built in appliances and a huge pantry.
Key facts
- Beamed ceilings
- Slate flooring
- Sunroom
Tags
Property features AI
Exterior
- Parking: Attached garage with garage door opener; 1 garage space
- Utilities: Public water; Public sewer; Sewer available
- Home design: Single family residence; Two levels; Two stories
- Construction: Brick and wood siding construction; Shingle roof; Partially finished and unfinished basement
- Exterior features: Corner lot; Irregular lot; City street frontage; Publicly maintained road; No pool
Interior
- Kitchen: Oven; Dishwasher; Refrigerator
- Flooring: Hardwood; Carpet; Ceramic tile; Wood; Slate
- Bathrooms: 2 full bathrooms; 1 half bathroom
- Heating & cooling: Baseboard heating; Hot water heating; Oil heating; Propane heating; Ceiling fan(s); Wall unit(s) for cooling
- Interior features: Eat-in kitchen; Entrance foyer; Pantry; Walk-in closet(s); Built-in features; Skylight(s); Double-pane windows; Two fireplaces
- Laundry & utility: Washer; Dryer; Laundry located in basement
Neighborhood map
What this means for you Summary
Snapshot
- This is a 4-bed/2.5-bath single-family listed at $180k.
Deal economics
- At list price, monthly cash flow is $-134 ($-2k/yr) — negative.
- To cash-flow at today's rent, offer at most $156k (13.2% below list).
- To meet the 1% rule (rent ≥ 1% of price), the offer needs to be $137k (23.7% below list).
- Recommended offer: $137k (23.7% below list) — sets the bar for 1% rule.
Location & tenants
- Location reads 64/100 on livability (#1,207 in PA) — a middle-class / working-renter tenant base. Strengths: cost of living A+, housing A, employment B; Watch: amenities F, commute F, health & safety F.
- Forest Hills SD (rural): math 40% / reading 47% proficiency, ranked #293 of 539 in PA (top 54%) — families likely to look elsewhere, expect single-tenant / working-renter base with shorter leases.
- Zoned schools: Forest Hills El Sch (math 43% / reading 55%, grade D, #712 of 1,518 statewide, top 47%, 957 students, 43% FRL); Forest Hills Jshs (math 37% / reading 30%, grade F, #323 of 437 statewide, top 74%, 775 students, 30% FRL) — zoned schools at 36% FRL track the district average.
- Market conditions: 3 active listings in the ZIP; 64 units permitted in Cambria County in 2024 (0 in 5+ unit buildings).
Forward outlook
- In year one you build about $12k of equity ($1k loan paydown + $11k appreciation (6.2% local appreciation)).
- Cambria County population projected at -28% by 2050 — secular population decline; favor cash flow + early exit over multi-decade hold.
- By year 3, paydown + projected appreciation supports a ~$31k cash-out refi (75% LTV) — recoverable capital for the next deal without selling this one.
Negotiation context
- It's been on market 26 days — a 2% lower offer ($177k) is reasonable based on typical stale-listing flexibility.
- 2 sale attempts since 14y ago with the ask held roughly flat each time — persistent listings suggest the price (not the market) is what's stuck; bring a comps-based counter.
- Current owner paid $143k; 25% above their basis — modest negotiation headroom, anchor on the comps not their cost.
Questions for the listing agent
- What do current leases actually rent for vs. the listed asking? Can we see a recent rent roll and the last 12 months of T-12 income?
- Is there a deadline driving the sale (1031 exchange, divorce, estate, relocation)? That informs how much negotiation room exists.
- Schools are D-rated, which usually means shorter tenancies and higher turnover. Who's the typical renter profile here, and what's been the actual vacancy rate?
- The area grade is low — what's the realistic commute time and amenity access for the typical tenant pool here? Any planned neighborhood developments (good or bad) we should know about?
- What's the average days-on-market for RENTAL listings here right now (not sales)? A rising rental-DOM trend means longer vacancies and softer asking-rent achievability than the comps imply.
- What's the recent tenant-quality profile in this submarket — average credit score on applications, eviction rate, late-payment / NSF rate, and stable-employment percentage? A property-management company in the area should have these aggregated.
- How much new for-sale + rental construction is in the pipeline within 1–3 miles? Heavy new supply typically softens prices + rents 12–24 months out; constrained supply supports both.
Investment metrics
- 1% rule
- 0.76% ✗
- Cap rate
- 5.40%
- Cash-on-cash
- -3.20%
- DSCR
- 0.86
- GRM
- 10.9
CMA / ARV
- ARV (on-the-fly)
- $170,625
- Comps found
- 1
Show comp detail 1 sale within ~0.75 mi
| Address | Dist | Beds/Ba | Sqft | Sold | Price | $/sf | Match |
|---|---|---|---|---|---|---|---|
| 255 Croyle St | 0.22mi | 3/1.5 (-1) | 2,400 (-9%) | 18mo | $155,000 | $65 | 52 |
Match score weights: distance 35% · size 25% · config 20% · recency 20%. Top-matched comps best support the ARV.
Projected returns pro-forma
6.24% appreciation · 3.0% rent growth · sell at horizon
- IRR
- 13.4%
- Equity multiple
- 1.91×
- Total profit
- $45,866
- Equity at exit
- $115,582
- IRR
- 13.8%
- Equity multiple
- 3.80×
- Total profit
- $140,963
- Equity at exit
- $212,009
Cash invested: $50,260 (down + closing). Projections, not guarantees.
Landlord ↔ Tenant lean methodology
- Overall (STATE)
- 62 Landlord-Friendly
- State Pennsylvania
- 62 Landlord-Friendly · EVEN
- County
- — inherits STATE
- City
- — inherits STATE
ZIP-level market 15958
- Home prices YoY
- 5.1%
- Active inventory
- 3
- Price-to-rent
- 10.9×
Monthly cashflow live
- Estimated rent
- $1,369 medium interval (Pro) →
- Mortgage (P&I)
- −$941
- Tax from tax record
- −$199 /mo · $2,393/yr
- Insurance
- −$75
- HOA
- −$0
- Vacancy / Maint / Mgmt
- −$287
- Net cashflow
- $-134
Break-even live
Sensitivity live
| Price | -10% $-32 | -5% $-83 | +0% $-134 | +5% $-185 | +10% $-236 |
|---|---|---|---|---|---|
| Rent | -10% $-242 | -5% $-188 | +0% $-134 | +5% $-80 | +10% $-26 |
| Rate | -1.0pp $-44 | -0.5pp $-88 | base $-134 | +0.5pp $-181 | +1.0pp $-228 |
UW: 25.0% down · 7.5% · 30yr · 1.5% tax · 5.0% vac · 8.0% maint · 8.0% mgmt
Financing live
Cash to close
- Down payment
- $44,875
- Closing costs
- $5,385
- Reserves months
- —
- Total cash needed
- —
Loan-product check · same deal, 3 products live
Conventional
25% down · 7.5% · 30yr
- Down + closing
- —
- Monthly P&I
- —
- Monthly cashflow
- —
- DSCR
- —
- Eligible?
- —
Personal DTI + credit; lowest rate.
DSCR
20% down · 8.5% · 30yr
- Down + closing
- —
- Monthly P&I
- —
- Monthly cashflow
- —
- DSCR
- —
- Eligible?
- —
No personal income docs; deal must DSCR.
Hard money
10% down · 12.0% · 12mo
- Down + closing
- —
- Monthly P&I
- —
- Monthly cashflow
- —
- DSCR
- —
- Eligible?
- —
Short-term bridge; refi at stabilization.
Listing history 14 events
-
2026-06-15statusdays on market $179,500 Pending 26 DOM
-
2026-06-13days on market $179,500 Active 25 DOM
-
2026-06-12days on market $179,500 Active 24 DOM
-
2026-06-09days on market $179,500 Active 21 DOM
-
2026-06-08days on market $179,500 Active 20 DOM
-
2026-06-08days on market $179,500 Active 19 DOM
-
2026-06-07days on market $179,500 Active 18 DOM
-
2026-06-04pricedays on market $179,500 Active 15 DOM
-
2026-06-02days on market $187,500 Active 14 DOM
-
2026-06-01days on market $187,500 Active 13 DOM
-
2026-05-31days on market $187,500 Active 12 DOM
-
2026-05-19$187,500 Active
-
2013-04-15soldstatus $143,100 252-char remark
Show marketing remark (252 chars)
Large 4 bedroom home with 3.5 baths, a living room with flagstone flooring, stained glass windows, fireplace & buit in shelving, hardwood floors and ceramic tile throughout. Large eat in kitchen with many of built in appliances and a huge pantry.
-
2012-09-12$155,000 252-char remark
Show marketing remark (252 chars)
Large 4 bedroom home with 3.5 baths, a living room with flagstone flooring, stained glass windows, fireplace & buit in shelving, hardwood floors and ceramic tile throughout. Large eat in kitchen with many of built in appliances and a huge pantry.
ⓘ Source: listings_history table (triggers on properties + properties_extension) + one-shot
backfill from property_details.listing_events for pre-trigger history.
Tax reassessment forecast PA · Partial reset (capped growth)
- Current annual tax
- $2,393 · $199/mo
- Projected year-2 tax
- $2,614 · $218/mo
- Expected delta
- +$222/yr (+$18/mo · 9.3%)
ⓘ Screening estimate from a state-policy table — verify with the county assessor before closing.
Climate risk First Street
- Flood 4/10 Moderate FEMA zone X (unshaded) · 24% chance over 30 yrs
- Wildfire 1/10 Low
- Heat 3/10 Moderate 8 d/yr ≥92°F today · 20 d/yr by 30 yrs out
- Wind 2/10 Low
- Air quality 3/10 Moderate 2 unhealthy d/yr today · 4 by 30 yrs out
Nearby sold comps map
Loading sold comps map…
Walkable amenities ~0.75 mi
Loading nearby amenities…
Taxation est. · year 1
- Rental income
- $16,426
- − Mortgage interest
- −$10,055
- − Property taxes
- −$2,393
- − Insurance
- −$898
- − Repairs & maintenance
- −$1,314
- − Management
- −$1,314
- − Depreciation
- −$5,222
- Taxable loss
- −$4,769
- Est. tax savings @ 24.0%
- +$1,144
- After-tax cash flow
- $-465/yr
For passive investors: Depreciation is non-cash, so a rental often shows a tax loss while cash-flowing — sheltering income. Rental losses are passive: they offset passive income freely, and up to $25,000/yr can offset ordinary (W-2) income if you actively participate and your MAGI is under $100k (phasing out to $0 by $150k); unused losses carry forward. On sale, claimed depreciation is recaptured at up to 25%, and gains may owe capital-gains tax (a 1031 exchange can defer both). Figures are a year-1 estimate at your 24.0% rate — not tax advice; consult a CPA.
Schools (NCES district)
- District
- Forest Hills SD
- NCES district ID
- 4209940
- Math proficiency
- 40% ▼ -8.00%
- Reading proficiency
- 47% ▼ -20.00%
- Median HH income
- $48,950
- Composite
- 37.27/100
- National rank
- #4452
- State rank
- #293 of 539 in PA
Livability — Summerhill
- Score
- 64/100
- State rank
- #1207
- US rank
- #14204
Category grades
Schools grade is shown separately in the Schools card above.
Census & demographics
- Census place
- Summerhill, PA
- Population (ZIP)
- 2,190
Population outlook (Cambria County) Hauer SSP2
- Today (2025)
- 122,754 people
- By 2030
- 115,827 · -5.6%
- By 2040
- 101,309 · -17.5%
- By 2050
- 88,379 · -28.0%
- By 2075
- 65,237 · -46.9%
- By 2100
- 46,909 · -61.8%
Race, ethnicity, and origin ACS 2023
- Neighborhood character
- Predominantly White (95%)
- Race & ethnicity
- White 95% Two or more races 4% Hispanic / Latino 1%
- Common ancestry
- Romanian 11% Slovak 2% Lithuanian 1%
- Foreign-born
- 0%
- Languages at home
- 99% English-only · Spanish 1%
Political lean MEDSL · Cambria
- 2024 margin
- Solid R (+39.7) · D 29.8% · R 69.5%
- 2008→2024 swing
- -40.4pp toward R · 2008: 0.7pp · 2024: -39.7pp
- All cycles
- 2024: R+39.7 2020: R+37.3 2016: R+37.8 2012: R+17.8 2008: D+0.7
Not yet ingested
- Civics
- —
Market trends
- HPI YoY
- ▲ 6.24%
- Current HPI
- 127.6264
- Rent YoY
- —
- Metro
- —
- State GDP YoY
- ▲ 1.68%
- F500 in state
- 34
Industry mix (Fortune 500 HQ in PA)
| Industry | F500 HQs | Revenue |
|---|---|---|
| Healthcare | 2 | $309B |
|
||
| Insurance | 2 | $27B |
|
||
| Telecommunications / Media | 1 | $124B |
|
||
| Industrial Distribution | 1 | $22B |
|
||
| Financial Services | 1 | $20B |
|
||
| Chemicals / Materials | 1 | $18B |
|
||
Price history
+21.0% since first listed3 events — show timeline
- 2026-05-19 Listed $187,500 CSMLS
- 2013-04-15 Sold (MLS) $143,100 CSMLS
- 2012-09-12 Listed $155,000 CSMLS
Property tax history
+1.4%/yrLatest (2026): $2,393 · +3.6% YoY. Source: county tax records.
Cash-flow waterfall
monthlySold comps — $/sqft
last 12 mo · ≤1 miLoading sold comps…