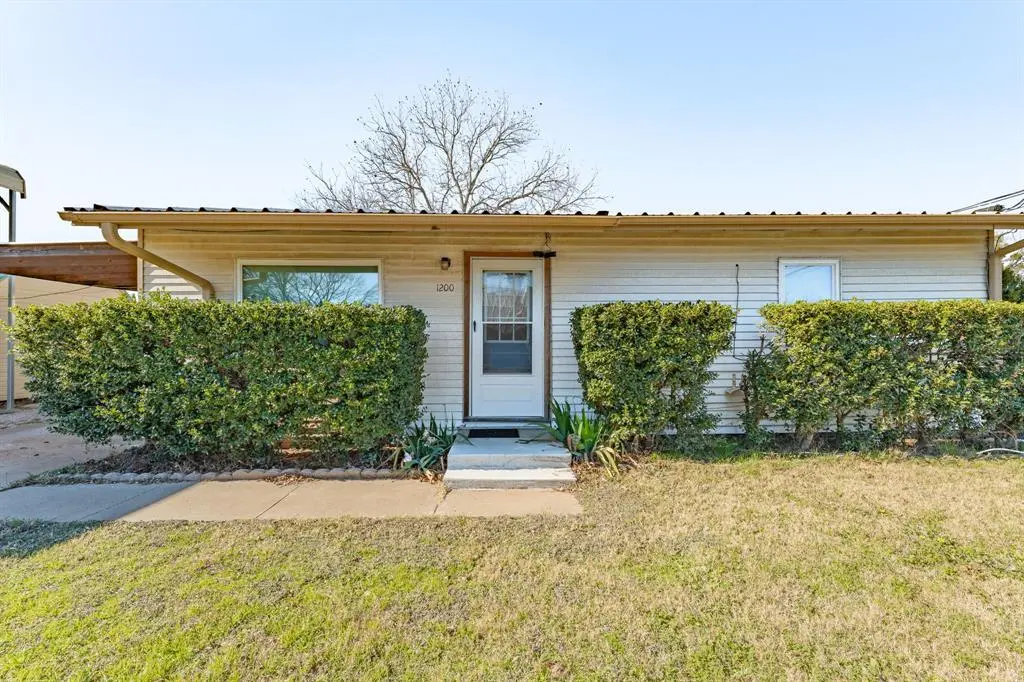
1200 SE 12th Ave · Mineral Wells, TX
Flood risk 1/10 · Minimal
- FEMA flood zone
- AE
- Chance of flooding over 30 yrs
- 0.0%
- Est. flood insurance / yr
- $1,737 – $8,500
Fire risk 8/10 · Major
- Est. fire insurance / yr
- $1,222 – $2,270
Heat risk 7/10 · Major
- Hot days now (above 109°F)
- 7 days/yr
- Hot days in 30 yrs
- 23 days/yr
Wind risk 4/10 · Minor
- Chance of severe wind over 30 yrs
- 18.0%
Air-quality risk 2/10 · Minimal
- Unhealthy air days now
- 1 days/yr
- Unhealthy air days in 30 yrs
- 1 days/yr
Risk factors via First Street. Map © Google.
Why this score? — see what drove the C- grade
The composite is a weighted blend of 9 inputs, each scored 0–100. Each bar is that input's sub-score; the figure is the points it added to the 100-point composite (weight × sub-score).
- Cash flow +21.4/30.0
- ARV discount +7.5/15.0
- DSCR +6.8/10.0
- 1% rule +6.6/10.0
- Livability +3.6/5.0
- Rent growth +2.5/5.0
- Schools +2.5/10.0
- Condition / age +2.5/5.0
- Appreciation +0.0/10.0
$100,000
🖨 Deal sheet (PDF) 📄 Offer letter ✓ Due diligence
Listing remarks MLS
Lots of potential in this charming move-in ready home in Mineral Wells. Close to town but still has that country feel! Perfect for a first time homebuyer or it would make a great investment property. There is a separate building in the back with a restroom that could easily be additional living space. Nice quiet neighborhood with a large backyard. Lots of storage, wood floors and central heat and air. Easy access to highways 180 and 281. Come see this one today!
Key facts
- Room to park boat
- Good size yard
- Room to park rv
Tags
Property features AI
Exterior
- Parking: Carport; Additional parking; RV carport and RV parking/access
- Utilities: Public water; Public sewer
- Home design: Single family residence; One level
- Construction: Vinyl siding; Pillar/post/pier foundation
- Exterior features: Chain link fencing; Corner lot; Storage structure on property
Interior
- Kitchen: Oven; Microwave
- Bathrooms: 1 full bathroom
- Heating & cooling: Central air; Ceiling fans; Natural gas heating
- Interior features: Oven; Microwave
Neighborhood map
What this means for you Summary
Snapshot
- This is a 2-bed/1.0-bath single-family listed at $100k.
Deal economics
- At list price, monthly cash flow is $-278 ($-3k/yr) — negative.
- To cash-flow at today's rent, offer at most $51k (49.2% below list).
- Meets the 1% rule at list price ($1k rent vs $100k).
- Recommended offer: $51k (49.2% below list) — sets the bar for cash-flow.
- Cap rate 8.1% vs local median 2.8% in Mineral Wells — top-decile yield for the area; either an underpriced asset or a hidden risk that comps aren't pricing in. Stress-test before assuming the spread holds.
Location & tenants
- Location reads 72/100 on livability (#278 in TX) — a middle-class / working-renter tenant base. Strengths: cost of living A+, housing A+, health & safety A+; Watch: crime D+, employment D, amenities F.
- Mineral Wells ISD (town): math 30% / reading 30% proficiency, ranked #636 of 826 in TX (top 77%) — families likely to look elsewhere, expect single-tenant / working-renter base with shorter leases.
- Zoned schools: Mineral Wells El (math 36% / reading 28%, grade F, #2,268 of 4,322 statewide, top 55%, 1,915 students, 79% FRL); Mineral Wells J H (math 26% / reading 31%, grade F, #1,122 of 1,662 statewide, top 69%, 498 students, 75% FRL); Mineral Wells H S (math 15% / reading 33%, grade F, #1,333 of 1,632 statewide, top 82%, 920 students, 74% FRL) — zoned schools average 76% FRL vs 58% district-wide (18 pts higher); higher-poverty schools than district average — tighter screening recommended.
- Market conditions: 279 active listings in the ZIP; 5 comparable units currently listed for rent nearby; rentals at typical pace (median 26d on market — plan ~3-4 weeks tenant-placement turnaround); 40% of comp listings sitting > 30 days — soft ceiling on asking rent; 27 units permitted in Palo Pinto County in 2024 (0 in 5+ unit buildings).
Forward outlook
- Local home prices are declining (-3.0%/yr); year-one equity from $691 of loan paydown is wiped out by about $3k of value loss. Plan a longer hold.
- Palo Pinto County population projected to shrink 8% by 2050 — rents likely to lag national; underwrite the cash flow, not the appreciation.
Negotiation context
- Only 3 days on market — expect competitive offers; lowballing is unlikely to land.
- 4 sale attempts since 9y ago with the ask held roughly flat each time — persistent listings suggest the price (not the market) is what's stuck; bring a comps-based counter.
Risks & watch-outs
- Watch-outs: flood insurance adds $427/mo.
- Climate carrying-cost: in FEMA flood zone AE (mandatory federal flood insurance); severe wildfire risk; extreme-heat days projected 7→23/yr by 2055 (HVAC capex compounding) — expect insurance premiums to compound above CPI over the hold.
Questions for the listing agent
- What do current leases actually rent for vs. the listed asking? Can we see a recent rent roll and the last 12 months of T-12 income?
- Built in 1961 — when were the roof, HVAC, electrical panel, plumbing, and water heater last replaced?
- What's the actual annual flood-insurance premium (NFIP or private), and is the property in a SFHA with mandatory coverage?
- Is there a deadline driving the sale (1031 exchange, divorce, estate, relocation)? That informs how much negotiation room exists.
- Schools are F-rated, which usually means shorter tenancies and higher turnover. Who's the typical renter profile here, and what's been the actual vacancy rate?
- Crime grade is D in this area — have there been break-ins, vandalism, or insurance claims at this property in the last 3 years? What carrier currently insures it and at what premium?
- What's the average days-on-market for RENTAL listings here right now (not sales)? A rising rental-DOM trend means longer vacancies and softer asking-rent achievability than the comps imply.
- What's the recent tenant-quality profile in this submarket — average credit score on applications, eviction rate, late-payment / NSF rate, and stable-employment percentage? A property-management company in the area should have these aggregated.
- How much new for-sale + rental construction is in the pipeline within 1–3 miles? Heavy new supply typically softens prices + rents 12–24 months out; constrained supply supports both.
Investment metrics
- 1% rule
- 1.16% ✓
- Cap rate
- 8.07%
- Cash-on-cash
- 6.35%
- DSCR
- 1.28
- GRM
- 7.2
CMA / ARV
- ARV (median comp)
- $222,369
- List price
- $100,000
- Delta
- -46.04%
- Verdict
- UNDERPRICED
- Comps
- 20 within 1.0 mi
Show comp detail 8 sales within ~0.75 mi
| Address | Dist | Beds/Ba | Sqft | Sold | Price | $/sf | Match |
|---|---|---|---|---|---|---|---|
| 611 SE 2nd Ave | 0.59mi | 2/1.0 | 820 (-5%) | 1mo | $110,000 | $134 | 63 |
| 712 SE 18th St | 0.40mi | 2/2.0 | 936 (+8%) | 1mo | $174,900 | $187 | 62 |
| 1405 SE 13th St | 0.15mi | 3/1.5 (+1) | 978 (+13%) | 7mo | $159,000 | $163 | 58 |
| 216 8th St | 0.70mi | 3/1.0 (+1) | 864 (0%) | 7mo | $109,000 | $126 | 56 |
| 603 SE 2nd St | 0.63mi | 2/1.0 | 888 (+3%) | 15mo | $93,500 | $105 | 54 |
| 2109 SE 18th St | 0.66mi | 2/1.0 | 918 (+6%) | 13mo | $99,500 | $108 | 48 |
| 2006 20th St | 0.70mi | 2/1.0 | 989 (+14%) | 4mo | $60,000 | $61 | 40 |
| 805 NE 1st St | 0.73mi | 3/1.0 (+1) | 975 (+13%) | 23mo | $185,000 | $190 | 20 |
Match score weights: distance 35% · size 25% · config 20% · recency 20%. Top-matched comps best support the ARV.
Projected returns pro-forma
-3.0% appreciation · 3.0% rent growth · sell at horizon
- IRR
- -37.6%
- Equity multiple
- -0.20×
- Total profit
- $-33,602
- Equity at exit
- $14,910
- IRR
- -51.1%
- Equity multiple
- -0.81×
- Total profit
- $-50,757
- Equity at exit
- $8,646
Cash invested: $28,000 (down + closing). Projections, not guarantees.
Landlord ↔ Tenant lean methodology
- Overall (STATE)
- 87 Strongly Landlord-Friendly
- State Texas
- 87 Strongly Landlord-Friendly · R+5
- County
- — inherits STATE
- City
- — inherits STATE
ZIP-level market 76067
- Active inventory
- 279
- Price-to-rent
- 7.2×
Monthly cashflow live
- Estimated rent
- $1,159 high interval (Pro) →
- Mortgage (P&I)
- −$524
- Tax from tax record
- −$201 /mo · $2,411/yr
- Insurance
- −$42
- Flood insurance flood zone
- −$427 /mo · $5,118/yr
- HOA
- −$0
- Vacancy / Maint / Mgmt
- −$243
- Net cashflow
- $-278
Break-even live
Sensitivity live
| Price | -10% $-222 | -5% $-250 | +0% $-278 | +5% $-307 | +10% $-335 |
|---|---|---|---|---|---|
| Rent | -10% $-370 | -5% $-324 | +0% $-278 | +5% $-233 | +10% $-187 |
| Rate | -1.0pp $-228 | -0.5pp $-253 | base $-278 | +0.5pp $-304 | +1.0pp $-331 |
UW: 25.0% down · 7.5% · 30yr · 1.5% tax · 5.0% vac · 8.0% maint · 8.0% mgmt
Financing live
Cash to close
- Down payment
- $25,000
- Closing costs
- $3,000
- Reserves months
- —
- Total cash needed
- —
Loan-product check · same deal, 3 products live
Conventional
25% down · 7.5% · 30yr
- Down + closing
- —
- Monthly P&I
- —
- Monthly cashflow
- —
- DSCR
- —
- Eligible?
- —
Personal DTI + credit; lowest rate.
DSCR
20% down · 8.5% · 30yr
- Down + closing
- —
- Monthly P&I
- —
- Monthly cashflow
- —
- DSCR
- —
- Eligible?
- —
No personal income docs; deal must DSCR.
Hard money
10% down · 12.0% · 12mo
- Down + closing
- —
- Monthly P&I
- —
- Monthly cashflow
- —
- DSCR
- —
- Eligible?
- —
Short-term bridge; refi at stabilization.
Rent comps 5 comps
| Address | Beds | Baths | Sqft | Rent | $/sqft | DOM | Units | Dist |
|---|---|---|---|---|---|---|---|---|
| 1101 SE 15th St Unit 1101 Mineral Wells, TX | 1.0 | 1.0 | 595 | $895 | $1.50 | 4d | 1 | 0.21mi |
| 1912 SE 15th St Mineral Wells, TX | 3.0 | 1.5 | 1043 | $1,700 | $1.63 | 26d | 1 | 0.49mi |
| 3001 NE 2nd St Mineral Wells, TX | 1.0–3.0 | 1.0–2.0 | 909 | $1,062 | $1.17 | 0d | 10 | 1.24mi |
| 707 NW 4th Ave #103 Mineral Wells, TX | 1.0 | 1.0 | 590 | $1,025 | $1.74 | 45d | 1 | 1.26mi |
| 707 NW 4th Ave Unit 202 Mineral Wells, TX | 1.0 | 1.5 | 878 | $1,150 | $1.31 | 45d | 1 | 1.26mi |
Listing history 19 events
-
2026-06-21days on market $100,000 Active 3 DOM
-
2026-06-18pricedays on market $100,000 Active 1 DOM
-
2026-05-31days on market $120,000 Active 141 DOM
-
2026-05-31days on market $120,000 Active 140 DOM
-
2026-05-19price $120,000 1445-char remark
-
2026-04-29price $130,000 1445-char remark
-
2026-04-12price $145,000 1445-char remark
-
2026-01-10$150,000 Active 1445-char remark
-
2017-06-23soldstatus
-
2017-06-13soldstatus Sold 467-char remark
Show marketing remark (467 chars)
Lots of potential in this charming move-in ready home in Mineral Wells. Close to town but still has that country feel! Perfect for a first time homebuyer or it would make a great investment property. There is a separate building in the back with a restroom that could easily be additional living space. Nice quiet neighborhood with a large backyard. Lots of storage, wood floors and central heat and air. Easy access to highways 180 and 281. Come see this one today!
-
2017-05-24historical Active Kick-Out 467-char remark
Show marketing remark (467 chars)
Lots of potential in this charming move-in ready home in Mineral Wells. Close to town but still has that country feel! Perfect for a first time homebuyer or it would make a great investment property. There is a separate building in the back with a restroom that could easily be additional living space. Nice quiet neighborhood with a large backyard. Lots of storage, wood floors and central heat and air. Easy access to highways 180 and 281. Come see this one today!
-
2017-04-14price $50,000 467-char remark
Show marketing remark (467 chars)
Lots of potential in this charming move-in ready home in Mineral Wells. Close to town but still has that country feel! Perfect for a first time homebuyer or it would make a great investment property. There is a separate building in the back with a restroom that could easily be additional living space. Nice quiet neighborhood with a large backyard. Lots of storage, wood floors and central heat and air. Easy access to highways 180 and 281. Come see this one today!
-
2017-03-24price $53,000 467-char remark
Show marketing remark (467 chars)
Lots of potential in this charming move-in ready home in Mineral Wells. Close to town but still has that country feel! Perfect for a first time homebuyer or it would make a great investment property. There is a separate building in the back with a restroom that could easily be additional living space. Nice quiet neighborhood with a large backyard. Lots of storage, wood floors and central heat and air. Easy access to highways 180 and 281. Come see this one today!
-
2017-03-08$58,000 Active 467-char remark
Show marketing remark (467 chars)
Lots of potential in this charming move-in ready home in Mineral Wells. Close to town but still has that country feel! Perfect for a first time homebuyer or it would make a great investment property. There is a separate building in the back with a restroom that could easily be additional living space. Nice quiet neighborhood with a large backyard. Lots of storage, wood floors and central heat and air. Easy access to highways 180 and 281. Come see this one today!
-
2017-03-06historical
-
2017-02-16$65,000 Active
-
2016-12-20soldstatus
-
1990-03-30soldstatus
-
1987-05-05soldstatus
ⓘ Source: listings_history table (triggers on properties + properties_extension) + one-shot
backfill from property_details.listing_events for pre-trigger history.
Tax reassessment forecast TX · Resets to sale price
- Current annual tax
- $2,411 · $201/mo
- Projected year-2 tax
- $2,411 · $201/mo
- Expected delta
- $0/yr ($0/mo · 0.0%)
ⓘ Screening estimate from a state-policy table — verify with the county assessor before closing.
Climate risk First Street
- Flood 1/10 Low FEMA zone AE · 0% chance over 30 yrs
- Wildfire 8/10 Severe
- Heat 7/10 Severe 7 d/yr ≥109°F today · 23 d/yr by 30 yrs out
- Wind 4/10 Moderate 18% chance of damaging wind over 30 yrs
- Air quality 2/10 Low 1 unhealthy d/yr today · 1 by 30 yrs out
Nearby sold comps map
Loading sold comps map…
Walkable amenities ~0.75 mi
Loading nearby amenities…
Taxation est. · year 1
- Rental income
- $13,903
- − Mortgage interest
- −$5,602
- − Property taxes
- −$2,411
- − Insurance
- −$5,618
- − Repairs & maintenance
- −$1,112
- − Management
- −$1,112
- − Depreciation
- −$2,909
- Taxable loss
- −$4,862
- Est. tax savings @ 24.0%
- +$1,167
- After-tax cash flow
- $-2,173/yr
For passive investors: Depreciation is non-cash, so a rental often shows a tax loss while cash-flowing — sheltering income. Rental losses are passive: they offset passive income freely, and up to $25,000/yr can offset ordinary (W-2) income if you actively participate and your MAGI is under $100k (phasing out to $0 by $150k); unused losses carry forward. On sale, claimed depreciation is recaptured at up to 25%, and gains may owe capital-gains tax (a 1031 exchange can defer both). Figures are a year-1 estimate at your 24.0% rate — not tax advice; consult a CPA.
Schools (NCES district)
- District
- Mineral Wells ISD
- NCES district ID
- 4830950
- Math proficiency
- 30% ▼ -10.00%
- Reading proficiency
- 30% ▼ -5.00%
- Median HH income
- $40,027
- Composite
- 25.26/100
- National rank
- #7500
- State rank
- #636 of 826 in TX
Livability — Mineral Wells
- Score
- 72/100
- State rank
- #278
- US rank
- #6474
Category grades
Schools grade is shown separately in the Schools card above.
Census & demographics
- Census place
- Mineral Wells, TX
- County
- Palo Pinto County · 21,080 people
- City population
- 21,080
- Metro
- Mineral Wells, TX
- Population (ZIP)
- 21,080
- Household income
- $62,190
- Rent vs Own
- Severe rent burden
- 745.0
Population outlook (Palo Pinto County) Hauer SSP2
- Today (2025)
- 27,500 people
- By 2030
- 27,079 · -1.5%
- By 2040
- 26,135 · -5.0%
- By 2050
- 25,215 · -8.3%
- By 2075
- 23,416 · -14.9%
- By 2100
- 20,300 · -26.2%
Race, ethnicity, and origin ACS 2023
- Neighborhood character
- Predominantly White (70%)
- Race & ethnicity
- White 70% Hispanic / Latino 22% Two or more races 9% Black 4% Asian 1%
- Hispanic origin (detail)
- Mexican 19%
- Common ancestry
- Lithuanian 4% Italian 1% Slovak 1%
- Foreign-born
- 6% · Canada
- Languages at home
- 86% English-only · Spanish 13% Other Indo-European 1%
Political lean MEDSL · Palo Pinto
- 2024 margin
- Solid R (+67.1) · D 16.1% · R 83.2%
- 2008→2024 swing
- -18.9pp toward R · 2008: -48.2pp · 2024: -67.1pp
- All cycles
- 2024: R+67.1 2020: R+64.1 2016: R+64.1 2012: R+59.8 2008: R+48.2
Not yet ingested
- Civics
- —
Market trends
- HPI YoY
- ▼ -134.09%
- Current HPI
- 240.3647
- Rent YoY
- —
- Metro
- Mineral Wells, TX
- State GDP YoY
- ▲ 3.95%
- F500 in state
- 110
Industry mix (Fortune 500 HQ in TX)
| Industry | F500 HQs | Revenue |
|---|---|---|
| Energy | 16 | $1,198B |
|
||
| Technology | 5 | $198B |
|
||
| Engineering / Construction | 4 | $72B |
|
||
| Energy Services | 3 | $60B |
|
||
| Utilities | 3 | $41B |
|
||
| Healthcare | 2 | $330B |
|
||
Price history
+53.8% since first listed17 events — show timeline
- 2026-06-16 Listed $100,000 AARMLS
- 2026-05-31 Listing Removed — NTREIS
- 2026-05-19 Price Changed $120,000 NTREIS
- 2026-04-29 Price Changed $130,000 NTREIS
- 2026-04-12 Price Changed $145,000 NTREIS
- 2026-01-10 Listed $150,000 NTREIS
- 2017-06-23 Sold (Public Records) — Public Records
- 2017-06-13 Sold (MLS) — NTREIS
- 2017-05-24 Contingent — NTREIS
- 2017-04-14 Price Changed $50,000 NTREIS
- 2017-03-24 Price Changed $53,000 NTREIS
- 2017-03-08 Listed $58,000 NTREIS
- 2017-03-06 Listing Removed — NTREIS
- 2017-02-16 Listed $65,000 NTREIS
- 2016-12-20 Sold (Public Records) — Public Records
- 1990-03-30 Sold (Public Records) — Public Records
- 1987-05-05 Sold (Public Records) — Public Records
Property tax history
+10.4%/yrLatest (2025): $2,411 · +10.4% YoY. Source: county tax records.
Cash-flow waterfall
monthlySold comps — $/sqft
last 12 mo · ≤1 miLoading sold comps…