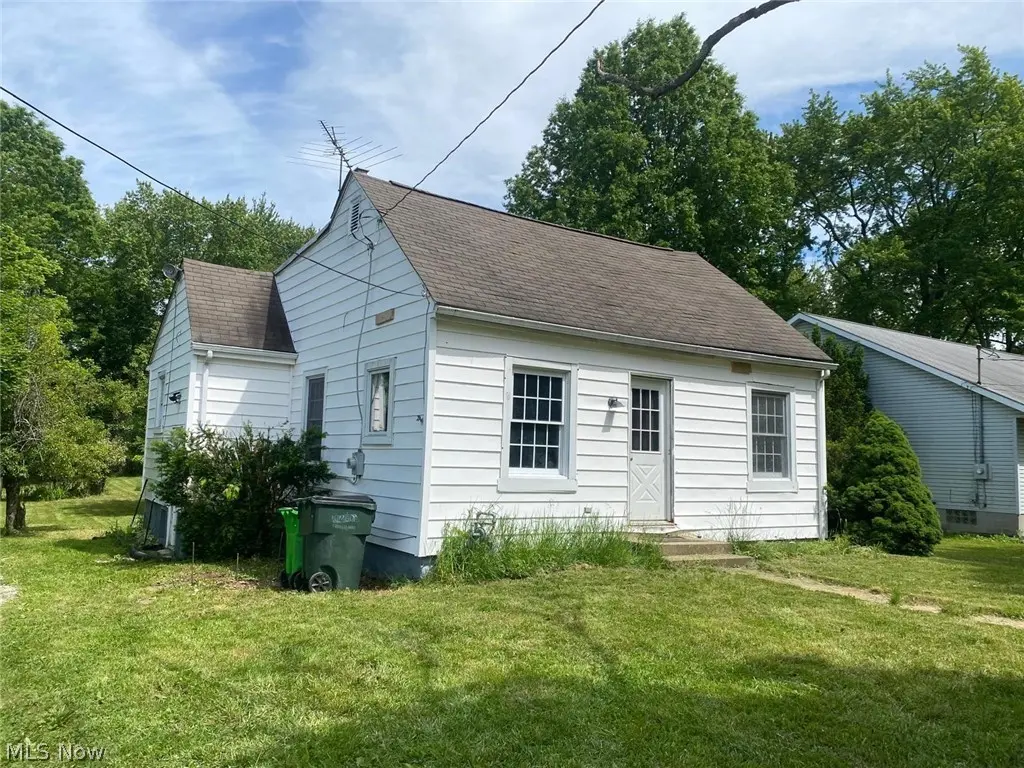
4111 Pardee Rd · Stow, OH
Flood risk 1/10 · Minimal
- FEMA flood zone
- X (unshaded)
- Chance of flooding over 30 yrs
- 0.0%
- Est. flood insurance / yr
- $473 – $860
Fire risk 1/10 · Minimal
- Est. fire insurance / yr
- $713 – $1,323
Heat risk 3/10 · Minor
- Hot days now (above 96°F)
- 7 days/yr
- Hot days in 30 yrs
- 17 days/yr
Wind risk 1/10 · Minimal
- Chance of severe wind over 30 yrs
- —
Air-quality risk 3/10 · Minor
- Unhealthy air days now
- 2 days/yr
- Unhealthy air days in 30 yrs
- 4 days/yr
Risk factors via First Street. Map © Google.
Why this score? — see what drove the B grade
The composite is a weighted blend of 9 inputs, each scored 0–100. Each bar is that input's sub-score; the figure is the points it added to the 100-point composite (weight × sub-score).
- Cash flow +30.0/30.0
- 1% rule +10.0/10.0
- DSCR +10.0/10.0
- ARV discount +7.5/15.0
- Schools +5.3/10.0
- Rent growth +4.6/5.0
- Livability +3.8/5.0
- Condition / age +2.5/5.0
- Appreciation +0.0/10.0
$40,000
🖨 Deal sheet 📄 Offer letter ✓ Due diligence
Listing remarks MLS
This great bungalow sits on a gorgeous lot in Stow, OH. With almost a half an acre, a deck and a shed, find plenty of room for storage! The interior features a dining room and a great layout. Come out and see it today!
Key facts
- Deck overlooks yard
- Full basement
- Storage shed
Tags
Property features AI
Exterior
- Parking: Driveway (gravel, unpaved) with no garage
- Utilities: Public water; Public sewer
- Home design: Single-story home; Faces west; Fixer condition; Property attached
- Construction: Aluminum and vinyl siding; Asphalt roof; Block foundation; Built (year per public records)
- Exterior features: Deck; Back yard; Shed(s)
Interior
- Kitchen: Kitchen on the main level
- Bedrooms: Two main-level bedrooms
- Flooring: Laminate flooring in kitchen, bathroom and both bedrooms; Carpet in the living room
- Bathrooms: One full bathroom on the main level
- Heating & cooling: Forced-air gas heating; Central air conditioning
- Interior features: Full basement
- Laundry & utility: Laundry in the basement
Neighborhood map
What this means for you Summary
Snapshot
- This is a 3-bed/1.0-bath single-family listed at $40k.
Deal economics
- At list price, monthly cash flow is $904 ($11k/yr) — positive.
- The deal already cash-flows at list — no discount required.
- Meets the 1% rule at list price ($1k rent vs $40k).
- Cap rate 33.4% vs local median 3.5% in Stow — top-decile yield for the area; either an underpriced asset or a hidden risk that comps aren't pricing in. Stress-test before assuming the spread holds.
Location & tenants
- Location reads 76/100 on livability (#217 in OH, #3,390 nationally) — a middle-class / working-renter tenant base. Strengths: schools A+, cost of living A+, housing A+; Watch: amenities F, commute F.
- Stow-Munroe Falls City School District (suburban): math 58% / reading 64% proficiency, ranked #247 of 656 in OH (top 38%) — acceptable for families but not a draw, mixed tenant base, ~2y average lease; only 18% free/reduced lunch — higher-income household profile.
- Market conditions: Rents rising fast (+8.6%/yr); 113 active listings in the ZIP; 14 comparable units currently listed for rent nearby; rentals at typical pace (median 23d on market — plan ~3-4 weeks tenant-placement turnaround); solid renter incomes; 1,114 units permitted in Summit County in 2024 (397 in 5+ unit buildings).
Forward outlook
- Local home prices are declining (-3.0%/yr); year-one equity from $277 of loan paydown is wiped out by about $1k of value loss. Plan a longer hold.
- Summit County population projected to shrink 6% by 2050 — rents likely to lag national; underwrite the cash flow, not the appreciation.
- At projected returns (-3.0% appreciation + 8.0% rent growth), your $11k cash investment doubles in ~2 years — after that, you're playing with house money.
Negotiation context
- Only 1 days on market — expect competitive offers; lowballing is unlikely to land.
- 7 sale attempts since 32y ago with the ask held roughly flat each time — persistent listings suggest the price (not the market) is what's stuck; bring a comps-based counter.
- Current owner paid $31k; 27% above their basis — modest negotiation headroom, anchor on the comps not their cost.
Risks & watch-outs
- Watch-outs: built in 1946 — expect roof / HVAC / electrical / plumbing capex.
Questions for the listing agent
- Built in 1946 — when were the roof, HVAC, electrical panel, plumbing, and water heater last replaced?
- Is there a deadline driving the sale (1031 exchange, divorce, estate, relocation)? That informs how much negotiation room exists.
- Schools are A-rated — typically a magnet for longer-tenancy family renters. What's the average tenant stay here, and is there a school-zone premium baked into asking?
- What's the average days-on-market for RENTAL listings here right now (not sales)? A rising rental-DOM trend means longer vacancies and softer asking-rent achievability than the comps imply.
- What's the recent tenant-quality profile in this submarket — average credit score on applications, eviction rate, late-payment / NSF rate, and stable-employment percentage? A property-management company in the area should have these aggregated.
- How much new for-sale + rental construction is in the pipeline within 1–3 miles? Heavy new supply typically softens prices + rents 12–24 months out; constrained supply supports both.
Investment metrics
- 1% rule
- 3.73% ✓
- Cap rate
- 33.40%
- Cash-on-cash
- 96.81%
- DSCR
- 5.31
- GRM
- 2.2
CMA / ARV
- ARV (on-the-fly)
- $166,552
- Comps found
- 9
Show comp detail 9 sales within ~0.75 mi
| Address | Dist | Beds/Ba | Sqft | Sold | Price | $/sf | Match |
|---|---|---|---|---|---|---|---|
| 4058 Pardee Rd | 0.10mi | 3/1.0 | 974 (+12%) | 13mo | $120,000 | $123 | 65 |
| 2535 Sears Rd | 0.37mi | 3/1.0 | 975 (+12%) | 2mo | $186,250 | $191 | 61 |
| 4566 Fishcreek Rd | 0.49mi | 2/1.0 (-1) | 832 (-5%) | 15mo | $101,500 | $122 | 52 |
| 3972 Genevieve Blvd | 0.43mi | 3/1.5 | 960 (+10%) | 12mo | $190,000 | $198 | 51 |
| 3801 Baird Rd | 0.65mi | 3/1.0 | 960 (+10%) | 5mo | $167,000 | $174 | 49 |
| 4034 Pardee Rd | 0.15mi | 2/2.0 (-1) | 780 (-11%) | 24mo | $75,000 | $96 | 47 |
| 3966 Genevieve Blvd | 0.44mi | 3/2.0 | 960 (+10%) | 15mo | $197,000 | $205 | 46 |
| 3748 Iona Ave | 0.68mi | 2/1.0 (-1) | 840 (-4%) | 15mo | $178,250 | $212 | 44 |
| 2673 Progress Park Dr | 0.74mi | 2/1.0 (-1) | 924 (+6%) | 15mo | $179,673 | $194 | 38 |
Match score weights: distance 35% · size 25% · config 20% · recency 20%. Top-matched comps best support the ARV.
Projected returns pro-forma
-3.0% appreciation · 8.0% rent growth · sell at horizon
- IRR
- —
- Equity multiple
- 6.27×
- Total profit
- $58,982
- Equity at exit
- $5,964
- IRR
- —
- Equity multiple
- 15.42×
- Total profit
- $161,480
- Equity at exit
- $3,458
Cash invested: $11,200 (down + closing). Projections, not guarantees.
Landlord ↔ Tenant lean methodology
- Overall (STATE)
- 73 Landlord-Friendly
- State Ohio
- 73 Landlord-Friendly · R+6
- County
- — inherits STATE
- City
- — inherits STATE
ZIP-level market 44224
- Rents YoY
- 8.6%
- Active inventory
- 113
- Price-to-rent
- 2.2×
Monthly cashflow live
- Estimated rent
- $1,494 high interval (Pro) →
- Mortgage (P&I)
- −$210
- Tax est. 1.5%
- −$50 /mo · $600/yr
- Insurance
- −$17
- HOA
- −$0
- Vacancy / Maint / Mgmt
- −$314
- Net cashflow
- $904
Break-even live
UW: 25.0% down · 7.5% · 30yr · 1.5% tax · 5.0% vac · 8.0% maint · 8.0% mgmt
Financing live
Cash to close
- Down payment
- $10,000
- Closing costs
- $1,200
- Reserves months
- —
- Total cash needed
- —
Loan-product check · same deal, 3 products live
Conventional
25% down · 7.5% · 30yr
- Down + closing
- —
- Monthly P&I
- —
- Monthly cashflow
- —
- DSCR
- —
- Eligible?
- —
Personal DTI + credit; lowest rate.
DSCR
20% down · 8.5% · 30yr
- Down + closing
- —
- Monthly P&I
- —
- Monthly cashflow
- —
- DSCR
- —
- Eligible?
- —
No personal income docs; deal must DSCR.
Hard money
10% down · 12.0% · 12mo
- Down + closing
- —
- Monthly P&I
- —
- Monthly cashflow
- —
- DSCR
- —
- Eligible?
- —
Short-term bridge; refi at stabilization.
Rent comps 14 comps
| Address | Beds | Baths | Sqft | Rent | $/sqft | DOM | Units | Dist |
|---|---|---|---|---|---|---|---|---|
| 4020 Vira Rd Stow, OH | 2.0 | 1.0 | 896 | $1,250 | $1.40 | 23d | 1 | 0.22mi |
| 4261 Osage St Stow, OH | 3.0 | 2.0 | 1072 | $1,850 | $1.73 | 14d | 1 | 0.37mi |
| 2198 Liberty Rd Stow, OH | 1.0–2.0 | 1.0 | 850 | $1,063 | $1.25 | 21d | 2 | 0.49mi |
| 4392 Millburn Ave Stow, OH | 1.0–2.0 | 1.0–2.0 | 720 | $1,325 | $1.84 | 13d | 3 | 0.50mi |
| 2424 Echo Valley Dr Unit 2424 Stow, OH | 2.0 | 2.0 | 1000 | $1,250 | $1.25 | 23d | 1 | 0.71mi |
| 2444 Echo Valley Dr Unit 2444 Stow, OH | 2.0 | 2.0 | 1000 | $1,250 | $1.25 | 23d | 1 | 0.74mi |
| 2450 Echo Valley Dr Unit 2450 Stow, OH | 2.0 | 2.0 | 1000 | $1,250 | $1.25 | 21d | 1 | 0.74mi |
| 2443 Echo Valley Dr Unit 2424 Stow, OH | 2.0 | 2.0 | 1000 | $1,250 | $1.25 | 23d | 1 | 0.75mi |
| 2443 Echo Valley Dr Unit 2443 Stow, OH | 2.0 | 2.0 | 1000 | $1,250 | $1.25 | 43d | 1 | 0.75mi |
| 2443 Echo Valley Dr Unit 2450 Stow, OH | 2.0 | 2.0 | 1000 | $1,250 | $1.25 | 21d | 1 | 0.75mi |
| 3591 Hiwood Ave Stow, OH | 3.0 | 1.0 | 912 | $1,595 | $1.75 | 43d | 1 | 0.92mi |
| 1987 King Dr Stow, OH | 2.0 | 1.0 | 1048 | $1,350 | $1.29 | 23d | 1 | 0.99mi |
| 3674 Kent Rd Stow, OH | 1.0–2.0 | 1.0–1.5 | 815 | $1,349 | $1.66 | 13d | 7 | 1.03mi |
| 3538 Orchard Dr Stow, OH | 2.0 | 1.0 | 884 | $1,395 | $1.58 | 43d | 1 | 1.07mi |
Listing history 3 events
-
2026-06-14status $40,000 Pending 1 DOM
-
2026-06-09remarks 699-char remark
-
2026-06-09$40,000 Active 1 DOM
ⓘ Source: listings_history table (triggers on properties + properties_extension) + one-shot
backfill from property_details.listing_events for pre-trigger history.
Climate risk First Street
- Flood 1/10 Low FEMA zone X (unshaded) · 0% chance over 30 yrs
- Wildfire 1/10 Low
- Heat 3/10 Moderate 7 d/yr ≥96°F today · 17 d/yr by 30 yrs out
- Wind 1/10 Low
- Air quality 3/10 Moderate 2 unhealthy d/yr today · 4 by 30 yrs out
Nearby sold comps map
Loading sold comps map…
Walkable amenities ~0.75 mi
Loading nearby amenities…
Taxation est. · year 1
- Rental income
- $17,924
- − Mortgage interest
- −$2,241
- − Property taxes
- −$600
- − Insurance
- −$200
- − Repairs & maintenance
- −$1,434
- − Management
- −$1,434
- − Depreciation
- −$1,164
- Taxable income
- $10,852
- Est. tax owed @ 24.0%
- −$2,604
- After-tax cash flow
- $8,238/yr
For passive investors: Depreciation is non-cash, so a rental often shows a tax loss while cash-flowing — sheltering income. Rental losses are passive: they offset passive income freely, and up to $25,000/yr can offset ordinary (W-2) income if you actively participate and your MAGI is under $100k (phasing out to $0 by $150k); unused losses carry forward. On sale, claimed depreciation is recaptured at up to 25%, and gains may owe capital-gains tax (a 1031 exchange can defer both). Figures are a year-1 estimate at your 24.0% rate — not tax advice; consult a CPA.
Schools (NCES district)
- District
- Stow-Munroe Falls City School District
- NCES district ID
- 3904483
- Math proficiency
- 58% ▼ -11.00%
- Reading proficiency
- 64% ▼ -6.00%
- Median HH income
- $64,663
- Composite
- 53.29/100
- National rank
- #1488
- State rank
- #247 of 656 in OH
Livability — Stow
- Score
- 76/100
- State rank
- #217
- US rank
- #3390
Category grades
Schools grade is shown separately in the Schools card above.
Census & demographics
- Census place
- Stow, OH
- County
- Summit County · 440,783 people
- City population
- 39,200
- Metro
- Akron, OH
- Population (ZIP)
- 39,200
- Household income
- $94,287
- Rent vs Own
- Severe rent burden
- 1165.0
Population outlook (Summit County) Hauer SSP2
- Today (2025)
- 546,583 people
- By 2030
- 544,028 · -0.5%
- By 2040
- 531,363 · -2.8%
- By 2050
- 514,923 · -5.8%
- By 2075
- 481,765 · -11.9%
- By 2100
- 432,265 · -20.9%
Race, ethnicity, and origin ACS 2023
- Neighborhood character
- Predominantly White (85%)
- Race & ethnicity
- White 85% Two or more races 6% Black 5% Asian 3% Hispanic / Latino 2%
- Common ancestry
- Romanian 6% Slovak 3% Italian 3%
- Foreign-born
- 7% · Canada, China
- Languages at home
- 93% English-only · Arabic 2% Spanish 1% Other Asian/Pacific 1%
Political lean MEDSL · Summit
- 2024 margin
- Lean D (+7.0) · D 53.0% · R 46.0%
- 2008→2024 swing
- -9.6pp toward R · 2008: 16.6pp · 2024: 7.0pp
- All cycles
- 2024: D+7.0 2020: D+9.6 2016: D+8.2 2012: D+14.8 2008: D+16.6
Not yet ingested
- Civics
- —
Market trends
- HPI YoY
- ▼ -218.72%
- Current HPI
- 208.3063
- Rent YoY
- ▲ 8.56%
- Metro
- Akron, OH
- State GDP YoY
- ▲ 1.98%
- F500 in state
- 48
Industry mix (Fortune 500 HQ in OH)
| Industry | F500 HQs | Revenue |
|---|---|---|
| Insurance | 3 | $145B |
|
||
| Industrial Machinery | 3 | $49B |
|
||
| Financial Services | 3 | $24B |
|
||
| Consumer Goods | 2 | $93B |
|
||
| Aerospace / Defense | 2 | $47B |
|
||
| Utilities | 2 | $33B |
|
||
Price history
-42.9% since first listed14 events — show timeline
- 2026-06-08 Listed $40,000 MLSNOW
- 2014-09-26 Sold (MLS) $31,400 MLSNOW
- 2014-09-15 Listing Removed — MLSNOW
- 2014-08-18 Listed $31,400 MLSNOW
- 2011-07-24 Listing Removed — MLSNOW
- 2011-01-24 Listed $89,900 MLSNOW
- 2010-01-10 Listing Removed — MLSNOW
- 2009-07-10 Listed $95,000 MLSNOW
- 2005-01-31 Listing Removed — MLSNOW
- 2004-10-31 Listed $110,000 MLSNOW
- 1999-07-23 Sold (Public Records) $89,900 Public Records
- 1999-06-15 Listed $89,900 MLSNOW
- 1994-11-30 Sold (Public Records) $70,000 Public Records
- 1994-10-05 Listed $70,000 MLSNOW
Property tax history
+2.3%/yrLatest (2025): $2,652 · -16.3% YoY. Source: county tax records.
Cash-flow waterfall
monthlySold comps — $/sqft
last 12 mo · ≤1 miLoading sold comps…