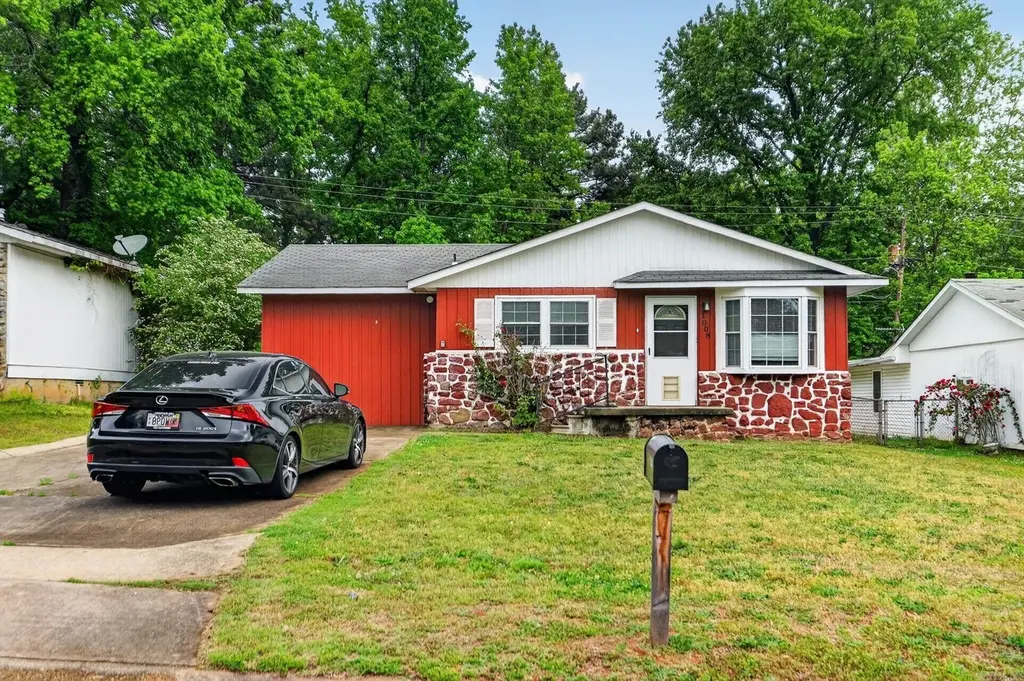
1008 Ferrell Dr · Jacksonville, AR
Flood risk 1/10 · Minimal
- FEMA flood zone
- X (unshaded)
- Chance of flooding over 30 yrs
- 0.0%
- Est. flood insurance / yr
- $507 – $1,088
Fire risk 4/10 · Minor
- Est. fire insurance / yr
- $1,499 – $2,785
Heat risk 6/10 · Moderate
- Hot days now (above 110°F)
- 7 days/yr
- Hot days in 30 yrs
- 18 days/yr
Wind risk 4/10 · Minor
- Chance of severe wind over 30 yrs
- 9.0%
Air-quality risk 2/10 · Minimal
- Unhealthy air days now
- 1 days/yr
- Unhealthy air days in 30 yrs
- 2 days/yr
Risk factors via First Street. Map © Google.
Why this score? — see what drove the C+ grade
The composite is a weighted blend of 9 inputs, each scored 0–100. Each bar is that input's sub-score; the figure is the points it added to the 100-point composite (weight × sub-score).
- Cash flow +27.2/30.0
- DSCR +9.5/10.0
- ARV discount +7.5/15.0
- 1% rule +6.9/10.0
- Rent growth +3.3/5.0
- Livability +3.1/5.0
- Condition / age +2.5/5.0
- Schools +1.7/10.0
- Appreciation +0.0/10.0
$109,900
🖨 Deal sheet 📄 Offer letter ✓ Due diligence
Listing remarks MLS
Well maintained 3 BD 1.5 BA home in Jacksonville. Laminate wood floors in LR and Kitchen. Storm shelter in the enclosed carport. Fully fenced backyard.
Key facts
- Spacious interiors
- Natural light
- Comfortable layout
Tags
Property features AI
Exterior
- Parking: Parking pads
- Utilities: Public water; Public sewer
- Home design: Single-family property; Rock and frame exterior
- Construction: Composition roof; Crawl space foundation
- Exterior features: Paved road access; Level lot
Interior
- Kitchen: Electric range; Dishwasher; Refrigerator stays
- Flooring: Carpet; Laminate
- Bathrooms: 1 full bathroom; 1 half bathroom
- Heating & cooling: Central gas heat; Central gas cooling
- Interior features: Bonus room; Carpet and laminate flooring
Neighborhood map
What this means for you Summary
Snapshot
- This is a 3-bed/1.5-bath single-family listed at $110k.
Deal economics
- At list price, monthly cash flow is $315 ($4k/yr) — positive.
- The deal already cash-flows at list — no discount required.
- Meets the 1% rule at list price ($1k rent vs $110k).
- Recommended offer: $107k (3.0% below list) — sets the bar for market timing.
- Cap rate 9.7% vs local median 5.0% in Jacksonville — top-decile yield for the area; either an underpriced asset or a hidden risk that comps aren't pricing in. Stress-test before assuming the spread holds.
Location & tenants
- Location reads 61/100 on livability (#231 in AR) — a middle-class / working-renter tenant base. Strengths: cost of living A+, housing A+, health & safety A+; Watch: crime F, amenities F, commute F.
- Jacksonville North Pulaski School District (suburban): math 18% / reading 20% proficiency, ranked #211 of 238 in AR (top 89%) — low school quality limits family demand, transient renter base, plan for 1-2y turnover; 66% free/reduced lunch — lower-income household profile, screen leases tightly.
- Zoned schools: Jacksonville Elementary School (792 students, 100% FRL); Jacksonville High School (math 10% / reading 18%, grade F, #268 of 292 statewide, top 92%, 1,168 students, 100% FRL) — zoned schools average 100% FRL vs 66% district-wide (34 pts higher); higher-poverty schools than district average — tighter screening recommended.
- Market conditions: Rents rising (+3.1%/yr); 154 active listings in the ZIP; 19 comparable units currently listed for rent nearby; rentals at typical pace (median 23d on market — plan ~3-4 weeks tenant-placement turnaround); 1,006 units permitted in Pulaski County in 2024 (0 in 5+ unit buildings).
Forward outlook
- Local home prices are declining (-3.0%/yr); year-one equity from $760 of loan paydown is wiped out by about $3k of value loss. Plan a longer hold.
- Pulaski County population projected at +6% by 2050 — modest demand growth; plan on rents tracking national, not racing it.
- At projected returns (-3.0% appreciation + 3.1% rent growth), your $31k cash investment doubles in ~10 years — after that, you're playing with house money.
Negotiation context
- It's been on market 55 days — a 3% lower offer ($107k) is reasonable based on typical stale-listing flexibility.
- 2 sale attempts since 4y ago with the ask held roughly flat each time — persistent listings suggest the price (not the market) is what's stuck; bring a comps-based counter.
- Current owner paid $91k; 21% above their basis — modest negotiation headroom, anchor on the comps not their cost.
Risks & watch-outs
- Climate carrying-cost: extreme-heat days projected 7→18/yr by 2055 (HVAC capex compounding) — expect insurance premiums to compound above CPI over the hold.
Questions for the listing agent
- It's been on market 55 days. Have you received any prior offers? Is the seller open to a 3% concession, seller financing, or rate buy-down credit?
- Built in 1973 — when were the roof, HVAC, electrical panel, plumbing, and water heater last replaced?
- Is there a deadline driving the sale (1031 exchange, divorce, estate, relocation)? That informs how much negotiation room exists.
- Schools are F-rated, which usually means shorter tenancies and higher turnover. Who's the typical renter profile here, and what's been the actual vacancy rate?
- Crime grade is F in this area — have there been break-ins, vandalism, or insurance claims at this property in the last 3 years? What carrier currently insures it and at what premium?
- What's the average days-on-market for RENTAL listings here right now (not sales)? A rising rental-DOM trend means longer vacancies and softer asking-rent achievability than the comps imply.
- What's the recent tenant-quality profile in this submarket — average credit score on applications, eviction rate, late-payment / NSF rate, and stable-employment percentage? A property-management company in the area should have these aggregated.
- How much new for-sale + rental construction is in the pipeline within 1–3 miles? Heavy new supply typically softens prices + rents 12–24 months out; constrained supply supports both.
Investment metrics
- 1% rule
- 1.19% ✓
- Cap rate
- 9.73%
- Cash-on-cash
- 12.29%
- DSCR
- 1.55
- GRM
- 7.0
CMA / ARV
- ARV (median comp)
- $69,380
- List price
- $109,900
- Delta
- 58.40%
- Verdict
- OVERPRICED
- Comps
- 6 within 2.0 mi
Show comp detail 2 sales within ~0.75 mi
| Address | Dist | Beds/Ba | Sqft | Sold | Price | $/sf | Match |
|---|---|---|---|---|---|---|---|
| 1004 Richard | 0.06mi | 3/2.0 | 1,400 (+10%) | 6mo | $175,000 | $125 | 74 |
| 1030 Grayland Dr | 0.18mi | 3/2.0 | 1,197 (-6%) | 10mo | $174,000 | $145 | 72 |
Match score weights: distance 35% · size 25% · config 20% · recency 20%. Top-matched comps best support the ARV.
Projected returns pro-forma
-3.0% appreciation · 3.07% rent growth · sell at horizon
- IRR
- 2.0%
- Equity multiple
- 1.08×
- Total profit
- $2,353
- Equity at exit
- $16,386
- IRR
- 11.6%
- Equity multiple
- 1.92×
- Total profit
- $28,256
- Equity at exit
- $9,502
Cash invested: $30,772 (down + closing). Projections, not guarantees.
Landlord ↔ Tenant lean methodology
- Overall (STATE)
- 92 Strongly Landlord-Friendly
- State Arkansas
- 92 Strongly Landlord-Friendly · R+14
- County
- — inherits STATE
- City
- — inherits STATE
ZIP-level market 72076
- Home prices YoY
- -30.3%
- Rents YoY
- 3.1%
- Active inventory
- 154
- Price-to-rent
- 7.0×
Monthly cashflow live
- Estimated rent
- $1,308 high interval (Pro) →
- Mortgage (P&I)
- −$576
- Tax from tax record
- −$96 /mo · $1,155/yr
- Insurance
- −$46
- HOA
- −$0
- Vacancy / Maint / Mgmt
- −$275
- Net cashflow
- $315
Break-even live
UW: 25.0% down · 7.5% · 30yr · 1.5% tax · 5.0% vac · 8.0% maint · 8.0% mgmt
Financing live
Cash to close
- Down payment
- $27,475
- Closing costs
- $3,297
- Reserves months
- —
- Total cash needed
- —
Loan-product check · same deal, 3 products live
Conventional
25% down · 7.5% · 30yr
- Down + closing
- —
- Monthly P&I
- —
- Monthly cashflow
- —
- DSCR
- —
- Eligible?
- —
Personal DTI + credit; lowest rate.
DSCR
20% down · 8.5% · 30yr
- Down + closing
- —
- Monthly P&I
- —
- Monthly cashflow
- —
- DSCR
- —
- Eligible?
- —
No personal income docs; deal must DSCR.
Hard money
10% down · 12.0% · 12mo
- Down + closing
- —
- Monthly P&I
- —
- Monthly cashflow
- —
- DSCR
- —
- Eligible?
- —
Short-term bridge; refi at stabilization.
Rent comps 19 comps
| Address | Beds | Baths | Sqft | Rent | $/sqft | DOM | Units | Dist |
|---|---|---|---|---|---|---|---|---|
| 1024 Colonial Dr Jacksonville, AR | 3.0 | 2.0 | 1640 | $1,400 | $0.85 | 23d | 1 | 0.26mi |
| 1311 Madden Rd Jacksonville, AR | 2.0 | 1.0 | 1040 | $795 | $0.76 | 43d | 1 | 0.35mi |
| 428 N Oak St Jacksonville, AR | 3.0 | 1.5 | 996 | $1,325 | $1.33 | 43d | 1 | 1.01mi |
| 620 Neal St Jacksonville, AR | 3.0 | 1.0 | 900 | $895 | $0.99 | 43d | 1 | 1.13mi |
| 302 Redbud Ct Jacksonville, AR | 4.0 | 2.0 | 1559 | $1,995 | $1.28 | 23d | 1 | 1.13mi |
| 516 Hill St Jacksonville, AR | 3.0 | 1.5 | 1380 | $1,175 | $0.85 | 43d | 1 | 1.13mi |
| 300 Redbud Ct Jacksonville, AR | 4.0 | 2.0 | 1559 | $1,995 | $1.28 | 23d | 1 | 1.13mi |
| 1000 Lessel Dr Jacksonville, AR | 3.0 | 2.5 | 1845 | $1,350 | $0.73 | 43d | 1 | 1.15mi |
| 89 Belair Loop Jacksonville, AR | 3.0 | 2.0 | 1093 | $1,450 | $1.33 | 21d | 1 | 1.18mi |
| 712 W Martin St Jacksonville, AR | 2.0 | 1.0 | 936 | $995 | $1.06 | 43d | 1 | 1.27mi |
| 1501 Angie Ct Jacksonville, AR | 3.0 | 2.0 | 1296 | $1,595 | $1.23 | 21d | 1 | 1.34mi |
| 1310 Smithwick Dr Jacksonville, AR | 1.0–2.0 | 1.0–1.5 | 862 | $830 | $0.96 | 14d | 28 | 1.35mi |
| 107 Pike Ave Jacksonville, AR | 3.0 | 1.0 | 1092 | $995 | $0.91 | 43d | 1 | 1.39mi |
| 10 Kaye Ln Jacksonville, AR | 3.0 | 1.0 | 1352 | $1,250 | $0.92 | 23d | 1 | 1.44mi |
| 1401 Rebel Dr Jacksonville, AR | 3.0 | 1.0 | 923 | $1,050 | $1.14 | 23d | 1 | 1.44mi |
| 58 Wright Cir Jacksonville, AR | 4.0 | 2.5 | 1468 | $1,450 | $0.99 | 14d | 1 | 1.44mi |
| 215 N Elm St Unit 215 Jacksonville, AR | 3.0 | 2.5 | 1600 | $1,475 | $0.92 | 23d | 1 | 1.45mi |
| 66 Wright Cir Jacksonville, AR | 3.0 | 2.0 | 1246 | $1,595 | $1.28 | 23d | 1 | 1.46mi |
| 212 Wright Cv Jacksonville, AR | 3.0 | 1.5 | 1326 | $1,350 | $1.02 | 23d | 1 | 1.47mi |
Listing history 22 events
-
2026-06-18days on market $109,900 Active 55 DOM
-
2026-06-17days on market $109,900 Active 54 DOM
-
2026-06-16days on market $109,900 Active 53 DOM
-
2026-06-15days on market $109,900 Active 52 DOM
-
2026-06-14days on market $109,900 Active 50 DOM
-
2026-06-13days on market $109,900 Active 49 DOM
-
2026-06-10days on market $109,900 Active 47 DOM
-
2026-06-09days on market $109,900 Active 46 DOM
-
2026-06-08days on market $109,900 Active 45 DOM
-
2026-06-07days on market $109,900 Active 44 DOM
-
2026-06-05days on market $109,900 Active 41 DOM
-
2026-06-03days on market $109,900 Active 40 DOM
-
2026-06-02days on market $109,900 Active 39 DOM
-
2026-06-01days on market $109,900 Active 38 DOM
-
2026-05-31days on market $109,900 Active 37 DOM
-
2026-05-31days on market $109,900 Active 36 DOM
-
2026-05-18price $109,900 676-char remark
-
2026-04-24$114,900 New Listing 676-char remark
-
2022-08-16soldstatus $91,000
-
2022-08-10soldstatus $91,000 Sold 151-char remark
Show marketing remark (151 chars)
Well maintained 3 BD 1.5 BA home in Jacksonville. Laminate wood floors in LR and Kitchen. Storm shelter in the enclosed carport. Fully fenced backyard.
-
2022-07-18status Under Contract 151-char remark
Show marketing remark (151 chars)
Well maintained 3 BD 1.5 BA home in Jacksonville. Laminate wood floors in LR and Kitchen. Storm shelter in the enclosed carport. Fully fenced backyard.
-
2022-07-15$92,500 New Listing 151-char remark
Show marketing remark (151 chars)
Well maintained 3 BD 1.5 BA home in Jacksonville. Laminate wood floors in LR and Kitchen. Storm shelter in the enclosed carport. Fully fenced backyard.
ⓘ Source: listings_history table (triggers on properties + properties_extension) + one-shot
backfill from property_details.listing_events for pre-trigger history.
Tax reassessment forecast AR · Resets to sale price
- Current annual tax
- $1,155 · $96/mo
- Projected year-2 tax
- $1,155 · $96/mo
- Expected delta
- $0/yr ($0/mo · 0.0%)
ⓘ Screening estimate from a state-policy table — verify with the county assessor before closing.
Climate risk First Street
- Flood 1/10 Low FEMA zone X (unshaded) · 0% chance over 30 yrs
- Wildfire 4/10 Moderate
- Heat 6/10 Major 7 d/yr ≥110°F today · 18 d/yr by 30 yrs out
- Wind 4/10 Moderate 9% chance of damaging wind over 30 yrs
- Air quality 2/10 Low 1 unhealthy d/yr today · 2 by 30 yrs out
Nearby sold comps map
Loading sold comps map…
Walkable amenities ~0.75 mi
Loading nearby amenities…
Taxation est. · year 1
- Rental income
- $15,700
- − Mortgage interest
- −$6,156
- − Property taxes
- −$1,155
- − Insurance
- −$550
- − Repairs & maintenance
- −$1,256
- − Management
- −$1,256
- − Depreciation
- −$3,197
- Taxable income
- $2,130
- Est. tax owed @ 24.0%
- −$511
- After-tax cash flow
- $3,271/yr
For passive investors: Depreciation is non-cash, so a rental often shows a tax loss while cash-flowing — sheltering income. Rental losses are passive: they offset passive income freely, and up to $25,000/yr can offset ordinary (W-2) income if you actively participate and your MAGI is under $100k (phasing out to $0 by $150k); unused losses carry forward. On sale, claimed depreciation is recaptured at up to 25%, and gains may owe capital-gains tax (a 1031 exchange can defer both). Figures are a year-1 estimate at your 24.0% rate — not tax advice; consult a CPA.
Schools (NCES district)
- District
- Jacksonville North Pulaski School District
- NCES district ID
- 0500419
- Math proficiency
- 18% ▼ -7.00%
- Reading proficiency
- 20% ▼ -5.00%
- Median HH income
- $50,869
- Composite
- 17.16/100
- National rank
- #9110
- State rank
- #211 of 238 in AR
Livability — Jacksonville
- Score
- 61/100
- State rank
- #231
- US rank
- #17378
Category grades
Schools grade is shown separately in the Schools card above.
Census & demographics
- Census place
- Jacksonville, AR
- County
- Pulaski County · 372,764 people
- City population
- 38,437
- Metro
- Little Rock-North Little Rock-Conway, AR
- Population (ZIP)
- 38,437
- Household income
- $54,379
- Rent vs Own
- Severe rent burden
- 1733.0
Population outlook (Pulaski County) Hauer SSP2
- Today (2025)
- 415,378 people
- By 2030
- 423,720 · +2.0%
- By 2040
- 435,182 · +4.8%
- By 2050
- 440,904 · +6.1%
- By 2075
- 445,521 · +7.3%
- By 2100
- 419,173 · +0.9%
Race, ethnicity, and origin ACS 2023
- Neighborhood character
- Diverse neighborhood (Simpson 0.63)
- Race & ethnicity
- White 47% Black 38% Hispanic / Latino 8% Two or more races 8% Asian 1%
- Hispanic origin (detail)
- Mexican 6%
- Common ancestry
- Slovak 2% Italian 2% Serbian 1%
- Foreign-born
- 4% · Canada
- Languages at home
- 94% English-only · Spanish 4% Tagalog/Filipino 1%
Political lean MEDSL · Pulaski
- 2024 margin
- Strong D (+22.1) · D 59.8% · R 37.7% · Other 2.5%
- 2008→2024 swing
- +10.6pp toward D · 2008: 11.6pp · 2024: 22.1pp
- All cycles
- 2024: D+22.1 2020: D+22.5 2016: D+17.9 2012: D+11.4 2008: D+11.6
Not yet ingested
- Civics
- —
Market trends
- HPI YoY
- ▼ -87.51%
- Current HPI
- 201.6405
- Rent YoY
- ▲ 3.07%
- Metro
- Little Rock-North Little Rock-Conway, AR
- State GDP YoY
- ▲ 3.80%
- F500 in state
- 10
Industry mix (Fortune 500 HQ in AR)
| Industry | F500 HQs | Revenue |
|---|---|---|
| Retail | 1 | $681B |
|
||
| Food / Agriculture | 1 | $53B |
|
||
| Retail / Energy | 1 | $22B |
|
||
| Transportation / Logistics | 1 | $12B |
|
||
| Energy | 1 | $4B |
|
||
Price history
+18.8% since first listed6 events — show timeline
- 2026-05-18 Price Changed $109,900 CARMLS
- 2026-04-24 Listed $114,900 CARMLS
- 2022-08-16 Sold (Public Records) $91,000 Public Records
- 2022-08-10 Sold (MLS) $91,000 CARMLS
- 2022-07-18 Pending — CARMLS
- 2022-07-15 Listed $92,500 CARMLS
Property tax history
+3.9%/yrLatest (2025): $1,155 · +0.0% YoY. Source: county tax records.
Cash-flow waterfall
monthlySold comps — $/sqft
last 12 mo · ≤1 miLoading sold comps…