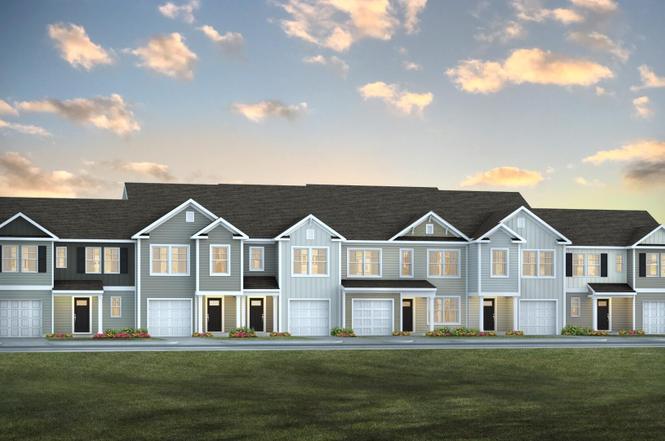
920 Long Bluff Rd · Summerville, SC
Flood risk No data
- FEMA flood zone
- —
- Chance of flooding over 30 yrs
- —
- Est. flood insurance / yr
- —
Fire risk No data
- Est. fire insurance / yr
- —
Heat risk No data
- Hot days now (above threshold)
- —
- Hot days in 30 yrs
- —
Wind risk No data
- Chance of severe wind over 30 yrs
- —
Air-quality risk No data
- Unhealthy air days now
- —
- Unhealthy air days in 30 yrs
- —
Risk factors via First Street. Map © Google.
Why this score? — see what drove the F grade
The composite is a weighted blend of 9 inputs, each scored 0–100. Each bar is that input's sub-score; the figure is the points it added to the 100-point composite (weight × sub-score).
- Cash flow +8.0/30.0
- ARV discount +7.5/15.0
- Schools +3.6/10.0
- Rent growth +3.2/5.0
- Livability +3.2/5.0
- 1% rule +2.7/10.0
- Condition / age +2.5/5.0
- DSCR +2.0/10.0
- Appreciation +0.0/10.0
$354,345
🖨 Deal sheet (PDF) 📄 Offer letter ✓ Due diligence
Listing remarks
Special Interest Rate with Closing Cost Assistance paid for by Builder. Welcome to 920 Long Bluff Road located in Pine Hills; a premier neighborhood located within the highly sought-after, master-planned community of Cane Bay in Summerville, SC. Residents enjoy true resort-style living with access to exceptional amenities including a massive water slide, resort pool, lap pool, playground, bocce ball courts, grilling stations, and an outdoor fire pit lounge. Pine Hills also stands out with three convenient entrances, offering easy access in and out of the community--an uncommon feature within Cane Bay. With beautiful new homes, abundant amenities, and a prime Summerville location near school
Key facts
- Resort pool
- Massive water slide
- Bocce ball courts
Tags
Neighborhood map
What this means for you Summary
Snapshot
- This is a 5-bed/2.5-bath land listed at $354k.
Deal economics
- At list price, monthly cash flow is $-365 ($-4k/yr) — negative.
- To cash-flow at today's rent, offer at most $302k (14.9% below list).
- To meet the 1% rule (rent ≥ 1% of price), the offer needs to be $273k (22.9% below list).
- Recommended offer: $273k (22.9% below list) — sets the bar for 1% rule.
- Cap rate 5.1% vs local median 3.9% in Summerville — meaningfully above typical; check what's discounted (condition, days-on-market, listing class) to confirm the premium yield is real.
Location & tenants
- Location reads 63/100 on livability (#167 in SC) — a middle-class / working-renter tenant base. Strengths: housing A+, cost of living B+; Watch: amenities F, commute F, health & safety F.
- Berkeley 01 (suburban): math 35% / reading 48% proficiency, ranked #30 of 80 in SC (top 38%) — families likely to look elsewhere, expect single-tenant / working-renter base with shorter leases.
- Zoned schools: Whitesville Elementary (math 34% / reading 39%, grade F, #328 of 597 statewide, top 55%, 1,031 students, 62% FRL); Berkeley Middle (math 19% / reading 32%, grade F, #162 of 229 statewide, top 71%, 1,403 students, 57% FRL); Berkeley High (math 36% / reading 83%, grade C+, #110 of 196 statewide, top 58%, 1,776 students, 50% FRL).
- Market conditions: Rents rising (+2.7%/yr); 1301 active listings in the ZIP; 17 comparable units currently listed for rent nearby; rentals at typical pace (median 16d on market — plan ~3-4 weeks tenant-placement turnaround); solid renter incomes; 3,183 units permitted in Berkeley County in 2024 (580 in 5+ unit buildings).
- This rent runs 37% of the median local income ($90k/yr) — at the standard rent-burdened threshold; future hikes will face affordability resistance.
Forward outlook
- Local home prices are declining (-3.0%/yr); year-one equity from $2k of loan paydown is wiped out by about $11k of value loss. Plan a longer hold.
- Berkeley County population projected at +48% by 2050 — long-run rental-demand tailwind backs the buy-and-hold thesis.
Negotiation context
- It's been on market 42 days — a 3% lower offer ($344k) is reasonable based on typical stale-listing flexibility.
Questions for the listing agent
- What do current leases actually rent for vs. the listed asking? Can we see a recent rent roll and the last 12 months of T-12 income?
- It's been on market 42 days. Have you received any prior offers? Is the seller open to a 23% concession, seller financing, or rate buy-down credit?
- What does the HOA fee cover, when was the last increase, and are there any pending special assessments or reserve-fund shortfalls?
- Is there a deadline driving the sale (1031 exchange, divorce, estate, relocation)? That informs how much negotiation room exists.
- Schools are B-rated — typically a magnet for longer-tenancy family renters. What's the average tenant stay here, and is there a school-zone premium baked into asking?
- The area grade is low — what's the realistic commute time and amenity access for the typical tenant pool here? Any planned neighborhood developments (good or bad) we should know about?
- What's the average days-on-market for RENTAL listings here right now (not sales)? A rising rental-DOM trend means longer vacancies and softer asking-rent achievability than the comps imply.
- What's the recent tenant-quality profile in this submarket — average credit score on applications, eviction rate, late-payment / NSF rate, and stable-employment percentage? A property-management company in the area should have these aggregated.
- How much new for-sale + rental construction is in the pipeline within 1–3 miles? Heavy new supply typically softens prices + rents 12–24 months out; constrained supply supports both.
Investment metrics
- 1% rule
- 0.77% ✗
- Cap rate
- 5.06%
- Cash-on-cash
- -4.41%
- DSCR
- 0.80
- GRM
- 10.8
CMA / ARV
No comps found within radius.
Projected returns pro-forma
-3.0% appreciation · 2.67% rent growth · sell at horizon
- IRR
- -24.1%
- Equity multiple
- 0.18×
- Total profit
- $-81,464
- Equity at exit
- $52,834
- IRR
- -20.2%
- Equity multiple
- -0.05×
- Total profit
- $-104,181
- Equity at exit
- $30,637
Cash invested: $99,217 (down + closing). Projections, not guarantees.
Landlord ↔ Tenant lean methodology
- Overall (STATE)
- 90 Strongly Landlord-Friendly
- State South Carolina
- 90 Strongly Landlord-Friendly · R+6
- County
- — inherits STATE
- City
- — inherits STATE
ZIP-level market 29486
- Home prices YoY
- -15.6%
- Rents YoY
- 2.7%
- Active inventory
- 1301
- Price-to-rent
- 10.8×
Monthly cashflow live
- Estimated rent
- $2,731 high interval (Pro) →
- Mortgage (P&I)
- −$1,858
- Tax est. 1.5%
- −$443 /mo · $5,315/yr
- Insurance
- −$148
- HOA
- −$73
- Vacancy / Maint / Mgmt
- −$573
- Net cashflow
- $-365
Break-even live
Sensitivity live
| Price | -10% $-120 | -5% $-242 | +0% $-365 | +5% $-487 | +10% $-610 |
|---|---|---|---|---|---|
| Rent | -10% $-580 | -5% $-473 | +0% $-365 | +5% $-257 | +10% $-149 |
| Rate | -1.0pp $-186 | -0.5pp $-275 | base $-365 | +0.5pp $-457 | +1.0pp $-550 |
UW: 25.0% down · 7.5% · 30yr · 1.5% tax · 5.0% vac · 8.0% maint · 8.0% mgmt
Financing live
Cash to close
- Down payment
- $88,586
- Closing costs
- $10,630
- Reserves months
- —
- Total cash needed
- —
Loan-product check · same deal, 3 products live
Conventional
25% down · 7.5% · 30yr
- Down + closing
- —
- Monthly P&I
- —
- Monthly cashflow
- —
- DSCR
- —
- Eligible?
- —
Personal DTI + credit; lowest rate.
DSCR
20% down · 8.5% · 30yr
- Down + closing
- —
- Monthly P&I
- —
- Monthly cashflow
- —
- DSCR
- —
- Eligible?
- —
No personal income docs; deal must DSCR.
Hard money
10% down · 12.0% · 12mo
- Down + closing
- —
- Monthly P&I
- —
- Monthly cashflow
- —
- DSCR
- —
- Eligible?
- —
Short-term bridge; refi at stabilization.
Rent comps 17 comps
| Address | Beds | Baths | Sqft | Rent | $/sqft | DOM | Units | Dist |
|---|---|---|---|---|---|---|---|---|
| 114 Haventree Ct Summerville, SC | 5.0 | 2.5 | 2240 | $2,600 | $1.16 | 16d | 1 | 0.20mi |
| 108 Haventree Ct Summerville, SC | 4.0 | 2.5 | 1792 | $2,400 | $1.34 | 25d | 1 | 0.20mi |
| 729 Long Bluff Rd Summerville, SC | 5.0 | 3.0 | 2361 | $2,800 | $1.19 | 25d | 1 | 0.54mi |
| 742 Ladywood Dr Summerville, SC | 4.0 | 2.5 | 1976 | $2,795 | $1.41 | 4d | 1 | 0.67mi |
| 121 Blossom Wood Ln Summerville, SC | 4.0 | 2.5 | 1976 | $2,300 | $1.16 | 25d | 1 | 0.68mi |
| 128 Holly Leaf Ln Summerville, SC | 5.0 | 3.0 | 2409 | $2,650 | $1.10 | 5d | 1 | 0.79mi |
| 163 Horizon Ridge Dr Moncks Corner, SC | 4.0 | 2.5 | 2203 | $2,600 | $1.18 | 5d | 1 | 0.95mi |
| 229 Grand View Xing Summerville, SC | 4.0 | 2.0 | 1768 | $2,400 | $1.36 | 16d | 1 | 0.96mi |
| 725 Meadowbrook Ln Summerville, SC | 5.0 | 3.0 | 2670 | $2,580 | $0.97 | 12d | 1 | 1.11mi |
| 376 Tiliwa St Summerville, SC | 5.0 | 2.5 | 2400 | $2,500 | $1.04 | 25d | 1 | 1.14mi |
| 175 Lyra Ln Summerville, SC | 3.0–4.0 | 2.0–3.0 | 2082 | $2,450 | $1.18 | 5d | 3 | 1.14mi |
| 604 Polaris Way Summerville, SC | 5.0 | 3.0 | 2688 | $2,875 | $1.07 | 16d | 1 | 1.26mi |
| 788 Redbud Ln Summerville, SC | 4.0 | 2.5 | 2070 | $2,500 | $1.21 | 16d | 1 | 1.32mi |
| 519 Donnas View Way Summerville, SC | 5.0 | 3.0 | 2469 | $2,750 | $1.11 | 4d | 1 | 1.39mi |
| 114 Lyra Ln Summerville, SC | 5.0 | 3.0 | 2704 | $2,675 | $0.99 | 4d | 1 | 1.42mi |
| 177 Hayworth Rd Summerville, SC | 4.0 | 3.0 | 2254 | $2,695 | $1.20 | 5d | 1 | 1.44mi |
| 507 Donnas View Way Summerville, SC | 4.0 | 2.5 | 2290 | $2,700 | $1.18 | 25d | 1 | 1.45mi |
HOA detail
- Monthly dues
- $73 · $876/yr
- Likely covers
- waterpool
Listing history 13 events
-
2026-06-21days on market $354,345 Active 42 DOM
-
2026-06-18days on market $354,345 Active 39 DOM
-
2026-06-17days on market $354,345 Active 38 DOM
-
2026-06-16days on market $354,345 Active 37 DOM
-
2026-06-15days on market $354,345 Active 36 DOM
-
2026-06-13days on market $354,345 Active 34 DOM
-
2026-06-13days on market $354,345 Active 33 DOM
-
2026-06-10days on market $354,345 Active 31 DOM
-
2026-06-09days on market $354,345 Active 30 DOM
-
2026-06-08status $354,345 Active 29 DOM
-
2026-02-24status Pending
-
2026-02-15price $354,345
-
2026-01-26$356,845 Active
ⓘ Source: listings_history table (triggers on properties + properties_extension) + one-shot
backfill from property_details.listing_events for pre-trigger history.
Nearby sold comps map
Loading sold comps map…
Walkable amenities ~0.75 mi
Loading nearby amenities…
Taxation est. · year 1
- Rental income
- $32,766
- − Mortgage interest
- −$19,849
- − Property taxes
- −$5,315
- − Insurance
- −$1,772
- − Repairs & maintenance
- −$2,621
- − Management
- −$2,621
- − HOA
- −$876
- − Depreciation
- −$10,308
- Taxable loss
- −$10,596
- Est. tax savings @ 24.0%
- +$2,543
- After-tax cash flow
- $-1,833/yr
For passive investors: Depreciation is non-cash, so a rental often shows a tax loss while cash-flowing — sheltering income. Rental losses are passive: they offset passive income freely, and up to $25,000/yr can offset ordinary (W-2) income if you actively participate and your MAGI is under $100k (phasing out to $0 by $150k); unused losses carry forward. On sale, claimed depreciation is recaptured at up to 25%, and gains may owe capital-gains tax (a 1031 exchange can defer both). Figures are a year-1 estimate at your 24.0% rate — not tax advice; consult a CPA.
Schools (NCES district)
- District
- Berkeley 01
- NCES district ID
- 4501170
- Math proficiency
- 35% ▼ -8.00%
- Reading proficiency
- 48% ▼ -2.00%
- Median HH income
- $52,724
- Composite
- 35.95/100
- National rank
- #4799
- State rank
- #30 of 80 in SC
Livability — Summerville
- Score
- 63/100
- State rank
- #167
- US rank
- #15058
Category grades
Schools grade is shown separately in the Schools card above.
Census & demographics
- County
- Berkeley County · 198,768 people
- City population
- 171,668
- Metro
- Charleston-North Charleston, SC
- Population (ZIP)
- 53,975
- Household income
- $89,578
- Rent vs Own
- Severe rent burden
- 1017.0
Population outlook (Berkeley County) Hauer SSP2
- Today (2025)
- 254,184 people
- By 2030
- 279,677 · +10.0%
- By 2040
- 329,379 · +29.6%
- By 2050
- 375,557 · +47.8%
- By 2075
- 476,740 · +87.6%
- By 2100
- 535,945 · +110.8%
Race, ethnicity, and origin ACS 2023
- Neighborhood character
- Diverse neighborhood (Simpson 0.56)
- Race & ethnicity
- White 62% Black 19% Two or more races 10% Hispanic / Latino 10% Asian 2%
- Hispanic origin (detail)
- Mexican 4% Puerto Rican 2%
- Common ancestry
- Lithuanian 4% Italian 2% Romanian 2%
- Foreign-born
- 5% · Canada, Jamaica
- Languages at home
- 91% English-only · Spanish 6% German/W. Germanic 1%
Political lean MEDSL · Berkeley
- 2024 margin
- R (+16.3) · D 41.1% · R 57.4% · Other 1.4%
- 2008→2024 swing
- -3.2pp toward R · 2008: -13.1pp · 2024: -16.3pp
- All cycles
- 2024: R+16.3 2020: R+11.7 2016: R+17.4 2012: R+18.9 2008: R+13.1
Not yet ingested
- Civics
- —
Market trends
- HPI YoY
- ▼ -52.74%
- Current HPI
- 285.0567
- Rent YoY
- ▲ 2.67%
- Metro
- Charleston-North Charleston, SC
- State GDP YoY
- ▲ 4.51%
- F500 in state
- 2
Industry mix (Fortune 500 HQ in SC)
| Industry | F500 HQs | Revenue |
|---|---|---|
| Packaging | 1 | $7B |
|
||
Price history
-0.7% since first listed3 events — show timeline
- 2026-02-24 Pending — Charleston Trident MLS
- 2026-02-15 Price Changed $354,345 Charleston Trident MLS
- 2026-01-26 Listed $356,845 Charleston Trident MLS
Cash-flow waterfall
monthlySold comps — $/sqft
last 12 mo · ≤1 miLoading sold comps…