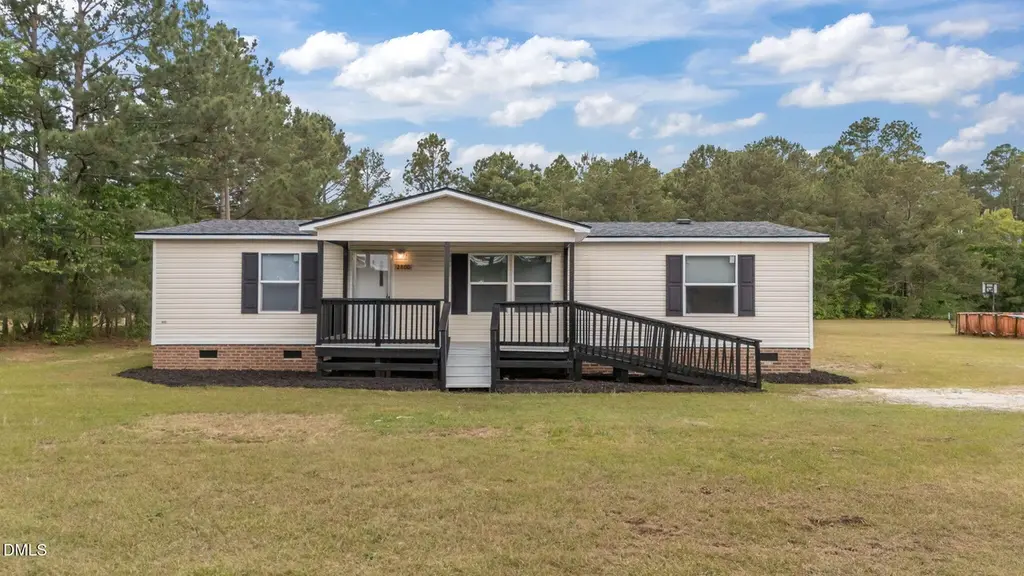
2800 Lobelia Rd · Vass, NC
Flood risk 1/10 · Minimal
- FEMA flood zone
- X (unshaded)
- Chance of flooding over 30 yrs
- 0.0%
- Est. flood insurance / yr
- $507 – $1,088
Fire risk 5/10 · Moderate
- Est. fire insurance / yr
- $906 – $1,684
Heat risk 7/10 · Major
- Hot days now (above 106°F)
- 7 days/yr
- Hot days in 30 yrs
- 16 days/yr
Wind risk 6/10 · Moderate
- Chance of severe wind over 30 yrs
- 70.0%
Air-quality risk 1/10 · Minimal
- Unhealthy air days now
- 0 days/yr
- Unhealthy air days in 30 yrs
- 0 days/yr
Risk factors via First Street. Map © Google.
Why this score? — see what drove the B- grade
The composite is a weighted blend of 9 inputs, each scored 0–100. Each bar is that input's sub-score; the figure is the points it added to the 100-point composite (weight × sub-score).
- Cash flow +26.3/30.0
- ARV discount +15.0/15.0
- DSCR +8.9/10.0
- 1% rule +5.8/10.0
- Schools +4.4/10.0
- Livability +2.9/5.0
- Rent growth +2.5/5.0
- Condition / age +2.5/5.0
- Appreciation +0.0/10.0
$199,000
🖨 Deal sheet 📄 Offer letter ✓ Due diligence
Listing remarks
Affordable living in a desirable Moore County location! This move-in-ready 3-bedroom, 2-bath home sits on nearly an acre of land and offers both comfort and convenience. Brand new brick veneer underpinning. Located less than 3 miles from Woodlake Resort & Country Club and under 20 minutes from Whispering Pines and Carvers Creek State Park, this home is perfectly positioned for golf enthusiasts and nature lovers alike. Recent updates include brand-new flooring, new siding, and a new roof, providing peace of mind for years to come. The home is all-electric and ready for its next owner. Commuting to base? Enjoy an easy drive of approximately 30 minutes. With space, updates, and a prime l
Key facts
- New siding
- New flooring
- Permanent foundation
Tags
Property features AI
Finance
- Other: Lot size approximately 0.91 acre
- HOA & community: No homeowners association
Exterior
- Utilities: Public water; Septic tank
- Home design: Manufactured double-wide home; Single-story
- Construction: Vinyl siding; Built as a manufactured house
- Exterior features: Architectural shingle roof; Foundation: Other
Interior
- Bedrooms: Three bedrooms, all on the main level
- Flooring: Carpet; Luxury vinyl
- Bathrooms: Two full bathrooms
- Heating & cooling: Forced air heating; Central air conditioning
- Interior features: Carpet and luxury vinyl flooring
Neighborhood map
What this means for you Summary
Snapshot
- This is a 3-bed/2.0-bath single-family listed at $199k.
Deal economics
- At list price, monthly cash flow is $512 ($6k/yr) — positive.
- The deal already cash-flows at list — no discount required.
- Meets the 1% rule at list price ($2k rent vs $199k).
- Recommended offer: $193k (3.0% below list) — sets the bar for market timing.
- Cap rate 9.4% vs local median 4.0% in Vass — top-decile yield for the area; either an underpriced asset or a hidden risk that comps aren't pricing in. Stress-test before assuming the spread holds.
Location & tenants
- Location reads 57/100 on livability (#593 in NC) — a working-class tenant base; expect higher turnover. Strengths: cost of living A+, housing A; Watch: health & safety C-, schools D+, crime D.
- Moore County Schools (rural): math 48% / reading 54% proficiency, ranked #58 of 178 in NC (top 33%) — acceptable for families but not a draw, mixed tenant base, ~2y average lease.
- Market conditions: 225 active listings in the ZIP; solid renter incomes; 941 units permitted in Moore County in 2024 (0 in 5+ unit buildings).
- This rent runs 32% of the median local income ($80k/yr) — at the standard rent-burdened threshold; future hikes will face affordability resistance.
Forward outlook
- Local home prices are declining (-3.0%/yr); year-one equity from $1k of loan paydown is wiped out by about $6k of value loss. Plan a longer hold.
- Moore County population projected at +29% by 2050 — long-run rental-demand tailwind backs the buy-and-hold thesis.
- At projected returns (-3.0% appreciation + 3.0% rent growth), your $56k cash investment doubles in ~10 years — after that, you're playing with house money.
Negotiation context
- It's been on market 48 days — a 3% lower offer ($193k) is reasonable based on typical stale-listing flexibility.
- 3 sale attempts with the ask held roughly flat each time — persistent listings suggest the price (not the market) is what's stuck; bring a comps-based counter.
- Current owner paid $110k; list at $199k implies a 81% gain — meaningful room to come down on a strong offer.
Risks & watch-outs
- Climate carrying-cost: major wind risk, 70% chance of damaging wind over 30y; moderate wildfire risk; extreme-heat days projected 7→16/yr by 2055 (HVAC capex compounding) — expect insurance premiums to compound above CPI over the hold.
Questions for the listing agent
- It's been on market 48 days. Have you received any prior offers? Is the seller open to a 3% concession, seller financing, or rate buy-down credit?
- Is there a deadline driving the sale (1031 exchange, divorce, estate, relocation)? That informs how much negotiation room exists.
- Schools are D-rated, which usually means shorter tenancies and higher turnover. Who's the typical renter profile here, and what's been the actual vacancy rate?
- Crime grade is D in this area — have there been break-ins, vandalism, or insurance claims at this property in the last 3 years? What carrier currently insures it and at what premium?
- What's the average days-on-market for RENTAL listings here right now (not sales)? A rising rental-DOM trend means longer vacancies and softer asking-rent achievability than the comps imply.
- What's the recent tenant-quality profile in this submarket — average credit score on applications, eviction rate, late-payment / NSF rate, and stable-employment percentage? A property-management company in the area should have these aggregated.
- How much new for-sale + rental construction is in the pipeline within 1–3 miles? Heavy new supply typically softens prices + rents 12–24 months out; constrained supply supports both.
Investment metrics
- 1% rule
- 1.08% ✓
- Cap rate
- 9.38%
- Cash-on-cash
- 11.02%
- DSCR
- 1.49
- GRM
- 7.7
CMA / ARV
- ARV (on-the-fly)
- $308,100
- Comps found
- 6
Show comp detail 6 sales within ~0.75 mi
| Address | Dist | Beds/Ba | Sqft | Sold | Price | $/sf | Match |
|---|---|---|---|---|---|---|---|
| 876 Thrush Dr | 0.19mi | 3/2.0 | 1,392 (+7%) | 0mo | $345,000 | $248 | 79 |
| 872 Elderberry Dr | 0.27mi | 3/2.0 | 1,433 (+10%) | 4mo | $339,900 | $237 | 67 |
| 749 Thrush Dr | 0.40mi | 3/2.0 | 1,388 (+7%) | 7mo | $309,000 | $223 | 64 |
| 715 Blue Bird Dr | 0.48mi | 3/2.0 | 1,433 (+10%) | 1mo | $344,900 | $241 | 60 |
| 635 Chuckar Ct | 0.51mi | 3/2.0 | 1,481 (+14%) | 9mo | $260,000 | $176 | 45 |
| 715 Tanager Dr | 0.59mi | 3/2.0 | 1,433 (+10%) | 19mo | $338,400 | $236 | 40 |
Match score weights: distance 35% · size 25% · config 20% · recency 20%. Top-matched comps best support the ARV.
Projected returns pro-forma
-3.0% appreciation · 3.0% rent growth · sell at horizon
- IRR
- 0.1%
- Equity multiple
- 1.00×
- Total profit
- $259
- Equity at exit
- $29,672
- IRR
- 9.7%
- Equity multiple
- 1.75×
- Total profit
- $41,855
- Equity at exit
- $17,206
Cash invested: $55,720 (down + closing). Projections, not guarantees.
Landlord ↔ Tenant lean methodology
- Overall (STATE)
- 85 Strongly Landlord-Friendly
- State North Carolina
- 85 Strongly Landlord-Friendly · R+3
- County
- — inherits STATE
- City
- — inherits STATE
ZIP-level market 28394
- Active inventory
- 225
- Price-to-rent
- 7.7×
Monthly cashflow live
- Estimated rent
- $2,153 medium interval (Pro) →
- Mortgage (P&I)
- −$1,044
- Tax from tax record
- −$62 /mo · $749/yr
- Insurance
- −$83
- HOA
- −$0
- Vacancy / Maint / Mgmt
- −$452
- Net cashflow
- $512
Break-even live
UW: 25.0% down · 7.5% · 30yr · 1.5% tax · 5.0% vac · 8.0% maint · 8.0% mgmt
Financing live
Cash to close
- Down payment
- $49,750
- Closing costs
- $5,970
- Reserves months
- —
- Total cash needed
- —
Loan-product check · same deal, 3 products live
Conventional
25% down · 7.5% · 30yr
- Down + closing
- —
- Monthly P&I
- —
- Monthly cashflow
- —
- DSCR
- —
- Eligible?
- —
Personal DTI + credit; lowest rate.
DSCR
20% down · 8.5% · 30yr
- Down + closing
- —
- Monthly P&I
- —
- Monthly cashflow
- —
- DSCR
- —
- Eligible?
- —
No personal income docs; deal must DSCR.
Hard money
10% down · 12.0% · 12mo
- Down + closing
- —
- Monthly P&I
- —
- Monthly cashflow
- —
- DSCR
- —
- Eligible?
- —
Short-term bridge; refi at stabilization.
Listing history 24 events
-
2026-06-19days on market $199,000 Active 48 DOM
-
2026-06-18days on market $199,000 Active 47 DOM
-
2026-06-17days on market $199,000 Active 46 DOM
-
2026-06-16days on market $199,000 Active 45 DOM
-
2026-06-15price $199,000 Active 44 DOM
-
2026-06-15days on market $205,000 Active 44 DOM
-
2026-06-14days on market $205,000 Active 42 DOM
-
2026-06-13days on market $205,000 Active 41 DOM
-
2026-06-10days on market $205,000 Active 39 DOM
-
2026-06-09days on market $205,000 Active 38 DOM
-
2026-06-08days on market $205,000 Active 37 DOM
-
2026-06-07days on market $205,000 Active 36 DOM
-
2026-06-05days on market $205,000 Active 33 DOM
-
2026-06-02days on market $205,000 Active 31 DOM
-
2026-06-01days on market $205,000 Active 30 DOM
-
2026-05-31days on market $205,000 Active 29 DOM
-
2026-05-30days on market $205,000 Active 28 DOM
-
2026-05-01$205,000 Active
-
2026-04-20historical
-
2026-04-20historical
-
2026-03-30price $204,900
-
2026-01-02$205,000 Active
-
2026-01-02$205,000 Active
-
2025-10-10soldstatus $110,000
ⓘ Source: listings_history table (triggers on properties + properties_extension) + one-shot
backfill from property_details.listing_events for pre-trigger history.
Tax reassessment forecast NC · Resets to sale price
- Current annual tax
- $749 · $62/mo
- Projected year-2 tax
- $1,632 · $136/mo
- Expected delta
- +$883/yr (+$74/mo · 117.8%)
ⓘ Screening estimate from a state-policy table — verify with the county assessor before closing.
Climate risk First Street
- Flood 1/10 Low FEMA zone X (unshaded) · 0% chance over 30 yrs
- Wildfire 5/10 Major
- Heat 7/10 Severe 7 d/yr ≥106°F today · 16 d/yr by 30 yrs out
- Wind 6/10 Major 70% chance of damaging wind over 30 yrs
- Air quality 1/10 Low 0 unhealthy d/yr today · 0 by 30 yrs out
Nearby sold comps map
Loading sold comps map…
Walkable amenities ~0.75 mi
Loading nearby amenities…
Taxation est. · year 1
- Rental income
- $25,832
- − Mortgage interest
- −$11,147
- − Property taxes
- −$749
- − Insurance
- −$995
- − Repairs & maintenance
- −$2,067
- − Management
- −$2,067
- − Depreciation
- −$5,789
- Taxable income
- $3,018
- Est. tax owed @ 24.0%
- −$724
- After-tax cash flow
- $5,416/yr
For passive investors: Depreciation is non-cash, so a rental often shows a tax loss while cash-flowing — sheltering income. Rental losses are passive: they offset passive income freely, and up to $25,000/yr can offset ordinary (W-2) income if you actively participate and your MAGI is under $100k (phasing out to $0 by $150k); unused losses carry forward. On sale, claimed depreciation is recaptured at up to 25%, and gains may owe capital-gains tax (a 1031 exchange can defer both). Figures are a year-1 estimate at your 24.0% rate — not tax advice; consult a CPA.
Schools (NCES district)
- District
- Moore County Schools
- NCES district ID
- 3703090
- Math proficiency
- 48% ▲ 5.00%
- Reading proficiency
- 54% ▲ 5.00%
- Median HH income
- $50,333
- Composite
- 43.63/100
- National rank
- #2967
- State rank
- #58 of 178 in NC
Livability — Vass
- Score
- 57/100
- State rank
- #593
- US rank
- #21646
Category grades
Schools grade is shown separately in the Schools card above.
Census & demographics
- County
- Moore County · 75,247 people
- City population
- 5,936
- Metro
- Pinehurst-Southern Pines, NC
- Population (ZIP)
- 5,936
- Household income
- $79,643
- Rent vs Own
- Severe rent burden
- 109.0
Population outlook (Moore County) Hauer SSP2
- Today (2025)
- 106,902 people
- By 2030
- 113,134 · +5.8%
- By 2040
- 125,682 · +17.6%
- By 2050
- 137,811 · +28.9%
- By 2075
- 164,387 · +53.8%
- By 2100
- 175,595 · +64.3%
Race, ethnicity, and origin ACS 2023
- Neighborhood character
- Predominantly White (74%)
- Race & ethnicity
- White 74% Two or more races 10% Black 9% Hispanic / Latino 8%
- Hispanic origin (detail)
- Mexican 2%
- Common ancestry
- Slovak 6% Italian 2% Romanian 1%
- Foreign-born
- 6% · Canada, Jamaica
- Languages at home
- 91% English-only · Spanish 6% Arabic 2%
Political lean MEDSL · Moore
- 2024 margin
- Strong R (+29.5) · D 34.8% · R 64.3%
- 2008→2024 swing
- -8.1pp toward R · 2008: -21.4pp · 2024: -29.5pp
- All cycles
- 2024: R+29.5 2020: R+27.4 2016: R+29.6 2012: R+28.1 2008: R+21.4
Not yet ingested
- Civics
- —
Market trends
- HPI YoY
- ▼ -106.99%
- Current HPI
- 160.0419
- Rent YoY
- —
- Metro
- Pinehurst-Southern Pines, NC
- State GDP YoY
- ▲ 3.28%
- F500 in state
- 26
Industry mix (Fortune 500 HQ in NC)
| Industry | F500 HQs | Revenue |
|---|---|---|
| Financial Services | 2 | $213B |
|
||
| Retail | 2 | $95B |
|
||
| Industrial Conglomerate | 1 | $38B |
|
||
| Metals / Steel | 1 | $35B |
|
||
| Utilities | 1 | $30B |
|
||
| Industrial Machinery | 1 | $19B |
|
||
Price history
+86.4% since first listed7 events — show timeline
- 2026-05-01 Listed $205,000 TMLS
- 2026-04-20 Listing Removed — Hive MLS
- 2026-04-20 Listing Removed — TMLS
- 2026-03-30 Price Changed $204,900 Hive MLS
- 2026-01-02 Listed $205,000 Hive MLS
- 2026-01-02 Listed $205,000 TMLS
- 2025-10-10 Sold (Public Records) $110,000 Public Records
Property tax history
+19.3%/yrLatest (2024): $749 · -4.4% YoY. Source: county tax records.
Cash-flow waterfall
monthlySold comps — $/sqft
last 12 mo · ≤1 miLoading sold comps…