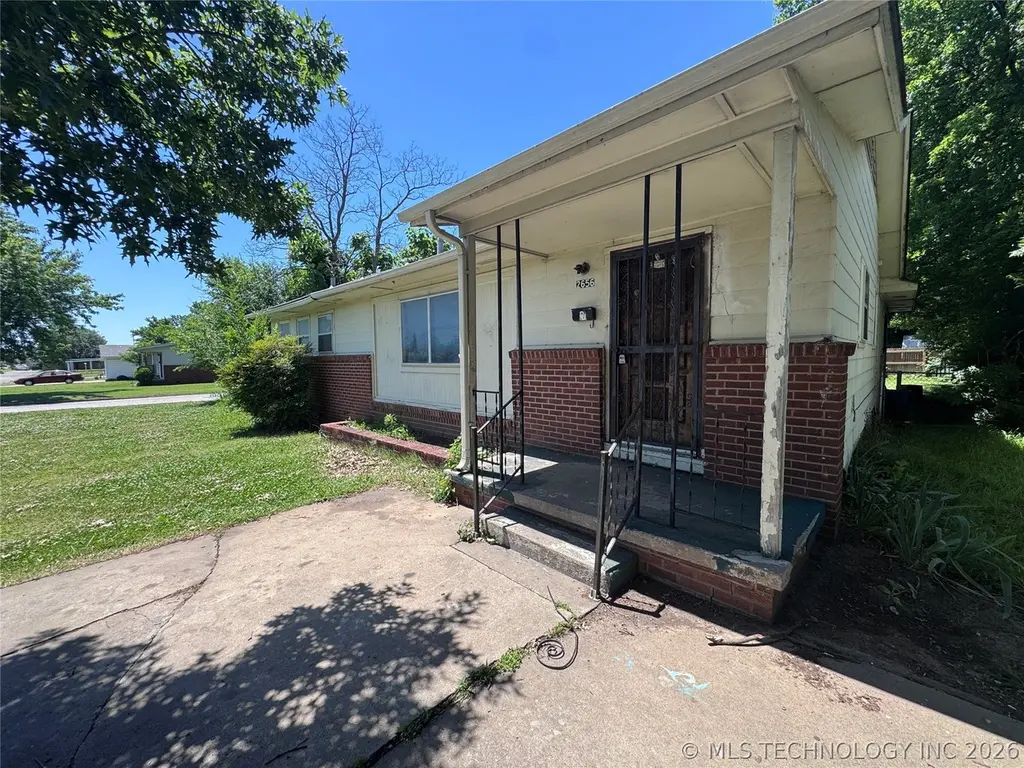
2656 S Sheridan Rd · Tulsa, OK
Flood risk 1/10 · Minimal
- FEMA flood zone
- X (unshaded)
- Chance of flooding over 30 yrs
- 0.0%
- Est. flood insurance / yr
- $507 – $1,088
Fire risk 1/10 · Minimal
- Est. fire insurance / yr
- $2,463 – $4,575
Heat risk 6/10 · Moderate
- Hot days now (above 110°F)
- 7 days/yr
- Hot days in 30 yrs
- 18 days/yr
Wind risk 2/10 · Minimal
- Chance of severe wind over 30 yrs
- 4.0%
Air-quality risk 2/10 · Minimal
- Unhealthy air days now
- 1 days/yr
- Unhealthy air days in 30 yrs
- 1 days/yr
Risk factors via First Street. Map © Google.
Why this score? — see what drove the B- grade
The composite is a weighted blend of 9 inputs, each scored 0–100. Each bar is that input's sub-score; the figure is the points it added to the 100-point composite (weight × sub-score).
- Cash flow +26.4/30.0
- ARV discount +15.0/15.0
- DSCR +9.0/10.0
- 1% rule +6.9/10.0
- Livability +3.8/5.0
- Rent growth +2.5/5.0
- Condition / age +2.5/5.0
- Schools +0.8/10.0
- Appreciation +0.0/10.0
$125,000
🖨 Deal sheet 📄 Offer letter ✓ Due diligence
Listing remarks
As-Is sale, fixer upper needing some love. Roof replaced 2019, Heater replaced 2025, AC replaced 2018, plumbing repaired 2018.
Key facts
- Ac replaced
- Heater replaced
- Plumbing repaired
Tags
Property features AI
Exterior
- Parking: Attached garage (1 car) with rear-facing garage
- Security: No safety shelter
- Utilities: Electricity available; Natural gas available; Phone service available; Public water; Public sewer
- Home design: Single-story home; Faces east; Crawlspace foundation
- Construction: Brick veneer and wood frame construction; Asphalt/fiberglass roof; Built according to public records
- Exterior features: Chain link fencing; Corner lot
Interior
- Kitchen: Oven; Range
- Flooring: Hardwood
- Bathrooms: 2 full bathrooms
- Heating & cooling: Central heating (gas); Central air conditioning
- Interior features: Hardwood flooring; No notable interior features reported
- Laundry & utility: Gas water heater
Neighborhood map
What this means for you Summary
Snapshot
- This is a 3-bed/1.0-bath single-family listed at $125k.
Deal economics
- At list price, monthly cash flow is $328 ($4k/yr) — positive.
- The deal already cash-flows at list — no discount required.
- Meets the 1% rule at list price ($1k rent vs $125k).
- Cap rate 9.4% vs local median 3.9% in Tulsa — top-decile yield for the area; either an underpriced asset or a hidden risk that comps aren't pricing in. Stress-test before assuming the spread holds.
Location & tenants
- Location reads 75/100 on livability (#13 in OK, #4,058 nationally) — a middle-class / working-renter tenant base. Strengths: amenities A+, commute A+, cost of living A+; Watch: schools F, crime F, employment D-.
- Tulsa (urban): math 7% / reading 12% proficiency, ranked #250 of 270 in OK (top 93%) — low school quality limits family demand, transient renter base, plan for 1-2y turnover; 76% free/reduced lunch — lower-income household profile, screen leases tightly.
- Market conditions: 71 active listings in the ZIP; 18 comparable units currently listed for rent nearby; rentals leasing fast (median 12d on market — plan ~1-2 weeks tenant-placement turnaround); 2,818 units permitted in Tulsa County in 2024 (518 in 5+ unit buildings).
Forward outlook
- Local home prices are declining (-3.0%/yr); year-one equity from $864 of loan paydown is wiped out by about $4k of value loss. Plan a longer hold.
- Tulsa County population projected at +30% by 2050 — long-run rental-demand tailwind backs the buy-and-hold thesis.
- At projected returns (-3.0% appreciation + 3.0% rent growth), your $35k cash investment doubles in ~10 years — after that, you're playing with house money.
Negotiation context
- Only 10 days on market — expect competitive offers; lowballing is unlikely to land.
- 6 sale attempts since 21y ago with the ask held roughly flat each time — persistent listings suggest the price (not the market) is what's stuck; bring a comps-based counter.
Risks & watch-outs
- Watch-outs: built in 1954 — expect roof / HVAC / electrical / plumbing capex.
- Climate carrying-cost: extreme-heat days projected 7→18/yr by 2055 (HVAC capex compounding) — expect insurance premiums to compound above CPI over the hold.
Questions for the listing agent
- Built in 1954 — when were the roof, HVAC, electrical panel, plumbing, and water heater last replaced?
- Is there a deadline driving the sale (1031 exchange, divorce, estate, relocation)? That informs how much negotiation room exists.
- Schools are F-rated, which usually means shorter tenancies and higher turnover. Who's the typical renter profile here, and what's been the actual vacancy rate?
- Crime grade is F in this area — have there been break-ins, vandalism, or insurance claims at this property in the last 3 years? What carrier currently insures it and at what premium?
- What's the average days-on-market for RENTAL listings here right now (not sales)? A rising rental-DOM trend means longer vacancies and softer asking-rent achievability than the comps imply.
- What's the recent tenant-quality profile in this submarket — average credit score on applications, eviction rate, late-payment / NSF rate, and stable-employment percentage? A property-management company in the area should have these aggregated.
- How much new for-sale + rental construction is in the pipeline within 1–3 miles? Heavy new supply typically softens prices + rents 12–24 months out; constrained supply supports both.
Investment metrics
- 1% rule
- 1.19% ✓
- Cap rate
- 9.44%
- Cash-on-cash
- 11.24%
- DSCR
- 1.50
- GRM
- 7.0
CMA / ARV
- ARV (on-the-fly)
- $234,741
- Comps found
- 12
Show comp detail 12 sales within ~0.75 mi
| Address | Dist | Beds/Ba | Sqft | Sold | Price | $/sf | Match |
|---|---|---|---|---|---|---|---|
| 6716 E 26th Ave | 0.35mi | 3/2.0 | 1,336 (-4%) | 1mo | $265,000 | $198 | 73 |
| 5369 E 28th St | 0.54mi | 3/2.0 | 1,394 (+0%) | 1mo | $235,000 | $169 | 69 |
| 5355 E 27th Pl | 0.58mi | 3/2.0 | 1,392 (+0%) | 0mo | $218,000 | $157 | 68 |
| 6716 E 27th Pl | 0.31mi | 3/1.5 | 1,264 (-9%) | 2mo | $167,000 | $132 | 67 |
| 5729 E 28th St | 0.41mi | 3/1.5 | 1,252 (-10%) | 1mo | $215,000 | $172 | 61 |
| 5378 E 30th Pl | 0.58mi | 3/2.0 | 1,450 (+4%) | 2mo | $173,000 | $119 | 60 |
| 7454 E 29th St | 0.71mi | 3/2.0 | 1,416 (+2%) | 0mo | $265,000 | $187 | 60 |
| 5428 E 24th Pl | 0.61mi | 3/1.5 | 1,310 (-6%) | 2mo | $250,000 | $191 | 59 |
| 7470 E 29th St | 0.74mi | 3/1.5 | 1,362 (-2%) | 2mo | $175,000 | $128 | 58 |
| 5328 E 27th St | 0.66mi | 3/2.0 | 1,332 (-4%) | 1mo | $274,800 | $206 | 58 |
| 5342 E 25th Pl | 0.65mi | 3/2.0 | 1,549 (+12%) | 2mo | $210,000 | $136 | 45 |
| 5406 E 25th St | 0.63mi | 3/2.0 | 1,580 (+14%) | 1mo | $190,000 | $120 | 43 |
Match score weights: distance 35% · size 25% · config 20% · recency 20%. Top-matched comps best support the ARV.
Projected returns pro-forma
-3.0% appreciation · 3.0% rent growth · sell at horizon
- IRR
- 0.5%
- Equity multiple
- 1.02×
- Total profit
- $637
- Equity at exit
- $18,638
- IRR
- 10.1%
- Equity multiple
- 1.79×
- Total profit
- $27,492
- Equity at exit
- $10,808
Cash invested: $35,000 (down + closing). Projections, not guarantees.
Landlord ↔ Tenant lean methodology
- Overall (STATE)
- 83 Strongly Landlord-Friendly
- State Oklahoma
- 83 Strongly Landlord-Friendly · R+20
- County
- — inherits STATE
- City
- — inherits STATE
ZIP-level market 74129
- Active inventory
- 71
- Price-to-rent
- 7.0×
Monthly cashflow live
- Estimated rent
- $1,488 high interval (Pro) →
- Mortgage (P&I)
- −$656
- Tax from tax record
- −$140 /mo · $1,679/yr
- Insurance
- −$52
- HOA
- −$0
- Vacancy / Maint / Mgmt
- −$312
- Net cashflow
- $328
Break-even live
UW: 25.0% down · 7.5% · 30yr · 1.5% tax · 5.0% vac · 8.0% maint · 8.0% mgmt
Financing live
Cash to close
- Down payment
- $31,250
- Closing costs
- $3,750
- Reserves months
- —
- Total cash needed
- —
Loan-product check · same deal, 3 products live
Conventional
25% down · 7.5% · 30yr
- Down + closing
- —
- Monthly P&I
- —
- Monthly cashflow
- —
- DSCR
- —
- Eligible?
- —
Personal DTI + credit; lowest rate.
DSCR
20% down · 8.5% · 30yr
- Down + closing
- —
- Monthly P&I
- —
- Monthly cashflow
- —
- DSCR
- —
- Eligible?
- —
No personal income docs; deal must DSCR.
Hard money
10% down · 12.0% · 12mo
- Down + closing
- —
- Monthly P&I
- —
- Monthly cashflow
- —
- DSCR
- —
- Eligible?
- —
Short-term bridge; refi at stabilization.
Rent comps 18 comps
| Address | Beds | Baths | Sqft | Rent | $/sqft | DOM | Units | Dist |
|---|---|---|---|---|---|---|---|---|
| 5905 E 30th St Tulsa, OK | 3.0 | 2.0 | 1210 | $1,550 | $1.28 | 3d | 1 | 0.27mi |
| 2923 S Irvington Ave Tulsa, OK | 4.0 | 2.5 | 1786 | $1,750 | $0.98 | 2d | 1 | 0.35mi |
| 5704 E 30th Pl Tulsa, OK | 3.0 | 1.0 | 1070 | $1,600 | $1.50 | 23d | 1 | 0.55mi |
| 3272 S Lakewood Ave Tulsa, OK | 1.0–2.0 | 1.0–1.5 | 841 | $1,250 | $1.49 | 16d | 12 | 0.58mi |
| 5714 E 33rd Ct Tulsa, OK | 2.0 | 2.0 | 1077 | $1,299 | $1.21 | 23d | 1 | 0.69mi |
| 3257 S Hudson Ave Unit 3257 Tulsa, OK | 2.0 | 2.0 | 1350 | $1,295 | $0.96 | 3d | 1 | 0.79mi |
| 5824 E 35th St Tulsa, OK | 2.0 | 1.0 | 1000 | $1,295 | $1.29 | 16d | 1 | 0.82mi |
| 6621 E 19th St Tulsa, OK | 1.0–2.0 | 1.0–2.0 | 800 | $1,050 | $1.31 | 16d | 4 | 0.86mi |
| 7610 E 21st Pl Tulsa, OK | 3.0 | 1.5 | 1136 | $1,695 | $1.49 | 3d | 1 | 0.91mi |
| 5301 E 32nd Pl Unit B Tulsa, OK | 2.0 | 1.5 | 1005 | $1,250 | $1.24 | 3d | 1 | 0.91mi |
| 7625 E 21st St Tulsa, OK | 1.0–3.0 | 1.0–1.5 | 775 | $1,075 | $1.39 | 16d | 6 | 1.02mi |
| 8323 E 24th St Tulsa, OK | 3.0 | 2.0 | 1300 | $1,350 | $1.04 | 2d | 1 | 1.20mi |
| 2425 S Sandusky Ave Tulsa, OK | 3.0 | 2.0 | 1017 | $1,495 | $1.47 | 11d | 1 | 1.28mi |
| 2425 S Sandusky Ave Tulsa, OK | 3.0 | 2.0 | 1017 | $1,495 | $1.47 | 21d | 1 | 1.28mi |
| 3519 S Sandusky Ave Tulsa, OK | 3.0 | 2.0 | 1547 | $1,750 | $1.13 | 23d | 1 | 1.46mi |
| 3519 S Sandusky Ave Tulsa, OK | 3.0 | 2.0 | 1547 | $1,750 | $1.13 | 11d | 1 | 1.46mi |
| 2535 S Pittsburg Ave Tulsa, OK | 3.0 | 2.0 | 1213 | $1,803 | $1.49 | 2d | 1 | 1.47mi |
| 4130 E 22nd Pl Tulsa, OK | 2.0 | 2.0 | 1255 | $1,550 | $1.24 | 3d | 1 | 1.48mi |
Listing history 17 events
-
2026-06-02status $125,000 Pending 10 DOM
-
2026-06-01days on market $125,000 Active 10 DOM
-
2026-05-31days on market $125,000 Active 9 DOM
-
2026-05-22$125,000 Active
-
2017-12-18soldstatus $205,000
-
2008-09-19historical
-
2008-03-20historical
-
2008-03-18$99,900
-
2007-09-19$106,034
-
2007-09-11historical
-
2007-03-15$106,000
-
2005-12-19soldstatus $71,000
-
2005-12-15soldstatus $71,000
-
2005-11-01historical
-
2005-09-02historical
-
2005-09-02$79,900
-
2005-06-27$89,000
ⓘ Source: listings_history table (triggers on properties + properties_extension) + one-shot
backfill from property_details.listing_events for pre-trigger history.
Tax reassessment forecast OK · Resets to sale price
- Current annual tax
- $1,679 · $140/mo
- Projected year-2 tax
- $1,679 · $140/mo
- Expected delta
- $0/yr ($0/mo · 0.0%)
ⓘ Screening estimate from a state-policy table — verify with the county assessor before closing.
Climate risk First Street
- Flood 1/10 Low FEMA zone X (unshaded) · 0% chance over 30 yrs
- Wildfire 1/10 Low
- Heat 6/10 Major 7 d/yr ≥110°F today · 18 d/yr by 30 yrs out
- Wind 2/10 Low 4% chance of damaging wind over 30 yrs
- Air quality 2/10 Low 1 unhealthy d/yr today · 1 by 30 yrs out
Nearby sold comps map
Loading sold comps map…
Walkable amenities ~0.75 mi
Loading nearby amenities…
Taxation est. · year 1
- Rental income
- $17,853
- − Mortgage interest
- −$7,002
- − Property taxes
- −$1,679
- − Insurance
- −$625
- − Repairs & maintenance
- −$1,428
- − Management
- −$1,428
- − Depreciation
- −$3,636
- Taxable income
- $2,055
- Est. tax owed @ 24.0%
- −$493
- After-tax cash flow
- $3,441/yr
For passive investors: Depreciation is non-cash, so a rental often shows a tax loss while cash-flowing — sheltering income. Rental losses are passive: they offset passive income freely, and up to $25,000/yr can offset ordinary (W-2) income if you actively participate and your MAGI is under $100k (phasing out to $0 by $150k); unused losses carry forward. On sale, claimed depreciation is recaptured at up to 25%, and gains may owe capital-gains tax (a 1031 exchange can defer both). Figures are a year-1 estimate at your 24.0% rate — not tax advice; consult a CPA.
Schools (NCES district)
- District
- Tulsa
- NCES district ID
- 4030240
- Math proficiency
- 7% ▼ -9.00%
- Reading proficiency
- 12% ▼ -7.00%
- Median HH income
- $37,895
- Composite
- 8.04/100
- National rank
- #9919
- State rank
- #250 of 270 in OK
Livability — Tulsa
- Score
- 75/100
- State rank
- #13
- US rank
- #4058
Category grades
Schools grade is shown separately in the Schools card above.
Census & demographics
- Census place
- Tulsa, OK
- City population
- 389,418
- Population (ZIP)
- 18,764
Population outlook (Tulsa County) Hauer SSP2
- Today (2025)
- 723,846 people
- By 2030
- 766,033 · +5.8%
- By 2040
- 851,386 · +17.6%
- By 2050
- 938,389 · +29.6%
- By 2075
- 1,166,011 · +61.1%
- By 2100
- 1,350,277 · +86.5%
Race, ethnicity, and origin ACS 2023
- Neighborhood character
- Highly diverse neighborhood (Simpson 0.71)
- Race & ethnicity
- White 38% Hispanic / Latino 34% Two or more races 18% Black 17% Native American 4% Asian 2%
- Hispanic origin (detail)
- Mexican 25%
- Common ancestry
- Italian 1% Slovak 1% Lithuanian 1%
- Foreign-born
- 19% · Canada, Vietnam
- Languages at home
- 67% English-only · Spanish 30% Other Asian/Pacific 1% Vietnamese 1%
Political lean MEDSL · Tulsa
- 2024 margin
- R (+15.2) · D 41.3% · R 56.5% · Other 2.2%
- 2008→2024 swing
- +9.2pp toward D · 2008: -24.5pp · 2024: -15.2pp
- All cycles
- 2024: R+15.2 2020: R+15.6 2016: R+22.9 2012: R+27.4 2008: R+24.5
Not yet ingested
- Civics
- —
Market trends
- HPI YoY
- ▼ -169.31%
- Current HPI
- 247.8904
- Rent YoY
- —
- Metro
- —
- State GDP YoY
- ▲ 1.55%
- F500 in state
- 6
Industry mix (Fortune 500 HQ in OK)
| Industry | F500 HQs | Revenue |
|---|---|---|
| Energy | 3 | $48B |
|
||
Price history
+40.4% since first listed14 events — show timeline
- 2026-05-22 Listed $125,000 MLS Technology, Inc.
- 2017-12-18 Sold (Public Records) $205,000 Public Records
- 2008-09-19 Listing Removed — MLS Technology, Inc.
- 2008-03-20 Listing Removed — MLS Technology, Inc.
- 2008-03-18 Listed $99,900 MLS Technology, Inc.
- 2007-09-19 Listed $106,034 MLS Technology, Inc.
- 2007-09-11 Listing Removed — MLS Technology, Inc.
- 2007-03-15 Listed $106,000 MLS Technology, Inc.
- 2005-12-19 Sold (Public Records) $71,000 Public Records
- 2005-12-15 Sold (MLS) $71,000 MLS Technology, Inc.
- 2005-11-01 Listing Removed — MLS Technology, Inc.
- 2005-09-02 Listed $79,900 MLS Technology, Inc.
- 2005-09-02 Listing Removed — MLS Technology, Inc.
- 2005-06-27 Listed $89,000 MLS Technology, Inc.
Property tax history
+2.7%/yrLatest (2025): $1,679 · +8.7% YoY. Source: county tax records.
Cash-flow waterfall
monthlySold comps — $/sqft
last 12 mo · ≤1 miLoading sold comps…