 Duplex
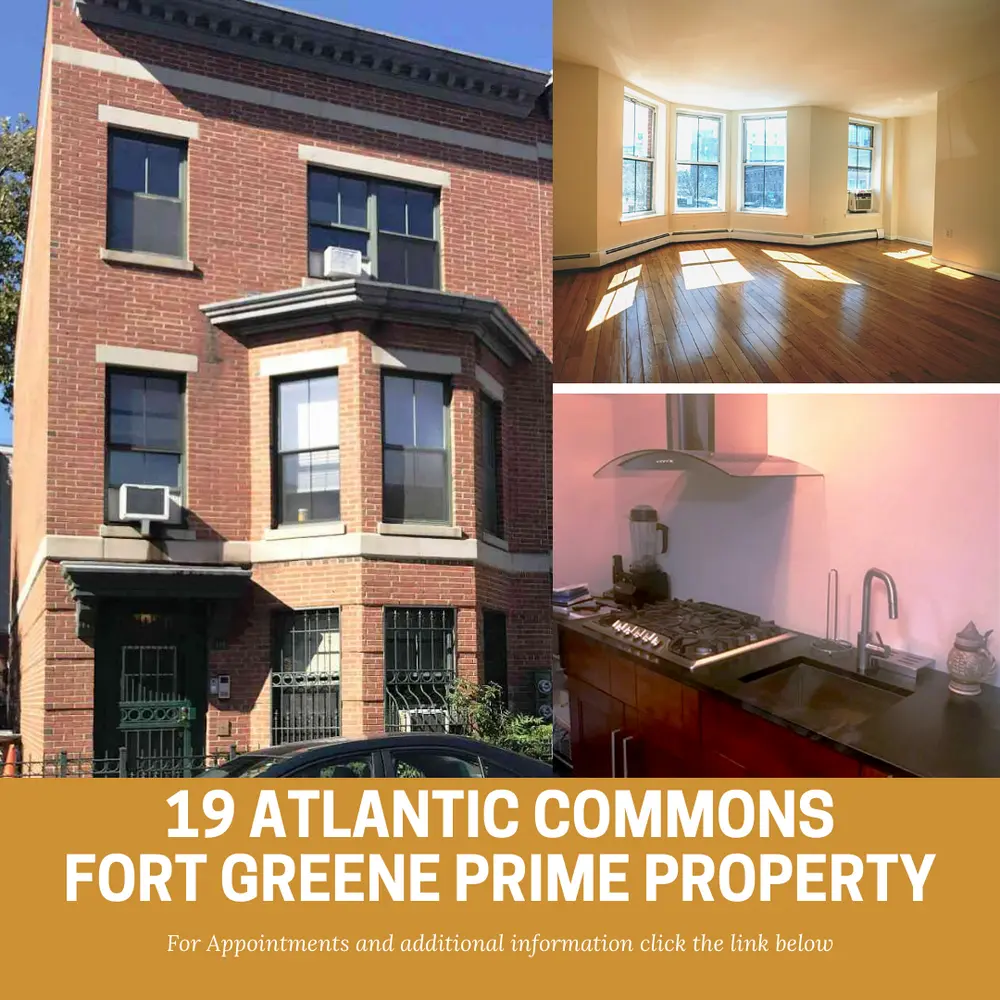
19 Atlantic Ave · New York, NY
Flood risk 1/10 · Minimal
- FEMA flood zone
- X (unshaded)
- Chance of flooding over 30 yrs
- 0.0%
- Est. flood insurance / yr
- $507 – $1,088
Fire risk 1/10 · Minimal
- Est. fire insurance / yr
- $691 – $1,283
Heat risk 7/10 · Major
- Hot days now (above 99°F)
- 7 days/yr
- Hot days in 30 yrs
- 15 days/yr
Wind risk 6/10 · Moderate
- Chance of severe wind over 30 yrs
- 27.0%
Air-quality risk 4/10 · Minor
- Unhealthy air days now
- 5 days/yr
- Unhealthy air days in 30 yrs
- 7 days/yr
Risk factors via First Street. Map © Google.
Why this score? — see what drove the D grade
The composite is a weighted blend of 9 inputs, each scored 0–100. Each bar is that input's sub-score; the figure is the points it added to the 100-point composite (weight × sub-score).
- Appreciation +10.0/10.0
- Cash flow +7.5/30.0
- ARV discount +7.5/15.0
- Schools +5.0/10.0
- Rent growth +4.2/5.0
- Livability +3.8/5.0
- Condition / age +2.5/5.0
- DSCR +1.7/10.0
- 1% rule +1.1/10.0
$2,699,999
🖨 Deal sheet (PDF) 📄 Offer letter ✓ Due diligence
Multi-family units
County records classify this as Multi-Family (2-4 Unit). Listing-text estimate: 2 units. confirmed
Listing remarks
This three family brick townhouse is located on a quiet, tree-lined block in Fort Greene area of Brooklyn, New York. The second and third floor apartments are floor through, true, two bedrooms with ample sun light and overlooks an ornately wooded park and tennis courts. Tucked away between Hanson Place and Atlantic Avenue, this modern construction offers double pane windows to help keep the interior quiet. There are hardwood floors, new appliances including dishwasher, and ample storage space with two walk in closets. The first floor apartment commonly called the owners duplex has two bedrooms on the first floor and one bedroom on the second floor; washer/dryer; two kitchens and full bathro
Key facts
- 3,860 sq ft lot
- Built 1995
Property features AI
Exterior
- Home design: Multi-family property
- Construction: Living area approximately 2,980 sq ft
- Exterior features: Lot of approximately 3,860 sq ft
Interior
- Bedrooms: Multiple bedrooms (part of multi-family property)
- Interior features: Multi-family interior layout
Neighborhood map
What this means for you Summary
Snapshot
- This is a 2 × 4-bed/2.0-bath units multifamily listed at $2.70M.
Deal economics
- At list price, monthly cash flow is $-3k ($-40k/yr) — negative. Per door: $-2k/mo.
- To cash-flow at today's rent, offer at most $2.12M (21.6% below list).
- To meet the 1% rule (rent ≥ 1% of price), the offer needs to be $1.64M (39.1% below list).
- Recommended offer: $1.64M (39.1% below list) — sets the bar for 1% rule.
- Cap rate 4.8% vs local median 2.6% in New York — top-decile yield for the area; either an underpriced asset or a hidden risk that comps aren't pricing in. Stress-test before assuming the spread holds.
Location & tenants
- Location reads 75/100 on livability (#268 in NY, #4,188 nationally) — a middle-class / working-renter tenant base. Strengths: amenities A+, commute A+, health & safety A; Watch: crime F, cost of living F.
- Zoned schools: Ps 11 Purvis J Behan (math 82% / reading 87%, grade A+, #93 of 2,108 statewide, top 6%, 832 students, 37% FRL); Jhs 383 Philippa Schuyler (math 32% / reading 67%, grade C, #280 of 729 statewide, top 40%, 822 students, 85% FRL); Midwood High School (math 94% / reading 96%, grade A+, #83 of 1,100 statewide, top 8%, 4,062 students, 73% FRL).
- Market conditions: Rents rising fast (+6.7%/yr); 127 active listings in the ZIP; high-income renter base; 10,063 units permitted in Kings County in 2024 (9,789 in 5+ unit buildings).
- At $16,431/mo this rent would consume 121% of the median local household income ($163k/yr) (locally 2688% of renters already pay >50% of income on rent) — very limited rent-growth headroom before tenants either downsize or default.
Forward outlook
- In year one you build about $289k of equity ($19k loan paydown + $270k appreciation (10.0% local appreciation)).
- Kings County population projected at +13% by 2050 — modest demand growth; plan on rents tracking national, not racing it.
- By year 2, paydown + projected appreciation supports a ~$464k cash-out refi (75% LTV) — recoverable capital for the next deal without selling this one.
Negotiation context
- Only 0 days on market — expect competitive offers; lowballing is unlikely to land.
- 2 sale attempts with the ask held roughly flat each time — persistent listings suggest the price (not the market) is what's stuck; bring a comps-based counter.
Risks & watch-outs
- Climate carrying-cost: major wind risk, 27% chance of damaging wind over 30y; extreme-heat days projected 7→15/yr by 2055 (HVAC capex compounding) — expect insurance premiums to compound above CPI over the hold.
Questions for the listing agent
- What do current leases actually rent for vs. the listed asking? Can we see a recent rent roll and the last 12 months of T-12 income?
- Can we see the unit-by-unit rent roll, current vacancy, and any below-market leases? What's the average tenancy length?
- What capital expenditures (roof, boiler, parking lot, exteriors) have been made in the last 5 years, and what's planned in the next 2?
- Is there a deadline driving the sale (1031 exchange, divorce, estate, relocation)? That informs how much negotiation room exists.
- Schools are B-rated — typically a magnet for longer-tenancy family renters. What's the average tenant stay here, and is there a school-zone premium baked into asking?
- Crime grade is F in this area — have there been break-ins, vandalism, or insurance claims at this property in the last 3 years? What carrier currently insures it and at what premium?
- The area grade is low — what's the realistic commute time and amenity access for the typical tenant pool here? Any planned neighborhood developments (good or bad) we should know about?
- What's the average days-on-market for RENTAL listings here right now (not sales)? A rising rental-DOM trend means longer vacancies and softer asking-rent achievability than the comps imply.
- What's the recent tenant-quality profile in this submarket — average credit score on applications, eviction rate, late-payment / NSF rate, and stable-employment percentage? A property-management company in the area should have these aggregated.
- How much new apartment / multifamily construction is in the pipeline within 1–3 miles? Heavy new supply (>2% of stock underway) typically softens rents 12–24 months out; light construction supports rent growth.
Investment metrics
- 1% rule
- 0.61% ✗
- Cap rate
- 4.83%
- Cash-on-cash
- -5.24%
- DSCR
- 0.77
- GRM
- 13.7
CMA / ARV
No comps found within radius.
Projected returns pro-forma
10.0% appreciation · 6.7% rent growth · sell at horizon
- IRR
- 21.4%
- Equity multiple
- 2.75×
- Total profit
- $1,322,508
- Equity at exit
- $2,432,373
- IRR
- 20.1%
- Equity multiple
- 6.56×
- Total profit
- $4,206,837
- Equity at exit
- $5,245,504
Cash invested: $756,000 (down + closing). Projections, not guarantees.
Landlord ↔ Tenant lean methodology
- Overall (CITY)
- 0 Strongly Tenant-Friendly
- State New York
- 15 Strongly Tenant-Friendly · D+10
- County
- — inherits STATE
- City New York
- 0 Strongly Tenant-Friendly · D+34
ZIP-level market 11217
- Home prices YoY
- 2.5%
- Rents YoY
- 6.7%
- Active inventory
- 127
- Price-to-rent
- 27.4×
Monthly cashflow live
- Estimated rent
- $16,431 high interval (Pro) →
- Mortgage (P&I)
- −$14,159
- Tax from tax record
- −$997 /mo · $11,963/yr
- Insurance
- −$1,125
- HOA
- −$0
- Vacancy / Maint / Mgmt
- −$3,451
- Net cashflow
- $-3,300
Break-even live
Sensitivity live
| Price | -10% $-1,772 | -5% $-2,536 | +0% $-3,300 | +5% $-4,065 | +10% $-4,829 |
|---|---|---|---|---|---|
| Rent | -10% $-4,599 | -5% $-3,949 | +0% $-3,300 | +5% $-2,651 | +10% $-2,002 |
| Rate | -1.0pp $-1,941 | -0.5pp $-2,614 | base $-3,300 | +0.5pp $-4,000 | +1.0pp $-4,712 |
2-unit breakdown (identical units grouped — click to expand)
| Units | Beds | Baths | Est. rent |
|---|---|---|---|
| 2× units | 4 | 2 | $16,432 |
| #1 | 4 | 2 | $8,216 |
| #2 | 4 | 2 | $8,216 |
| Total (2 units) | $16,431 | ||
UW: 25.0% down · 7.5% · 30yr · 1.5% tax · 5.0% vac · 8.0% maint · 8.0% mgmt
Financing live
Cash to close
- Down payment
- $675,000
- Closing costs
- $81,000
- Reserves months
- —
- Total cash needed
- —
Loan-product check · same deal, 3 products live
Conventional
25% down · 7.5% · 30yr
- Down + closing
- —
- Monthly P&I
- —
- Monthly cashflow
- —
- DSCR
- —
- Eligible?
- —
Personal DTI + credit; lowest rate.
DSCR
20% down · 8.5% · 30yr
- Down + closing
- —
- Monthly P&I
- —
- Monthly cashflow
- —
- DSCR
- —
- Eligible?
- —
No personal income docs; deal must DSCR.
Hard money
10% down · 12.0% · 12mo
- Down + closing
- —
- Monthly P&I
- —
- Monthly cashflow
- —
- DSCR
- —
- Eligible?
- —
Short-term bridge; refi at stabilization.
Listing history 3 events
-
2025-10-10Under Contract
-
2025-10-10$2,699,999
-
2023-04-12soldstatus $2,450,000
ⓘ Source: listings_history table (triggers on properties + properties_extension) + one-shot
backfill from property_details.listing_events for pre-trigger history.
Tax reassessment forecast NY · Partial reset (capped growth)
- Current annual tax
- $11,963 · $997/mo
- Projected year-2 tax
- $28,796 · $2,400/mo
- Expected delta
- +$16,834/yr (+$1,403/mo · 140.7%)
ⓘ Screening estimate from a state-policy table — verify with the county assessor before closing.
Climate risk First Street
- Flood 1/10 Low FEMA zone X (unshaded) · 0% chance over 30 yrs
- Wildfire 1/10 Low
- Heat 7/10 Severe 7 d/yr ≥99°F today · 15 d/yr by 30 yrs out
- Wind 6/10 Major 27% chance of damaging wind over 30 yrs
- Air quality 4/10 Moderate 5 unhealthy d/yr today · 7 by 30 yrs out
Nearby sold comps map
Loading sold comps map…
Walkable amenities ~0.75 mi
Loading nearby amenities…
Taxation est. · year 1
- Rental income
- $197,172
- − Mortgage interest
- −$151,242
- − Property taxes
- −$11,963
- − Insurance
- −$13,500
- − Repairs & maintenance
- −$15,774
- − Management
- −$15,774
- − Depreciation
- −$78,545
- Taxable loss
- −$89,625
- Est. tax savings @ 24.0%
- +$21,510
- After-tax cash flow
- $-18,096/yr
For passive investors: Depreciation is non-cash, so a rental often shows a tax loss while cash-flowing — sheltering income. Rental losses are passive: they offset passive income freely, and up to $25,000/yr can offset ordinary (W-2) income if you actively participate and your MAGI is under $100k (phasing out to $0 by $150k); unused losses carry forward. On sale, claimed depreciation is recaptured at up to 25%, and gains may owe capital-gains tax (a 1031 exchange can defer both). Figures are a year-1 estimate at your 24.0% rate — not tax advice; consult a CPA.
Schools (NCES district)
No district data.
Livability — New York
- Score
- 75/100
- State rank
- #268
- US rank
- #4188
Category grades
Schools grade is shown separately in the Schools card above.
Census & demographics
- Census place
- New York, NY
- County
- Kings County · 2,614,986 people
- City population
- 7,731,280
- Metro
- New York-Newark-Jersey City, NY-NJ-PA
- Population (ZIP)
- 43,490
- Household income
- $162,863
- Rent vs Own
- Severe rent burden
- 2688.0
Population outlook (Kings County) Hauer SSP2
- Today (2025)
- 2,847,441 people
- By 2030
- 2,937,006 · +3.1%
- By 2040
- 3,095,491 · +8.7%
- By 2050
- 3,228,968 · +13.4%
- By 2075
- 3,321,723 · +16.7%
- By 2100
- 3,111,387 · +9.3%
Race, ethnicity, and origin ACS 2023
- Neighborhood character
- Diverse neighborhood (Simpson 0.69)
- Race & ethnicity
- White 50% Black 16% Hispanic / Latino 16% Two or more races 15% Asian 9%
- Hispanic origin (detail)
- Mexican 2% Puerto Rican 7% Dominican 1%
- Common ancestry
- Romanian 3% Lithuanian 2% Scotch-Irish 2%
- Foreign-born
- 19% · Canada, China, South Korea
- Languages at home
- 74% English-only · Spanish 11% French/Haitian/Cajun 4% Other Indo-European 3%
Political lean MEDSL · Kings
- 2024 margin
- Solid D (+44.0) · D 72.0% · R 28.0%
- 2008→2024 swing
- -15.5pp toward R · 2008: 59.4pp · 2024: 44.0pp
- All cycles
- 2024: D+44.0 2020: D+54.8 2016: D+61.8 2012: D+63.9 2008: D+59.4
Not yet ingested
- Civics
- —
Market trends
- HPI YoY
- ▲ 11.76%
- Current HPI
- 491.2658
- Rent YoY
- ▲ 6.70%
- Metro
- New York-Newark-Jersey City, NY-NJ-PA
- State GDP YoY
- ▲ 2.60%
- F500 in state
- 92
Industry mix (Fortune 500 HQ in NY)
| Industry | F500 HQs | Revenue |
|---|---|---|
| Financial Services | 10 | $950B |
|
||
| Consumer Goods | 9 | $162B |
|
||
| Insurance | 4 | $225B |
|
||
| Telecommunications | 2 | $144B |
|
||
| Pharmaceuticals | 2 | $112B |
|
||
| Media / Entertainment | 2 | $69B |
|
||
Price history
+10.2% since first listed3 events — show timeline
- 2025-10-10 Listed $2,699,999 ForSaleByOwner.com
- 2025-10-10 Listed — ForSaleByOwner.com
- 2023-04-12 Sold (Public Records) $2,450,000 Public Records
Property tax history
+22.3%/yrLatest (2025): $11,963 · -1.7% YoY. Source: county tax records.
Cash-flow waterfall
monthlySold comps — $/sqft
last 12 mo · ≤1 miLoading sold comps…