 🔨 Auction
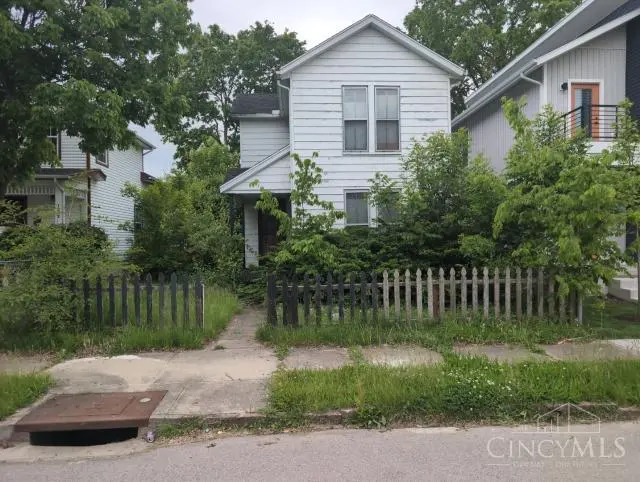
1236 W First St · Dayton, OH
Flood risk 7/10 · Major
- FEMA flood zone
- X (unshaded)
- Chance of flooding over 30 yrs
- 0.75%
- Est. flood insurance / yr
- $473 – $860
Fire risk 1/10 · Minimal
- Est. fire insurance / yr
- $713 – $1,323
Heat risk 4/10 · Minor
- Hot days now (above 102°F)
- 7 days/yr
- Hot days in 30 yrs
- 18 days/yr
Wind risk 2/10 · Minimal
- Chance of severe wind over 30 yrs
- 0.0%
Air-quality risk 3/10 · Minor
- Unhealthy air days now
- 2 days/yr
- Unhealthy air days in 30 yrs
- 4 days/yr
Risk factors via First Street. Map © Google.
Why this score? — see what drove the B- grade
The composite is a weighted blend of 9 inputs, each scored 0–100. Each bar is that input's sub-score; the figure is the points it added to the 100-point composite (weight × sub-score).
- Cash flow +30.0/30.0
- 1% rule +10.0/10.0
- DSCR +10.0/10.0
- ARV discount +7.5/15.0
- Rent growth +3.5/5.0
- Livability +3.2/5.0
- Condition / age +2.5/5.0
- Schools +1.3/10.0
- Appreciation +0.0/10.0
$1
🖨 Deal sheet (PDF) 📄 Offer letter ✓ Due diligence
Listing remarks
Court Ordered Sale by Private Selling Officer. Auction ends on June 17, 2026. All information we have on the property is included. We have no additional information, property condition is unknown. NO SHOWINGS, NO trespassing for any reason. Information is thought to be correct but not guaranteed. 10% Buyer Premium added to the high bid, $5,000 deposit is due within 24 hours of bidding end.
Key facts
- 4,883 sq ft lot
- Built 1890
- Listed 26 days
Property features AI
Finance
- Other: Semi-annual taxes listed (amount omitted per instructions); Tax abatement: No
- Financial info: Lease not considered
- HOA & community: No HOA
Exterior
- Utilities: Public water; Public sewer; Natural gas; Other water heating
- Home design: Traditional style single-family home; Two levels; Poured foundation
- Construction: Aluminum siding
- Exterior features: Shingle roof; Aluminum windows
Interior
- Kitchen: Kitchen area approximately 10 x 10; Dining room on level 1 approximately 9 x 9
- Bedrooms: 3 bedrooms; Primary bedroom on level 1 measuring approximately 10 x 10; Bedroom 2 on level 2 measuring approximately 10 x 10; Bedroom 3 on level 2 measuring approximately 10 x 10
- Bathrooms: 1 full bathroom; Primary bathroom with shower
- Heating & cooling: Forced air heating
- Interior features: 7 total rooms; Partial basement
Neighborhood map
What this means for you Summary
Snapshot
- This is a 3-bed/1.0-bath single-family listed at $1.
Deal economics
- At list price, monthly cash flow is $448 ($5k/yr) — positive.
- The deal already cash-flows at list — no discount required.
- Meets the 1% rule at list price ($1k rent vs $1).
- Cap rate 14.0% vs local median 7.3% in Dayton — top-decile yield for the area; either an underpriced asset or a hidden risk that comps aren't pricing in. Stress-test before assuming the spread holds.
Location & tenants
- Location reads 65/100 on livability (#716 in OH) — a middle-class / working-renter tenant base. Strengths: cost of living A+, housing A+, health & safety A; Watch: amenities C-, crime F, commute F.
- Dayton City (urban): math 12% / reading 21% proficiency, ranked #641 of 656 in OH (top 98%) — low school quality limits family demand, transient renter base, plan for 1-2y turnover; 74% free/reduced lunch — lower-income household profile, screen leases tightly.
- Zoned schools: River'S Edge Montessori Elementary School (math 22% / reading 32%, grade F, #1,193 of 1,584 statewide, top 76%, 494 students, 0% FRL); Wogaman Middle School (math 8% / reading 12%, grade F, #645 of 654 statewide, top 99%, 364 students, 0% FRL); Belmont High School (math 5% / reading 20%, grade F, #720 of 781 statewide, top 93%, 1,100 students, 0% FRL) — zoned schools average 0% FRL vs 74% district-wide (74 pts lower); this property's tenant base skews higher-income than the district average.
- Market conditions: Rents rising (+4.0%/yr); 87 active listings in the ZIP; 40 comparable units currently listed for rent nearby; rentals at typical pace (median 26d on market — plan ~3-4 weeks tenant-placement turnaround); 48% of comp listings sitting > 30 days — soft ceiling on asking rent; 907 units permitted in Montgomery County in 2024 (416 in 5+ unit buildings).
- This rent runs 33% of the median local income ($48k/yr) — at the standard rent-burdened threshold; future hikes will face affordability resistance.
Forward outlook
- Local home prices are declining (-3.0%/yr); year-one equity from $545 of loan paydown is wiped out by about $2k of value loss. Plan a longer hold.
- Montgomery County population projected at -10% by 2050 — secular population decline; favor cash flow + early exit over multi-decade hold.
- At projected returns (-3.0% appreciation + 4.0% rent growth), your $22k cash investment doubles in ~5 years — after that, you're playing with house money.
Negotiation context
- It's been on market 26 days — a 2% lower offer ($0) is reasonable based on typical stale-listing flexibility.
Risks & watch-outs
- Watch-outs: property tax is 118228.5% of price; flood insurance adds $56/mo; built in 1890 — expect roof / HVAC / electrical / plumbing capex.
- Climate carrying-cost: major flood risk — expect insurance premiums to compound above CPI over the hold.
Questions for the listing agent
- Built in 1890 — when were the roof, HVAC, electrical panel, plumbing, and water heater last replaced?
- Property tax is high relative to price — has the assessment been appealed recently, and will the sale trigger a re-assessment?
- What's the actual annual flood-insurance premium (NFIP or private), and is the property in a SFHA with mandatory coverage?
- Is there a deadline driving the sale (1031 exchange, divorce, estate, relocation)? That informs how much negotiation room exists.
- Crime grade is F in this area — have there been break-ins, vandalism, or insurance claims at this property in the last 3 years? What carrier currently insures it and at what premium?
- What's the average days-on-market for RENTAL listings here right now (not sales)? A rising rental-DOM trend means longer vacancies and softer asking-rent achievability than the comps imply.
- What's the recent tenant-quality profile in this submarket — average credit score on applications, eviction rate, late-payment / NSF rate, and stable-employment percentage? A property-management company in the area should have these aggregated.
- How much new for-sale + rental construction is in the pipeline within 1–3 miles? Heavy new supply typically softens prices + rents 12–24 months out; constrained supply supports both.
Investment metrics
- 1% rule
- 1.68% ✓
- Cap rate
- 13.95%
- Cash-on-cash
- 27.36%
- DSCR
- 2.22
- GRM
- 5.0
CMA / ARV
- ARV (on-the-fly)
- $78,819
- Comps found
- 12
Show comp detail 12 sales within ~0.75 mi
| Address | Dist | Beds/Ba | Sqft | Sold | Price | $/sf | Match |
|---|---|---|---|---|---|---|---|
| 445 Dakota St | 0.16mi | 4/1.5 (+1) | 1,700 (+1%) | 5mo | $38,200 | $22 | 79 |
| 37 Mound St | 0.25mi | 3/1.5 | 1,728 (+3%) | 5mo | $269,900 | $156 | 77 |
| 1151 W Second St | 0.10mi | 3/1.0 | 1,563 (-7%) | 9mo | $19,030 | $12 | 76 |
| 132 Mound St | 0.36mi | 3/2.5 | 1,592 (-5%) | 2mo | $135,000 | $85 | 67 |
| 40 Dayton Ave | 0.39mi | 3/1.0 | 1,610 (-4%) | 14mo | $60,000 | $37 | 63 |
| 63 Mound St | 0.28mi | 3/3.0 | 1,848 (+10%) | 5mo | $170,000 | $92 | 58 |
| 423 S Broadway St | 0.53mi | 3/1.0 | 1,816 (+8%) | 5mo | $25,000 | $14 | 57 |
| 302 Lexington Ave | 0.74mi | 4/1.5 (+1) | 1,658 (-1%) | 10mo | $70,000 | $42 | 49 |
| 26 Hawthorn St | 0.29mi | 3/2.5 | 1,820 (+8%) | 22mo | $250,000 | $137 | 48 |
| 1540 W 2nd St | 0.39mi | 4/2.0 (+1) | 1,456 (-13%) | 8mo | $145,000 | $100 | 45 |
| 1331 W Grand Ave | 0.72mi | 4/1.5 (+1) | 1,816 (+8%) | 9mo | $40,000 | $22 | 38 |
| 47 Leroy St | 0.73mi | 3/1.0 | 1,456 (-13%) | 9mo | $68,000 | $47 | 37 |
Match score weights: distance 35% · size 25% · config 20% · recency 20%. Top-matched comps best support the ARV.
Projected returns pro-forma
-3.0% appreciation · 3.98% rent growth · sell at horizon
- IRR
- 18.9%
- Equity multiple
- 1.78×
- Total profit
- $17,112
- Equity at exit
- $11,752
- IRR
- 27.9%
- Equity multiple
- 3.60×
- Total profit
- $57,359
- Equity at exit
- $6,815
Cash invested: $22,069 (down + closing). Projections, not guarantees.
Landlord ↔ Tenant lean methodology
- Overall (STATE)
- 73 Landlord-Friendly
- State Ohio
- 73 Landlord-Friendly · R+6
- County
- — inherits STATE
- City
- — inherits STATE
ZIP-level market 45402
- Rents YoY
- 4.0%
- Active inventory
- 87
Monthly cashflow live
- Estimated rent
- $1,326 high interval (Pro) →
- Mortgage (P&I)
- −$413
- Tax est. 1.5%
- −$99 /mo · $1,182/yr
- Insurance
- −$33
- Flood insurance flood zone
- −$56 /mo · $666/yr
- HOA
- −$0
- Lot rent
- −$0
- Vacancy / Maint / Mgmt
- −$279
- Net cashflow
- $448
Break-even live
Sensitivity live
| Price | -10% $502 | -5% $475 | +0% $448 | +5% $420 | +10% $393 |
|---|---|---|---|---|---|
| Rent | -10% $343 | -5% $395 | +0% $448 | +5% $500 | +10% $552 |
| Rate | -1.0pp $487 | -0.5pp $468 | base $448 | +0.5pp $427 | +1.0pp $406 |
UW: 25.0% down · 7.5% · 30yr · 1.5% tax · 5.0% vac · 8.0% maint · 8.0% mgmt
Financing live
Cash to close
- Down payment
- $19,705
- Closing costs
- $2,365
- Reserves months
- —
- Total cash needed
- —
Loan-product check · same deal, 3 products live
Conventional
25% down · 7.5% · 30yr
- Down + closing
- —
- Monthly P&I
- —
- Monthly cashflow
- —
- DSCR
- —
- Eligible?
- —
Personal DTI + credit; lowest rate.
DSCR
20% down · 8.5% · 30yr
- Down + closing
- —
- Monthly P&I
- —
- Monthly cashflow
- —
- DSCR
- —
- Eligible?
- —
No personal income docs; deal must DSCR.
Hard money
10% down · 12.0% · 12mo
- Down + closing
- —
- Monthly P&I
- —
- Monthly cashflow
- —
- DSCR
- —
- Eligible?
- —
Short-term bridge; refi at stabilization.
Rent comps 40 comps
| Address | Beds | Baths | Sqft | Rent | $/sqft | DOM | Units | Dist |
|---|---|---|---|---|---|---|---|---|
| 127 Mound St Dayton, OH | 3.0 | 3.0 | 1726 | $1,600 | $0.93 | 16d | 1 | 0.34mi |
| 848 Riverview Ter Apt 607 Dayton, OH | 2.0 | 1.0 | 1400 | $1,300 | $0.93 | 25d | 1 | 0.42mi |
| 848 Riverview Ter Apt 205 Dayton, OH | 2.0 | 1.0 | 1100 | $1,100 | $1.00 | 16d | 1 | 0.42mi |
| 18 Holt St Unit 24 Dayton, OH | 3.0 | 2.5 | 1350 | $1,450 | $1.07 | 16d | 1 | 0.48mi |
| See individual Unit addresses Dayton, OH | 1.0–2.0 | 1.0–2.0 | 928 | $2,297 | $2.48 | 46d | 10 | 0.51mi |
| 1011 N Broadway St Dayton, OH | 3.0 | 1.5 | 1700 | $950 | $0.56 | 46d | 1 | 0.66mi |
| 1119 Superior Ave Unit 1119 Dayton, OH | 3.0 | 1.0 | 1435 | $1,350 | $0.94 | 5d | 1 | 0.68mi |
| 47 Leroy St Dayton, OH | 3.0 | 1.0 | 1456 | $1,200 | $0.82 | 46d | 1 | 0.73mi |
| 424 Lexington Ave Dayton, OH | 3.0 | 2.0 | 1536 | $1,025 | $0.67 | 46d | 1 | 0.78mi |
| 515 W Grand Ave Dayton, OH | 2.0 | 2.0 | 1100 | $1,025 | $0.93 | 25d | 1 | 0.85mi |
| 515 W Grand Ave Dayton, OH | 2.0 | 2.0 | 1100 | $1,025 | $0.93 | 5d | 1 | 0.85mi |
| 515 W Grand Ave Dayton, OH | 2.0 | 2.0 | 1100 | $1,025 | $0.93 | 46d | 1 | 0.85mi |
| 40 S Mathison St Dayton, OH | 3.0 | 1.0 | 1300 | $1,200 | $0.92 | 16d | 1 | 0.86mi |
| 42 S Mathison St Dayton, OH | 3.0 | 1.0 | 1300 | $1,220 | $0.94 | 5d | 1 | 0.86mi |
| 905 Neal Ave Dayton, OH | 3.0 | 1.0 | 1100 | $850 | $0.77 | 46d | 1 | 0.89mi |
| 132 Wroe Ave Unit 132 Dayton, OH | 3.0 | 2.5 | 1934 | $1,297 | $0.67 | 46d | 1 | 0.98mi |
| 942 Harvard Blvd Dayton, OH | 3.0 | 2.0 | 1596 | $1,200 | $0.75 | 5d | 1 | 1.00mi |
| 115 W Monument Ave Dayton, OH | 1.0–2.0 | 1.0–2.5 | 1053 | $2,199 | $2.09 | 5d | 20 | 1.00mi |
| 136 Rockwood Ave Dayton, OH | 3.0 | 1.5 | 1439 | $1,200 | $0.83 | 46d | 1 | 1.04mi |
| 138 Rockwood Ave Dayton, OH | 3.0 | 1.5 | 1439 | $1,200 | $0.83 | 25d | 1 | 1.04mi |
| 42 S Ludlow St Dayton, OH | 1.0–3.0 | 1.0–2.0 | 860 | $1,068 | $1.24 | 46d | 1 | 1.06mi |
| 40 W 4th St Dayton, OH | 1.0–2.0 | 1.0–2.0 | 1118 | $2,200 | $1.97 | 46d | 7 | 1.09mi |
| 412 Forest Ave Unit 414 Dayton, OH | 3.0 | 1.5 | 1200 | $1,200 | $1.00 | 46d | 1 | 1.12mi |
| 216 N Ardmore Ave Dayton, OH | 3.0 | 1.0 | 1500 | $1,100 | $0.73 | 5d | 1 | 1.12mi |
| 725 Maplehurst Ave Dayton, OH | 2.0 | 1.0 | 1104 | $895 | $0.81 | 46d | 1 | 1.14mi |
| 1225 Amherst Pl Dayton, OH | 3.0 | 1.0 | 1548 | $1,300 | $0.84 | 16d | 1 | 1.14mi |
| 1378 Cory Dr Dayton, OH | 2.0 | 1.0 | 1300 | $975 | $0.75 | 46d | 1 | 1.16mi |
| 1067 Salem Ave Unit 2 Dayton, OH | 2.0 | 1.5 | 1100 | $900 | $0.82 | 46d | 1 | 1.17mi |
| 1067 Salem Ave Unit 3 Dayton, OH | 2.0 | 1.5 | 1100 | $900 | $0.82 | 46d | 1 | 1.17mi |
| 1067 Salem Ave Dayton, OH | 2.0 | 1.0 | 1100 | $900 | $0.82 | 46d | 1 | 1.17mi |
| 437 Lorenz Ave Dayton, OH | 3.0 | 1.0 | 1322 | $1,200 | $0.91 | 25d | 1 | 1.20mi |
| 338 Kenwood Ave Dayton, OH | 3.0 | 1.5 | 1512 | $1,195 | $0.79 | 46d | 1 | 1.21mi |
| 534 Geyer St Dayton, OH | 4.0 | 1.0 | 1640 | $1,530 | $0.93 | 25d | 1 | 1.24mi |
| 100 N Jefferson St Dayton, OH | 1.0–2.0 | 1.0–2.0 | 800 | $1,532 | $1.92 | 5d | 11 | 1.24mi |
| 429 Bolander Ave Unit 431 Dayton, OH | 4.0 | 2.5 | 1468 | $1,695 | $1.15 | 5d | 1 | 1.26mi |
| 429 Bolander Ave Dayton, OH | 4.0 | 2.5 | 1468 | $1,695 | $1.15 | 46d | 1 | 1.26mi |
| 140 E Monument Ave Dayton, OH | 3.0 | 1.0–2.0 | 1048 | $2,344 | $2.24 | 5d | 11 | 1.29mi |
| 518 Delaware Ave Dayton, OH | 2.0 | 1.0 | 1500 | $750 | $0.50 | 46d | 1 | 1.31mi |
| 35 S Saint Clair St Dayton, OH | 1.0–2.0 | 1.0–2.0 | 918 | $1,844 | $2.01 | 5d | 18 | 1.31mi |
| 1045 Philadelphia Dr Dayton, OH | 2.0 | 1.0 | 1290 | $1,150 | $0.89 | 5d | 1 | 1.35mi |
Listing history 18 events
-
2026-06-22days on market $1 Active 26 DOM
-
2026-06-18days on market $1 Active 23 DOM
-
2026-06-17days on market $1 Active 22 DOM
-
2026-06-16days on market $1 Active 21 DOM
-
2026-06-15days on market $1 Active 20 DOM
-
2026-06-14days on market $1 Active 18 DOM
-
2026-06-13days on market $1 Active 17 DOM
-
2026-06-10days on market $1 Active 15 DOM
-
2026-06-09days on market $1 Active 14 DOM
-
2026-06-08days on market $1 Active 13 DOM
-
2026-06-07days on market $1 Active 12 DOM
-
2026-06-05days on market $1 Active 9 DOM
-
2026-06-03remarks 392-char remark
-
2026-06-03days on market $1 Active 8 DOM
-
2026-06-02days on market $1 Active 7 DOM
-
2026-06-01days on market $1 Active 6 DOM
-
2026-05-31days on market $1 Active 5 DOM
-
2026-05-26$1 Active
ⓘ Source: listings_history table (triggers on properties + properties_extension) + one-shot
backfill from property_details.listing_events for pre-trigger history.
Climate risk First Street
- Flood 7/10 Severe FEMA zone X (unshaded) · 75% chance over 30 yrs
- Wildfire 1/10 Low
- Heat 4/10 Moderate 7 d/yr ≥102°F today · 18 d/yr by 30 yrs out
- Wind 2/10 Low 0% chance of damaging wind over 30 yrs
- Air quality 3/10 Moderate 2 unhealthy d/yr today · 4 by 30 yrs out
Nearby sold comps map
Loading sold comps map…
Walkable amenities ~0.75 mi
Loading nearby amenities…
Taxation est. · year 1
- Rental income
- $15,917
- − Mortgage interest
- −$4,415
- − Property taxes
- −$1,182
- − Insurance
- −$1,061
- − Repairs & maintenance
- −$1,273
- − Management
- −$1,273
- − Depreciation
- −$2,293
- Taxable income
- $4,419
- Est. tax owed @ 24.0%
- −$1,061
- After-tax cash flow
- $4,311/yr
For passive investors: Depreciation is non-cash, so a rental often shows a tax loss while cash-flowing — sheltering income. Rental losses are passive: they offset passive income freely, and up to $25,000/yr can offset ordinary (W-2) income if you actively participate and your MAGI is under $100k (phasing out to $0 by $150k); unused losses carry forward. On sale, claimed depreciation is recaptured at up to 25%, and gains may owe capital-gains tax (a 1031 exchange can defer both). Figures are a year-1 estimate at your 24.0% rate — not tax advice; consult a CPA.
Schools (NCES district)
- District
- Dayton City
- NCES district ID
- 3904384
- Math proficiency
- 12% ▼ -12.00%
- Reading proficiency
- 21% ▼ -11.00%
- Median HH income
- $28,688
- Composite
- 12.94/100
- National rank
- #9579
- State rank
- #641 of 656 in OH
Livability — Dayton
- Score
- 65/100
- State rank
- #716
- US rank
- #12895
Category grades
Schools grade is shown separately in the Schools card above.
Census & demographics
- Census place
- Dayton, OH
- County
- Montgomery County · 459,541 people
- City population
- 164,387
- Metro
- Dayton-Kettering, OH
- Population (ZIP)
- 9,407
- Household income
- $48,401
- Rent vs Own
- Severe rent burden
- 404.0
Population outlook (Montgomery County) Hauer SSP2
- Today (2025)
- 523,241 people
- By 2030
- 514,948 · -1.6%
- By 2040
- 493,378 · -5.7%
- By 2050
- 469,639 · -10.2%
- By 2075
- 418,360 · -20.0%
- By 2100
- 353,315 · -32.5%
Race, ethnicity, and origin ACS 2023
- Neighborhood character
- Diverse neighborhood (Simpson 0.57)
- Race & ethnicity
- Black 57% White 32% Two or more races 7% Hispanic / Latino 5%
- Hispanic origin (detail)
- Mexican 1%
- Common ancestry
- Italian 2% Serbian 2% Slovak 1%
- Foreign-born
- 5% · Canada, Vietnam, Jamaica
- Languages at home
- 94% English-only · Spanish 4% Other Asian/Pacific 1% Arabic 1%
Political lean MEDSL · Montgomery
- 2024 margin
- Toss-up / Even · D 49.8% · R 49.3%
- 2008→2024 swing
- -5.8pp toward R · 2008: 6.2pp · 2024: 0.5pp
- All cycles
- 2024: D+0.5 2020: D+2.2 2016: R+1.2 2012: D+3.1 2008: D+6.2
Not yet ingested
- Civics
- —
Market trends
- HPI YoY
- ▼ -81.89%
- Current HPI
- 149.7909
- Rent YoY
- ▲ 3.98%
- Metro
- Dayton-Kettering, OH
- State GDP YoY
- ▲ 1.98%
- F500 in state
- 48
Industry mix (Fortune 500 HQ in OH)
| Industry | F500 HQs | Revenue |
|---|---|---|
| Insurance | 3 | $145B |
|
||
| Industrial Machinery | 3 | $49B |
|
||
| Financial Services | 3 | $24B |
|
||
| Consumer Goods | 2 | $93B |
|
||
| Aerospace / Defense | 2 | $47B |
|
||
| Utilities | 2 | $33B |
|
||
Property tax history
+1.3%/yrLatest (2025): $1,172 · -18.1% YoY. Source: county tax records.
Cash-flow waterfall
monthlySold comps — $/sqft
last 12 mo · ≤1 miLoading sold comps…