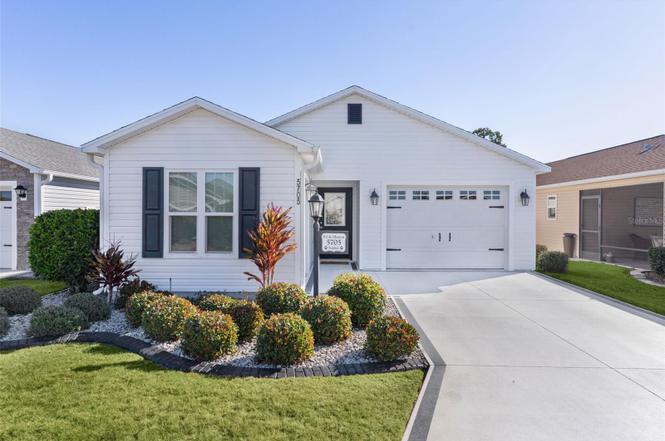
5705 Craft Ct · Wildwood, FL
Flood risk 1/10 · Minimal
- FEMA flood zone
- X (unshaded)
- Chance of flooding over 30 yrs
- 0.0%
- Est. flood insurance / yr
- $507 – $1,088
Fire risk 4/10 · Minor
- Est. fire insurance / yr
- $947 – $1,759
Heat risk 9/10 · Severe
- Hot days now (above 108°F)
- 7 days/yr
- Hot days in 30 yrs
- 23 days/yr
Wind risk 9/10 · Severe
- Chance of severe wind over 30 yrs
- 99.0%
Air-quality risk 2/10 · Minimal
- Unhealthy air days now
- 1 days/yr
- Unhealthy air days in 30 yrs
- 2 days/yr
Risk factors via First Street. Map © Google.
Why this score? — see what drove the B grade
The composite is a weighted blend of 9 inputs, each scored 0–100. Each bar is that input's sub-score; the figure is the points it added to the 100-point composite (weight × sub-score).
- Cash flow +20.6/30.0
- ARV discount +13.7/15.0
- Appreciation +10.0/10.0
- 1% rule +6.5/10.0
- DSCR +6.5/10.0
- Schools +5.2/10.0
- Livability +3.5/5.0
- Rent growth +2.5/5.0
- Condition / age +2.5/5.0
$289,900
🖨 Deal sheet 📄 Offer letter ✓ Due diligence
Listing remarks
Welcome to this beautiful Emerald model patio villa nestled in the desirable Village of DeSoto in The Villages. From the moment you arrive, you’ll appreciate the professional landscaping, painted driveway, one-car garage with epoxy flooring, and the added convenience of a separate golf cart garage—perfect for an active Florida lifestyle. ALL FURNITURE AND APPLIANCES ARE INCLUDED IN THIS EXCELLENT PRICE!!! Inside, this 3-bedroom, 2-bath home offers a thoughtfully designed layout with vaulted ceilings in the living and kitchen areas, creating an open, airy ambiance filled with natural light. There is BRAND NEW Luxury Plank Flooring in the living areas and front bedroom, while the
Key facts
- Painted driveway
- Maple cabinetry
- 3,520 sq ft lot
Tags
Property features AI
Finance
- Other: Property type: Residential (Villa); Zoning: RESI
- Financial info: Total annual fees approximately $2,448; No lease restrictions indicated
- HOA & community: Association: THE VILLAGES; Monthly association fee of $204; Association amenities include pool and recreational facilities; Community features: community mailbox, deed restrictions, dog park, golf carts allowed, golf, pool, trails; Vehicle and fence restrictions, pickleball and shuffleboard courts
Exterior
- Parking: Attached garage; 1-car garage; Golf cart garage
- Utilities: Public water; Public sewer; Electricity connected; Natural gas connected; Cable available; Phone available; BB/High-speed internet available; Sewer connected; Water connected; Underground utilities; Sprinkler recycled (reclaimed water)
- Home design: Residential villa; One story; Faces west; CDD community
- Construction: Vinyl siding; Shingle roof; Slab foundation; Built on a 0.08-acre lot
- Exterior features: Rain gutters; Sliding doors; Paved road access; Irrigation equipment
Interior
- Kitchen: Dishwasher; Disposal; Exhaust fan; Gas range; Microwave; Refrigerator
- Bedrooms: 3 bedrooms
- Flooring: Carpet
- Bathrooms: 2 full bathrooms
- Heating & cooling: Electric heating; Natural gas heating; Central air conditioning
- Interior features: Ceiling fans; Open floor plan; Vaulted ceilings; Walk-in closets; Window treatments
- Laundry & utility: Washer and dryer included; Laundry located inside and in the kitchen; Gas water heater; Tankless water heater
Neighborhood map
What this means for you Summary
Snapshot
- This is a 3-bed/2.0-bath single-family listed at $290k.
Deal economics
- At list price, monthly cash flow is $387 ($5k/yr) — positive.
- The deal already cash-flows at list — no discount required.
- Meets the 1% rule at list price ($3k rent vs $290k).
- Recommended offer: $264k (9.0% below list) — sets the bar for market timing.
- Cap rate 7.9% vs local median 3.9% in Wildwood — top-decile yield for the area; either an underpriced asset or a hidden risk that comps aren't pricing in. Stress-test before assuming the spread holds.
Location & tenants
- Location reads 69/100 on livability (#471 in FL) — a middle-class / working-renter tenant base. Strengths: health & safety A+, cost of living A, crime A-; Watch: schools C-, amenities F, commute F.
- Sumter (rural): math 61% / reading 61% proficiency, ranked #11 of 73 in FL (top 15%) — acceptable for families but not a draw, mixed tenant base, ~2y average lease.
- Market conditions: 265 active listings in the ZIP; 2 comparable units currently listed for rent nearby; solid renter incomes; 3,961 units permitted in Sumter County in 2024 (248 in 5+ unit buildings).
- This rent runs 41% of the median local income ($97k/yr) — at the standard rent-burdened threshold; future hikes will face affordability resistance.
Forward outlook
- In year one you build about $31k of equity ($2k loan paydown + $29k appreciation (10.0% local appreciation)).
- Sumter County population projected at +45% by 2050 — long-run rental-demand tailwind backs the buy-and-hold thesis.
- At projected returns (10.0% appreciation + 3.0% rent growth), your $81k cash investment doubles in ~3 years — after that, you're playing with house money.
- By year 2, paydown + projected appreciation supports a ~$50k cash-out refi (75% LTV) — recoverable capital for the next deal without selling this one.
Negotiation context
- It's been on market 113 days — a 9% lower offer ($264k) is reasonable based on typical stale-listing flexibility.
Risks & watch-outs
- Climate carrying-cost: severe wind risk, 99% chance of damaging wind over 30y; extreme-heat days projected 7→23/yr by 2055 (HVAC capex compounding) — expect insurance premiums to compound above CPI over the hold.
Questions for the listing agent
- It's been on market 113 days. Have you received any prior offers? Is the seller open to a 9% concession, seller financing, or rate buy-down credit?
- What does the HOA fee cover, when was the last increase, and are there any pending special assessments or reserve-fund shortfalls?
- Why hasn't it sold? Are there any deal-killer items the seller is aware of (foundation, flood, title, zoning, code violations)?
- Is there a deadline driving the sale (1031 exchange, divorce, estate, relocation)? That informs how much negotiation room exists.
- What's the average days-on-market for RENTAL listings here right now (not sales)? A rising rental-DOM trend means longer vacancies and softer asking-rent achievability than the comps imply.
- What's the recent tenant-quality profile in this submarket — average credit score on applications, eviction rate, late-payment / NSF rate, and stable-employment percentage? A property-management company in the area should have these aggregated.
- How much new for-sale + rental construction is in the pipeline within 1–3 miles? Heavy new supply typically softens prices + rents 12–24 months out; constrained supply supports both.
Investment metrics
- 1% rule
- 1.15% ✓
- Cap rate
- 7.89%
- Cash-on-cash
- 5.72%
- DSCR
- 1.25
- GRM
- 7.3
CMA / ARV
- ARV (on-the-fly)
- $336,536
- Comps found
- 12
Show comp detail 12 sales within ~0.75 mi
| Address | Dist | Beds/Ba | Sqft | Sold | Price | $/sf | Match |
|---|---|---|---|---|---|---|---|
| 5705 Craft Ct | 0.00mi | 3/2.0 | 1,426 (0%) | 0mo | $280,000 | $196 | 100 |
| 5690 Craft Ct | 0.03mi | 2/2.0 (-1) | 1,314 (-8%) | 0mo | $310,000 | $236 | 80 |
| 5859 Tupelo Ter | 0.39mi | 3/2.0 | 1,409 (-1%) | 1mo | $342,000 | $243 | 79 |
| 5829 Tupelo Ter | 0.36mi | 3/2.0 | 1,409 (-1%) | 11mo | $355,000 | $252 | 72 |
| 5454 Ryan Rd | 0.42mi | 3/2.0 | 1,426 (0%) | 16mo | $359,000 | $252 | 67 |
| 5459 Weaver Ave | 0.46mi | 3/2.0 | 1,426 (0%) | 18mo | $310,000 | $217 | 63 |
| 2061 Biller Cir | 0.60mi | 3/2.0 | 1,459 (+2%) | 10mo | $322,000 | $221 | 60 |
| 2306 Sheehan St | 0.39mi | 2/2.0 (-1) | 1,227 (-14%) | 5mo | $272,000 | $222 | 49 |
| 2188 Gordon Path | 0.72mi | 3/2.0 | 1,539 (+8%) | 8mo | $390,000 | $253 | 47 |
| 2170 Biller Cir | 0.68mi | 3/2.0 | 1,539 (+8%) | 12mo | $403,000 | $262 | 45 |
| 5627 Van Winkle Ter | 0.36mi | 2/2.0 (-1) | 1,227 (-14%) | 16mo | $290,000 | $236 | 42 |
| 5415 Zajac Ave | 0.58mi | 2/2.0 (-1) | 1,295 (-9%) | 15mo | $285,000 | $220 | 40 |
Match score weights: distance 35% · size 25% · config 20% · recency 20%. Top-matched comps best support the ARV.
Projected returns pro-forma
10.0% appreciation · 3.0% rent growth · sell at horizon
- IRR
- 28.5%
- Equity multiple
- 3.25×
- Total profit
- $182,727
- Equity at exit
- $261,165
- IRR
- 24.8%
- Equity multiple
- 7.40×
- Total profit
- $519,109
- Equity at exit
- $563,212
Cash invested: $81,172 (down + closing). Projections, not guarantees.
Landlord ↔ Tenant lean methodology
- Overall (STATE)
- 87 Strongly Landlord-Friendly
- State Florida
- 87 Strongly Landlord-Friendly · R+3
- County
- — inherits STATE
- City
- — inherits STATE
ZIP-level market 32163
- Home prices YoY
- 9.8%
- Active inventory
- 265
- Price-to-rent
- 7.3×
Monthly cashflow live
- Estimated rent
- $3,325 medium interval (Pro) →
- Mortgage (P&I)
- −$1,520
- Tax from tax record
- −$395 /mo · $4,738/yr
- Insurance
- −$121
- HOA
- −$204
- Vacancy / Maint / Mgmt
- −$698
- Net cashflow
- $387
Break-even live
UW: 25.0% down · 7.5% · 30yr · 1.5% tax · 5.0% vac · 8.0% maint · 8.0% mgmt
Financing live
Cash to close
- Down payment
- $72,475
- Closing costs
- $8,697
- Reserves months
- —
- Total cash needed
- —
Loan-product check · same deal, 3 products live
Conventional
25% down · 7.5% · 30yr
- Down + closing
- —
- Monthly P&I
- —
- Monthly cashflow
- —
- DSCR
- —
- Eligible?
- —
Personal DTI + credit; lowest rate.
DSCR
20% down · 8.5% · 30yr
- Down + closing
- —
- Monthly P&I
- —
- Monthly cashflow
- —
- DSCR
- —
- Eligible?
- —
No personal income docs; deal must DSCR.
Hard money
10% down · 12.0% · 12mo
- Down + closing
- —
- Monthly P&I
- —
- Monthly cashflow
- —
- DSCR
- —
- Eligible?
- —
Short-term bridge; refi at stabilization.
Rent comps 2 comps
| Address | Beds | Baths | Sqft | Rent | $/sqft | DOM | Units | Dist |
|---|---|---|---|---|---|---|---|---|
| 2408 Woods Way The Villages, FL | 3.0 | 2.0 | 1419 | $2,900 | $2.04 | 21d | 1 | 0.31mi |
| 5828 Tupelo Ter Unit Posted to Internet Wildwood, FL | 2.0 | 2.0 | 1147 | $4,500 | $3.92 | 21d | 1 | 0.37mi |
HOA detail
- Monthly dues
- $204 · $2,448/yr
- Likely covers
- landscaping
Listing history 4 events
-
2026-05-13status Pending
-
2026-03-26price $289,900
-
2026-02-21price $299,999
-
2026-01-20$319,900 Active
ⓘ Source: listings_history table (triggers on properties + properties_extension) + one-shot
backfill from property_details.listing_events for pre-trigger history.
Tax reassessment forecast FL · Resets to sale price
- Current annual tax
- $4,738 · $395/mo
- Projected year-2 tax
- $4,738 · $395/mo
- Expected delta
- $0/yr ($0/mo · -0.0%)
ⓘ Screening estimate from a state-policy table — verify with the county assessor before closing.
Climate risk First Street
- Flood 1/10 Low FEMA zone X (unshaded) · 0% chance over 30 yrs
- Wildfire 4/10 Moderate
- Heat 9/10 Extreme 7 d/yr ≥108°F today · 23 d/yr by 30 yrs out
- Wind 9/10 Extreme 99% chance of damaging wind over 30 yrs
- Air quality 2/10 Low 1 unhealthy d/yr today · 2 by 30 yrs out
Nearby sold comps map
Loading sold comps map…
Walkable amenities ~0.75 mi
Loading nearby amenities…
Taxation est. · year 1
- Rental income
- $39,901
- − Mortgage interest
- −$16,239
- − Property taxes
- −$4,738
- − Insurance
- −$1,450
- − Repairs & maintenance
- −$3,192
- − Management
- −$3,192
- − HOA
- −$2,448
- − Depreciation
- −$8,433
- Taxable income
- $209
- Est. tax owed @ 24.0%
- −$50
- After-tax cash flow
- $4,593/yr
For passive investors: Depreciation is non-cash, so a rental often shows a tax loss while cash-flowing — sheltering income. Rental losses are passive: they offset passive income freely, and up to $25,000/yr can offset ordinary (W-2) income if you actively participate and your MAGI is under $100k (phasing out to $0 by $150k); unused losses carry forward. On sale, claimed depreciation is recaptured at up to 25%, and gains may owe capital-gains tax (a 1031 exchange can defer both). Figures are a year-1 estimate at your 24.0% rate — not tax advice; consult a CPA.
Schools (NCES district)
- District
- Sumter
- NCES district ID
- 1201800
- Math proficiency
- 61% ▼ -4.00%
- Reading proficiency
- 61% ▼ -2.00%
- Median HH income
- $48,240
- Composite
- 51.74/100
- National rank
- #1682
- State rank
- #11 of 73 in FL
Livability — Wildwood
- Score
- 69/100
- State rank
- #471
- US rank
- #8500
Category grades
Schools grade is shown separately in the Schools card above.
Census & demographics
- Census place
- Wildwood, FL
- County
- Sumter County · 110,591 people
- City population
- 21,568
- Metro
- The Villages, FL
- Population (ZIP)
- 28,549
- Household income
- $96,775
- Rent vs Own
- Severe rent burden
- 307.0
Population outlook (Sumter County) Hauer SSP2
- Today (2025)
- 161,172 people
- By 2030
- 180,083 · +11.7%
- By 2040
- 209,892 · +30.2%
- By 2050
- 234,186 · +45.3%
- By 2075
- 284,602 · +76.6%
- By 2100
- 317,039 · +96.7%
Race, ethnicity, and origin ACS 2023
- Neighborhood character
- Predominantly White (95%)
- Race & ethnicity
- White 95% Two or more races 2% Hispanic / Latino 2% Asian 1%
- Common ancestry
- Romanian 6% Lithuanian 3% Iranian 3%
- Foreign-born
- 6% · Canada, Vietnam
- Languages at home
- 96% English-only · Spanish 2% Vietnamese 1% Other Indo-European 0%
Political lean MEDSL · Sumter
- 2024 margin
- Solid R (+37.6) · D 30.9% · R 68.6%
- 2008→2024 swing
- -10.6pp toward R · 2008: -27.0pp · 2024: -37.6pp
- All cycles
- 2024: R+37.6 2020: R+36.1 2016: R+39.2 2012: R+34.9 2008: R+27.0
Not yet ingested
- Civics
- —
Market trends
- HPI YoY
- ▲ 20.47%
- Current HPI
- 229.0075
- Rent YoY
- —
- Metro
- The Villages, FL
- State GDP YoY
- ▲ 3.28%
- F500 in state
- 36
Industry mix (Fortune 500 HQ in FL)
| Industry | F500 HQs | Revenue |
|---|---|---|
| Industrial Technology | 2 | $29B |
|
||
| Insurance | 2 | $17B |
|
||
| Retail | 1 | $60B |
|
||
| Technology Distribution | 1 | $58B |
|
||
| Homebuilding | 1 | $35B |
|
||
| Technology Manufacturing | 1 | $35B |
|
||
Price history
-9.4% since first listed4 events — show timeline
- 2026-05-13 Pending — Stellar MLS as Distributed by MLS Grid
- 2026-03-26 Price Changed $289,900 Stellar MLS as Distributed by MLS Grid
- 2026-02-21 Price Changed $299,999 Stellar MLS as Distributed by MLS Grid
- 2026-01-20 Listed $319,900 Stellar MLS as Distributed by MLS Grid
Property tax history
+19.9%/yrLatest (2025): $4,738 · +3.5% YoY. Source: county tax records.
Cash-flow waterfall
monthlySold comps — $/sqft
last 12 mo · ≤1 miLoading sold comps…