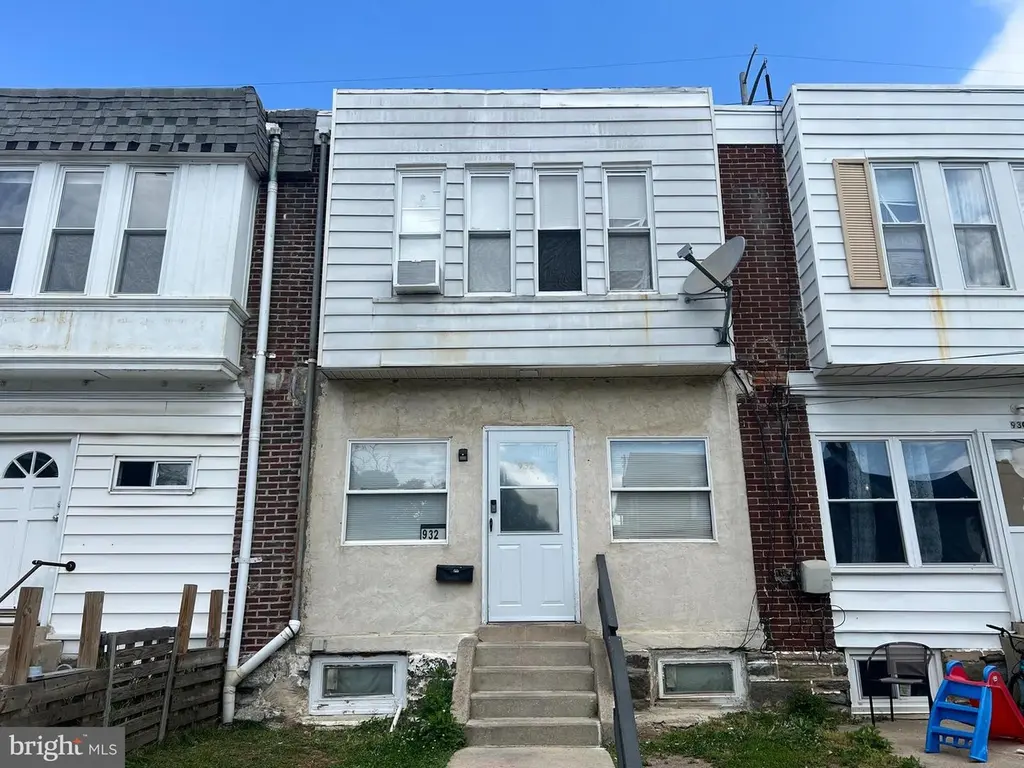
932 Marshall Rd · Sharon Hill, PA
Flood risk 1/10 · Minimal
- FEMA flood zone
- X (unshaded)
- Chance of flooding over 30 yrs
- 0.0%
- Est. flood insurance / yr
- $473 – $860
Fire risk 1/10 · Minimal
- Est. fire insurance / yr
- $511 – $949
Heat risk 6/10 · Moderate
- Hot days now (above 103°F)
- 7 days/yr
- Hot days in 30 yrs
- 15 days/yr
Wind risk 6/10 · Moderate
- Chance of severe wind over 30 yrs
- 27.0%
Air-quality risk 4/10 · Minor
- Unhealthy air days now
- 3 days/yr
- Unhealthy air days in 30 yrs
- 6 days/yr
Risk factors via First Street. Map © Google.
Why this score? — see what drove the C grade
The composite is a weighted blend of 9 inputs, each scored 0–100. Each bar is that input's sub-score; the figure is the points it added to the 100-point composite (weight × sub-score).
- Cash flow +18.3/30.0
- ARV discount +15.0/15.0
- 1% rule +8.0/10.0
- DSCR +5.7/10.0
- Livability +4.1/5.0
- Rent growth +2.5/5.0
- Condition / age +2.5/5.0
- Schools +2.0/10.0
- Appreciation +0.0/10.0
$139,900
🖨 Deal sheet 📄 Offer letter ✓ Due diligence
Listing remarks MLS
Welcome To This Well Maintained 4 Bedroom Townhome In Sharon Hill. This Property Has Enclosed Porch, Large Living Room, Large Dining Room And Full Kitchen. Deck Is Located Off Of Kitchen. Fenced In Yard Makes It Perfect For Pets. Low Taxes, Near Shopping And Public Transportation. Must See For Yourself Priced To Sell Fast!
Key facts
- Gas hot water
- Gas heat
- Newer full bathroom
Tags
Property features AI
Finance
- Other: Finished above-grade area reported (1,544); Ownership interest: Fee Simple
- Financial info: Lease considered
Exterior
- Parking: Off-street parking with 2 spaces; Total of 2 garage/parking spaces
- Utilities: 100 Amp electrical service; Public water; Public sewer; Natural gas hot water
- Home design: Interior townhouse/rowhouse; Fee simple ownership
- Construction: Brick construction; Block foundation; Above-grade and below-grade structures
- Exterior features: Lot dimensions approximately 18.00 x 75.00; No tidal water
Interior
- Kitchen: Kitchen (appliances not specified)
- Bedrooms: Four bedrooms on the upper level; Rooms include living room, dining room, master bedroom, and additional bedrooms
- Bathrooms: One full bathroom on the upper level; One full bathroom total
- Heating & cooling: Hot water heating; Natural gas heating fuel
- Interior features: Interior access to basement; Unfinished basement
- Laundry & utility: No specific laundry appliances listed
Neighborhood map
What this means for you Summary
Snapshot
- This is a 3-bed/1.0-bath townhouse listed at $140k.
Deal economics
- At list price, monthly cash flow is $128 ($2k/yr) — positive.
- The deal already cash-flows at list — no discount required.
- Meets the 1% rule at list price ($2k rent vs $140k).
- Recommended offer: $136k (3.0% below list) — sets the bar for market timing.
- Cap rate 7.4% vs local median 3.3% in Sharon Hill — top-decile yield for the area; either an underpriced asset or a hidden risk that comps aren't pricing in. Stress-test before assuming the spread holds.
Location & tenants
- Location reads 82/100 on livability (#142 in PA, #1,147 nationally) — a professional / high-income tenant draw. Strengths: commute A+, cost of living A+, housing A; Watch: amenities D.
- Southeast Delco SD (suburban): math 13% / reading 33% proficiency, ranked #478 of 539 in PA (top 89%) — low school quality limits family demand, transient renter base, plan for 1-2y turnover; 63% free/reduced lunch — lower-income household profile, screen leases tightly.
- Market conditions: 34 active listings in the ZIP; 27 comparable units currently listed for rent nearby; rentals at typical pace (median 21d on market — plan ~3-4 weeks tenant-placement turnaround); 299 units permitted in Delaware County in 2024 (5 in 5+ unit buildings).
Forward outlook
- Local home prices are declining (-3.0%/yr); year-one equity from $967 of loan paydown is wiped out by about $4k of value loss. Plan a longer hold.
Negotiation context
- It's been on market 36 days — a 3% lower offer ($136k) is reasonable based on typical stale-listing flexibility.
- 4 sale attempts since 29y ago; this cycle's ask has dropped $8k (5%) from the opening price — seller is motivated, your offer sets the floor, not the list.
- Current owner paid $45k; list at $140k implies a 211% gain — meaningful room to come down on a strong offer.
Risks & watch-outs
- Watch-outs: property tax is 4.5% of price; built in 1923 — expect roof / HVAC / electrical / plumbing capex.
- Climate carrying-cost: major wind risk, 27% chance of damaging wind over 30y; extreme-heat days projected 7→15/yr by 2055 (HVAC capex compounding) — expect insurance premiums to compound above CPI over the hold.
Questions for the listing agent
- It's been on market 36 days. Have you received any prior offers? Is the seller open to a 3% concession, seller financing, or rate buy-down credit?
- Built in 1923 — when were the roof, HVAC, electrical panel, plumbing, and water heater last replaced?
- Property tax is high relative to price — has the assessment been appealed recently, and will the sale trigger a re-assessment?
- Is there a deadline driving the sale (1031 exchange, divorce, estate, relocation)? That informs how much negotiation room exists.
- What's the average days-on-market for RENTAL listings here right now (not sales)? A rising rental-DOM trend means longer vacancies and softer asking-rent achievability than the comps imply.
- What's the recent tenant-quality profile in this submarket — average credit score on applications, eviction rate, late-payment / NSF rate, and stable-employment percentage? A property-management company in the area should have these aggregated.
- How much new for-sale + rental construction is in the pipeline within 1–3 miles? Heavy new supply typically softens prices + rents 12–24 months out; constrained supply supports both.
Investment metrics
- 1% rule
- 1.30% ✓
- Cap rate
- 7.39%
- Cash-on-cash
- 3.93%
- DSCR
- 1.17
- GRM
- 6.4
CMA / ARV
- ARV (median comp)
- $181,445
- List price
- $139,900
- Delta
- -22.90%
- Verdict
- UNDERPRICED
- Comps
- 20 within 1.0 mi
Show comp detail 12 sales within ~0.75 mi
| Address | Dist | Beds/Ba | Sqft | Sold | Price | $/sf | Match |
|---|---|---|---|---|---|---|---|
| 105 Jackson Ave | 0.13mi | 3/2.0 | 1,486 (-4%) | 3mo | $138,000 | $93 | 81 |
| 80 Kenny Ave | 0.06mi | 3/2.0 | 1,432 (-7%) | 1mo | $237,000 | $166 | 80 |
| 90 Ridley Ave | 0.06mi | 3/1.5 | 1,362 (-12%) | 2mo | $245,000 | $180 | 74 |
| 217 Blunston Ave | 0.41mi | 3/1.5 | 1,504 (-3%) | 3mo | $240,000 | $160 | 72 |
| 712 Bartram Ave | 0.53mi | 3/1.5 | 1,554 (+1%) | 3mo | $289,625 | $186 | 70 |
| 81 Florence Ave | 0.23mi | 3/1.0 | 1,356 (-12%) | 3mo | $230,000 | $170 | 66 |
| 1307 Elmwood Ave | 0.58mi | 3/1.5 | 1,500 (-3%) | 1mo | $289,900 | $193 | 65 |
| 228 Bartlett Ave | 0.45mi | 4/2.0 (+1) | 1,459 (-6%) | 3mo | $289,900 | $199 | 58 |
| 1027 Windsor Rd | 0.71mi | 4/1.0 (+1) | 1,471 (-5%) | 4mo | $225,900 | $154 | 51 |
| 413 Clifton Ave | 0.47mi | 3/2.0 | 1,750 (+13%) | 2mo | $284,900 | $163 | 50 |
| 311 Laurel Rd | 0.58mi | 3/1.5 | 1,330 (-14%) | 4mo | $279,900 | $210 | 45 |
| 421 Poplar St | 0.56mi | 3/3.0 | 1,724 (+12%) | 2mo | $300,000 | $174 | 44 |
Match score weights: distance 35% · size 25% · config 20% · recency 20%. Top-matched comps best support the ARV.
Projected returns pro-forma
-3.0% appreciation · 3.0% rent growth · sell at horizon
- IRR
- -10.0%
- Equity multiple
- 0.64×
- Total profit
- $-14,269
- Equity at exit
- $20,860
- IRR
- -0.3%
- Equity multiple
- 0.98×
- Total profit
- $-944
- Equity at exit
- $12,096
Cash invested: $39,172 (down + closing). Projections, not guarantees.
Landlord ↔ Tenant lean methodology
- Overall (STATE)
- 62 Landlord-Friendly
- State Pennsylvania
- 62 Landlord-Friendly · EVEN
- County
- — inherits STATE
- City
- — inherits STATE
ZIP-level market 19079
- Home prices YoY
- -17.7%
- Active inventory
- 34
- Price-to-rent
- 6.4×
Monthly cashflow live
- Estimated rent
- $1,822 high interval (Pro) →
- Mortgage (P&I)
- −$734
- Tax from tax record
- −$519 /mo · $6,229/yr
- Insurance
- −$58
- HOA
- −$0
- Vacancy / Maint / Mgmt
- −$383
- Net cashflow
- $128
Break-even live
UW: 25.0% down · 7.5% · 30yr · 1.5% tax · 5.0% vac · 8.0% maint · 8.0% mgmt
Financing live
Cash to close
- Down payment
- $34,975
- Closing costs
- $4,197
- Reserves months
- —
- Total cash needed
- —
Loan-product check · same deal, 3 products live
Conventional
25% down · 7.5% · 30yr
- Down + closing
- —
- Monthly P&I
- —
- Monthly cashflow
- —
- DSCR
- —
- Eligible?
- —
Personal DTI + credit; lowest rate.
DSCR
20% down · 8.5% · 30yr
- Down + closing
- —
- Monthly P&I
- —
- Monthly cashflow
- —
- DSCR
- —
- Eligible?
- —
No personal income docs; deal must DSCR.
Hard money
10% down · 12.0% · 12mo
- Down + closing
- —
- Monthly P&I
- —
- Monthly cashflow
- —
- DSCR
- —
- Eligible?
- —
Short-term bridge; refi at stabilization.
Rent comps 27 comps
| Address | Beds | Baths | Sqft | Rent | $/sqft | DOM | Units | Dist |
|---|---|---|---|---|---|---|---|---|
| 118 Felton Ave Darby, PA | 3.0 | 1.0 | 1152 | $1,750 | $1.52 | 22d | 1 | 0.13mi |
| 526 Macdade Blvd Darby, PA | 2.0 | 1.0 | 2148 | $1,250 | $0.58 | 16d | 1 | 0.15mi |
| 526 Macdade Blvd Darby, PA | 2.0 | 1.0 | 2148 | $1,250 | $0.58 | 43d | 1 | 0.15mi |
| 66 Folcroft Ave Folcroft, PA | 3.0 | 1.0 | 1224 | $1,895 | $1.55 | 3d | 1 | 0.55mi |
| 2 Winthrop Rd Darby, PA | 3.0 | 1.5 | 1224 | $1,900 | $1.55 | 22d | 1 | 0.64mi |
| 209 Hamilton Ave Darby, PA | 4.0 | 1.0 | 1400 | $1,595 | $1.14 | 15d | 1 | 0.70mi |
| 700 Pine St Unit 2F Darby, PA | 2.0 | 1.0 | 1100 | $1,250 | $1.14 | 18d | 1 | 0.78mi |
| 69 S 7th St Darby, PA | 3.0 | 2.0 | 1446 | $1,700 | $1.18 | 43d | 1 | 0.87mi |
| 820 Greenhill Rd Sharon Hill, PA | 4.0 | 2.0 | 1184 | $2,600 | $2.20 | 5d | 1 | 0.89mi |
| 304 Pine St Glenolden, PA | 3.0 | 2.0 | 1120 | $2,400 | $2.14 | 43d | 1 | 0.95mi |
| 306 Pine St Glenolden, PA | 3.0 | 2.0 | 1120 | $2,400 | $2.14 | 4d | 1 | 0.95mi |
| 94 S 6th St Darby, PA | 3.0 | 1.5 | 1666 | $2,000 | $1.20 | 24d | 1 | 0.97mi |
| 924 Maple Ter Darby, PA | 3.0 | 1.5 | 1190 | $2,000 | $1.68 | 5d | 1 | 1.00mi |
| 935 Maple Ter Darby, PA | 3.0 | 1.0 | 1266 | $1,585 | $1.25 | 5d | 1 | 1.02mi |
| 935 Maple Ter Darby, PA | 3.0 | 1.0 | 1266 | $1,585 | $1.25 | 11d | 1 | 1.02mi |
| 304 S 3rd St Darby, PA | 3.0 | 1.0 | 1602 | $1,695 | $1.06 | 43d | 1 | 1.07mi |
| 304 S 3rd St Darby, PA | 3.0 | 1.0 | 1602 | $1,595 | $1.00 | 20d | 1 | 1.07mi |
| 412 S 2nd St Darby, PA | 3.0 | 1.0 | 1190 | $1,100 | $0.92 | 5d | 1 | 1.09mi |
| 417 S 2nd St Darby, PA | 3.0 | 1.0 | 1190 | $1,020 | $0.86 | 5d | 1 | 1.10mi |
| 106 N 6th St Darby, PA | 2.0 | 1.0 | 1200 | $1,550 | $1.29 | 43d | 1 | 1.10mi |
| 1074 N Academy Ave Glenolden, PA | 3.0 | 1.0 | 1152 | $1,850 | $1.61 | 5d | 1 | 1.11mi |
| 37 Concord Rd Darby, PA | 3.0 | 1.0 | 1120 | $1,795 | $1.60 | 43d | 1 | 1.11mi |
| 1519 Roosevelt Dr Sharon Hill, PA | 3.0 | 1.5 | 1260 | $2,295 | $1.82 | 43d | 1 | 1.25mi |
| 902 Maple Ave Glenolden, PA | 3.0 | 1.0 | 1152 | $1,745 | $1.51 | 43d | 1 | 1.32mi |
| 925 Maple Ave Glenolden, PA | 3.0 | 2.0 | 1152 | $2,800 | $2.43 | 22d | 1 | 1.33mi |
| 201 Westbridge Rd Glenolden, PA | 3.0 | 1.5 | 1224 | $2,350 | $1.92 | 24d | 1 | 1.45mi |
| 100 E Glenolden Ave Glenolden, PA | 1.0–4.0 | 1.0–2.0 | 920 | $2,167 | $2.36 | 1d | 4 | 1.49mi |
Listing history 24 events
-
2026-06-18days on market $139,900 Active 36 DOM
-
2026-06-17days on market $139,900 Active 35 DOM
-
2026-06-16days on market $139,900 Active 34 DOM
-
2026-06-15days on market $139,900 Active 33 DOM
-
2026-06-13days on market $139,900 Active 31 DOM
-
2026-06-13days on market $139,900 Active 30 DOM
-
2026-06-09days on market $139,900 Active 27 DOM
-
2026-06-08days on market $139,900 Active 26 DOM
-
2026-06-07days on market $139,900 Active 25 DOM
-
2026-06-04days on market $139,900 Active 22 DOM
-
2026-06-03days on market $139,900 Active 21 DOM
-
2026-06-02days on market $139,900 Active 20 DOM
-
2026-06-02price $139,900 Active 19 DOM
-
2026-06-01days on market $147,500 Active 19 DOM
-
2026-05-31days on market $147,500 Active 18 DOM
-
2026-05-15status Active 675-char remark
-
2026-05-14historical 675-char remark
-
2026-05-12$147,500 Active 675-char remark
-
2013-11-08soldstatus $45,000
-
2001-11-16soldstatus $39,900 324-char remark
Show marketing remark (324 chars)
Welcome To This Well Maintained 4 Bedroom Townhome In Sharon Hill. This Property Has Enclosed Porch, Large Living Room, Large Dining Room And Full Kitchen. Deck Is Located Off Of Kitchen. Fenced In Yard Makes It Perfect For Pets. Low Taxes, Near Shopping And Public Transportation. Must See For Yourself Priced To Sell Fast!
-
2001-05-01$39,900 324-char remark
Show marketing remark (324 chars)
Welcome To This Well Maintained 4 Bedroom Townhome In Sharon Hill. This Property Has Enclosed Porch, Large Living Room, Large Dining Room And Full Kitchen. Deck Is Located Off Of Kitchen. Fenced In Yard Makes It Perfect For Pets. Low Taxes, Near Shopping And Public Transportation. Must See For Yourself Priced To Sell Fast!
-
1998-10-11historical
-
1997-10-11$39,900
-
1997-05-16soldstatus $25,000
ⓘ Source: listings_history table (triggers on properties + properties_extension) + one-shot
backfill from property_details.listing_events for pre-trigger history.
Tax reassessment forecast PA · Partial reset (capped growth)
- Current annual tax
- $6,229 · $519/mo
- Projected year-2 tax
- $6,229 · $519/mo
- Expected delta
- $0/yr ($0/mo · 0.0%)
ⓘ Screening estimate from a state-policy table — verify with the county assessor before closing.
Climate risk First Street
- Flood 1/10 Low FEMA zone X (unshaded) · 0% chance over 30 yrs
- Wildfire 1/10 Low
- Heat 6/10 Major 7 d/yr ≥103°F today · 15 d/yr by 30 yrs out
- Wind 6/10 Major 27% chance of damaging wind over 30 yrs
- Air quality 4/10 Moderate 3 unhealthy d/yr today · 6 by 30 yrs out
Nearby sold comps map
Loading sold comps map…
Walkable amenities ~0.75 mi
Loading nearby amenities…
Taxation est. · year 1
- Rental income
- $21,861
- − Mortgage interest
- −$7,837
- − Property taxes
- −$6,229
- − Insurance
- −$700
- − Repairs & maintenance
- −$1,749
- − Management
- −$1,749
- − Depreciation
- −$4,070
- Taxable loss
- −$472
- Est. tax savings @ 24.0%
- +$113
- After-tax cash flow
- $1,651/yr
For passive investors: Depreciation is non-cash, so a rental often shows a tax loss while cash-flowing — sheltering income. Rental losses are passive: they offset passive income freely, and up to $25,000/yr can offset ordinary (W-2) income if you actively participate and your MAGI is under $100k (phasing out to $0 by $150k); unused losses carry forward. On sale, claimed depreciation is recaptured at up to 25%, and gains may owe capital-gains tax (a 1031 exchange can defer both). Figures are a year-1 estimate at your 24.0% rate — not tax advice; consult a CPA.
Schools (NCES district)
- District
- Southeast Delco SD
- NCES district ID
- 4222400
- Math proficiency
- 13% ▼ -8.00%
- Reading proficiency
- 33% ▼ -9.00%
- Median HH income
- $49,309
- Composite
- 20.25/100
- National rank
- #8623
- State rank
- #478 of 539 in PA
Livability — Sharon Hill
- Score
- 82/100
- State rank
- #142
- US rank
- #1147
Category grades
Schools grade is shown separately in the Schools card above.
Census & demographics
- Census place
- Sharon Hill, PA
- Population (ZIP)
- 9,014
Population outlook (Delaware County) Hauer SSP2
- Today (2025)
- 577,490 people
- By 2030
- 581,243 · +0.6%
- By 2040
- 584,700 · +1.2%
- By 2050
- 586,581 · +1.6%
- By 2075
- 598,706 · +3.7%
- By 2100
- 590,823 · +2.3%
Race, ethnicity, and origin ACS 2023
- Neighborhood character
- Predominantly Black (80%)
- Race & ethnicity
- Black 80% White 12% Two or more races 6% Hispanic / Latino 4% Asian 1%
- Common ancestry
- Romanian 1% Hispanic 1%
- Foreign-born
- 10% · Canada, China
- Languages at home
- 93% English-only · Chinese 1% Spanish 1%
Political lean MEDSL · Delaware
- 2024 margin
- Strong D (+23.7) · D 61.4% · R 37.6% · Other 1.0%
- 2008→2024 swing
- +2.3pp toward D · 2008: 21.4pp · 2024: 23.7pp
- All cycles
- 2024: D+23.7 2020: D+26.7 2016: D+22.0 2012: D+21.8 2008: D+21.4
Not yet ingested
- Civics
- —
Market trends
- HPI YoY
- ▼ -71.04%
- Current HPI
- 330.4912
- Rent YoY
- —
- Metro
- —
- State GDP YoY
- ▲ 1.68%
- F500 in state
- 34
Industry mix (Fortune 500 HQ in PA)
| Industry | F500 HQs | Revenue |
|---|---|---|
| Healthcare | 2 | $309B |
|
||
| Insurance | 2 | $27B |
|
||
| Telecommunications / Media | 1 | $124B |
|
||
| Industrial Distribution | 1 | $22B |
|
||
| Financial Services | 1 | $20B |
|
||
| Chemicals / Materials | 1 | $18B |
|
||
Price history
+459.6% since first listed10 events — show timeline
- 2026-06-01 Price Changed $139,900 BRIGHT MLS
- 2026-05-15 Relisted — BRIGHT MLS
- 2026-05-14 Listing Removed — BRIGHT MLS
- 2026-05-12 Listed $147,500 BRIGHT MLS
- 2013-11-08 Sold (Public Records) $45,000 Public Records
- 2001-11-16 Sold (MLS) $39,900 BRIGHT MLS
- 2001-05-01 Listed $39,900 BRIGHT MLS
- 1998-10-11 Listing Removed — BRIGHT MLS
- 1997-10-11 Listed $39,900 BRIGHT MLS
- 1997-05-16 Sold (Public Records) $25,000 Public Records
Property tax history
+5.7%/yrLatest (2026): $6,229 · +83.2% YoY. Source: county tax records.
Cash-flow waterfall
monthlySold comps — $/sqft
last 12 mo · ≤1 miLoading sold comps…