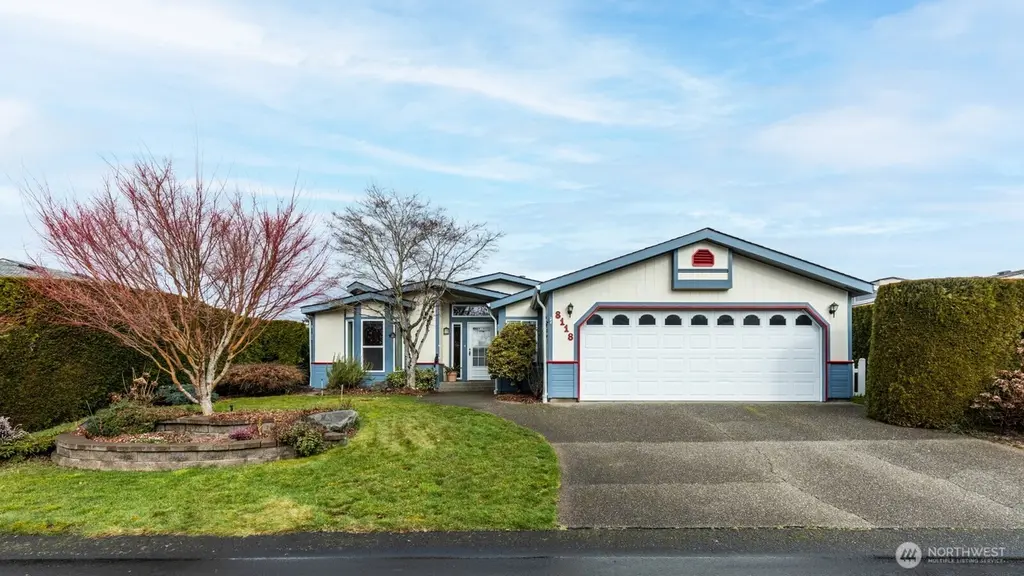
8118 20th Ln SE #93 · Lacey, WA
Flood risk 1/10 · Minimal
- FEMA flood zone
- X (unshaded)
- Chance of flooding over 30 yrs
- 0.0%
- Est. flood insurance / yr
- $507 – $1,088
Fire risk 4/10 · Minor
- Est. fire insurance / yr
- $604 – $1,122
Heat risk 3/10 · Minor
- Hot days now (above 88°F)
- 7 days/yr
- Hot days in 30 yrs
- 15 days/yr
Wind risk 1/10 · Minimal
- Chance of severe wind over 30 yrs
- —
Air-quality risk 6/10 · Moderate
- Unhealthy air days now
- 7 days/yr
- Unhealthy air days in 30 yrs
- 8 days/yr
Risk factors via First Street. Map © Google.
Why this score? — see what drove the C grade
The composite is a weighted blend of 9 inputs, each scored 0–100. Each bar is that input's sub-score; the figure is the points it added to the 100-point composite (weight × sub-score).
- Cash flow +17.5/30.0
- ARV discount +12.6/15.0
- DSCR +5.5/10.0
- Schools +5.1/10.0
- 1% rule +4.7/10.0
- Livability +4.2/5.0
- Condition / age +4.0/5.0
- Rent growth +3.4/5.0
- Appreciation +0.0/10.0
$245,000
🖨 Deal sheet 📄 Offer letter ✓ Due diligence
Listing remarks
Come see this lovely, well-maintained home in the desirable 55+ community of Laurel Oaks. Offering 2,050 sq ft, this spacious residence features 2 bedrooms plus a versatile den and 2 full bathrooms. Enjoy a bright, oversized eat-in kitchen with a gas cook-top, abundant cabinetry, and a convenient walk-in pantry. The separate laundry room includes a deep utility sink for added functionality. The primary suite boasts a luxurious 5-piece bath with double vanity, walk-in shower, and a large soaking tub—perfect for relaxing at the end of the day. Recent updates include a newer roof and heating/air system for peace of mind. The home is equipped with a Rain-bird sprinkler system and offers a
Key facts
- Large eat in kitchen
- Laundry room
- Deep sink
Tags
Neighborhood map
What this means for you Summary
Snapshot
- This is a 2-bed/2.0-bath manufactured listed at $245k. Condition is rated good.
Deal economics
- At list price, monthly cash flow is $190 ($2k/yr) — positive.
- The deal already cash-flows at list — no discount required.
- To meet the 1% rule (rent ≥ 1% of price), the offer needs to be $238k (2.7% below list).
- Recommended offer: $223k (9.0% below list) — sets the bar for market timing.
- Cap rate 7.2% vs local median 3.0% in Lacey — top-decile yield for the area; either an underpriced asset or a hidden risk that comps aren't pricing in. Stress-test before assuming the spread holds.
Location & tenants
- Location reads 85/100 on livability (#33 in WA, #581 nationally) — a professional / high-income tenant draw. Strengths: amenities A+, commute A+, housing A+; Watch: cost of living D+.
- North Thurston Public Schools (suburban): math 51% / reading 62% proficiency, ranked #80 of 291 in WA (top 28%) — acceptable for families but not a draw, mixed tenant base, ~2y average lease.
- Market conditions: Rents rising (+3.6%/yr); 190 active listings in the ZIP; 8 comparable units currently listed for rent nearby; rentals lingering (median 44d on market — plan ~5-8 weeks vacancy on turnover, expect pricing pressure); 62% of comp listings sitting > 30 days — soft ceiling on asking rent; solid renter incomes; 1,222 units permitted in Thurston County in 2024 (508 in 5+ unit buildings).
- This rent runs 32% of the median local income ($89k/yr) — at the standard rent-burdened threshold; future hikes will face affordability resistance.
Forward outlook
- Local home prices are declining (-3.0%/yr); year-one equity from $2k of loan paydown is wiped out by about $7k of value loss. Plan a longer hold.
- Thurston County population projected at +27% by 2050 — long-run rental-demand tailwind backs the buy-and-hold thesis.
Negotiation context
- It's been on market 117 days — a 9% lower offer ($223k) is reasonable based on typical stale-listing flexibility.
Questions for the listing agent
- It's been on market 117 days. Have you received any prior offers? Is the seller open to a 9% concession, seller financing, or rate buy-down credit?
- Why hasn't it sold? Are there any deal-killer items the seller is aware of (foundation, flood, title, zoning, code violations)?
- Is there a deadline driving the sale (1031 exchange, divorce, estate, relocation)? That informs how much negotiation room exists.
- Schools are B-rated — typically a magnet for longer-tenancy family renters. What's the average tenant stay here, and is there a school-zone premium baked into asking?
- What's the average days-on-market for RENTAL listings here right now (not sales)? A rising rental-DOM trend means longer vacancies and softer asking-rent achievability than the comps imply.
- What's the recent tenant-quality profile in this submarket — average credit score on applications, eviction rate, late-payment / NSF rate, and stable-employment percentage? A property-management company in the area should have these aggregated.
- How much new for-sale + rental construction is in the pipeline within 1–3 miles? Heavy new supply typically softens prices + rents 12–24 months out; constrained supply supports both.
Investment metrics
- 1% rule
- 0.97% ✗
- Cap rate
- 7.22%
- Cash-on-cash
- 3.32%
- DSCR
- 1.15
- GRM
- 8.6
CMA / ARV
- ARV (median comp)
- $276,088
- List price
- $245,000
- Delta
- -11.26%
- Verdict
- UNDERPRICED
- Comps
- 20 within 1.0 mi
Show comp detail 12 sales within ~0.75 mi
| Address | Dist | Beds/Ba | Sqft | Sold | Price | $/sf | Match |
|---|---|---|---|---|---|---|---|
| 8117 20th Ln SE #23 | 0.03mi | 2/2.0 | 2,050 (0%) | 11mo | $300,000 | $146 | 90 |
| 1936 Daylily Ln SE #37 | 0.11mi | 2/2.0 | 2,050 (0%) | 8mo | $294,950 | $144 | 88 |
| 8203 18th Ln SE #46 | 0.13mi | 2/2.0 | 2,050 (0%) | 8mo | $240,000 | $117 | 87 |
| 8045 18th Ln SE | 0.09mi | 3/2.0 (+1) | 1,971 (-4%) | 0mo | $245,900 | $125 | 84 |
| 8041 18th Ln SE #102 | 0.09mi | 2/2.0 | 2,036 (-1%) | 12mo | $285,000 | $140 | 84 |
| 1815 Sorrel Ln SE #119 | 0.11mi | 2/2.0 | 2,080 (+2%) | 10mo | $265,000 | $127 | 84 |
| 1820 Daylily Ln SE #42 | 0.13mi | 2/2.0 | 2,050 (0%) | 16mo | $285,000 | $139 | 80 |
| 1929 Daylily Ln SE | 0.09mi | 2/2.0 | 2,124 (+4%) | 16mo | $281,000 | $132 | 77 |
| 8205 20th Ln SE #16 | 0.08mi | 2/2.0 | 2,080 (+2%) | 21mo | $277,000 | $133 | 76 |
| 1822 Cranberry Ln SE #82 | 0.09mi | 2/2.0 | 2,240 (+9%) | 15mo | $279,900 | $125 | 68 |
| 8030 18th Ln SE #132 | 0.13mi | 3/2.0 (+1) | 1,804 (-12%) | 21mo | $269,000 | $149 | 51 |
| 8019 18th Ln SE #122 | 0.13mi | 3/2.0 (+1) | 1,760 (-14%) | 17mo | $269,000 | $153 | 51 |
Match score weights: distance 35% · size 25% · config 20% · recency 20%. Top-matched comps best support the ARV.
Projected returns pro-forma
-3.0% appreciation · 3.56% rent growth · sell at horizon
- IRR
- -10.4%
- Equity multiple
- 0.62×
- Total profit
- $-26,211
- Equity at exit
- $36,530
- IRR
- -0.3%
- Equity multiple
- 0.98×
- Total profit
- $-1,488
- Equity at exit
- $21,183
Cash invested: $68,600 (down + closing). Projections, not guarantees.
Landlord ↔ Tenant lean methodology
- Overall (STATE)
- 28 Tenant-Leaning
- State Washington
- 28 Tenant-Leaning · D+8
- County
- — inherits STATE
- City
- — inherits STATE
ZIP-level market 98503
- Rents YoY
- 3.6%
- Active inventory
- 190
- Price-to-rent
- 8.6×
Monthly cashflow live
- Estimated rent
- $2,384 high interval (Pro) →
- Mortgage (P&I)
- −$1,285
- Tax est. 1.5%
- −$306 /mo · $3,675/yr
- Insurance
- −$102
- HOA
- −$0
- Vacancy / Maint / Mgmt
- −$501
- Net cashflow
- $190
Break-even live
UW: 25.0% down · 7.5% · 30yr · 1.5% tax · 5.0% vac · 8.0% maint · 8.0% mgmt
Financing live
Cash to close
- Down payment
- $61,250
- Closing costs
- $7,350
- Reserves months
- —
- Total cash needed
- —
Loan-product check · same deal, 3 products live
Conventional
25% down · 7.5% · 30yr
- Down + closing
- —
- Monthly P&I
- —
- Monthly cashflow
- —
- DSCR
- —
- Eligible?
- —
Personal DTI + credit; lowest rate.
DSCR
20% down · 8.5% · 30yr
- Down + closing
- —
- Monthly P&I
- —
- Monthly cashflow
- —
- DSCR
- —
- Eligible?
- —
No personal income docs; deal must DSCR.
Hard money
10% down · 12.0% · 12mo
- Down + closing
- —
- Monthly P&I
- —
- Monthly cashflow
- —
- DSCR
- —
- Eligible?
- —
Short-term bridge; refi at stabilization.
Rent comps 8 comps
| Address | Beds | Baths | Sqft | Rent | $/sqft | DOM | Units | Dist |
|---|---|---|---|---|---|---|---|---|
| 8107 26th Ave SE Lacey, WA | 3.0 | 2.5 | 1594 | $2,295 | $1.44 | 43d | 1 | 0.37mi |
| 2712 Mayes Rd SE Lacey, WA | 3.0 | 2.5 | 1763 | $2,495 | $1.42 | 21d | 1 | 0.45mi |
| 2732 Hidden Springs Loop SE Unit 1 Olympia, WA | 3.0 | 2.5 | 1778 | $2,595 | $1.46 | 43d | 1 | 0.46mi |
| 8420 13th Ave SE Olympia, WA | 3.0 | 2.5 | 2164 | $2,800 | $1.29 | 43d | 1 | 0.49mi |
| 1446 Laredo Dr SE Olympia, WA | 3.0 | 3.0 | 1828 | $2,700 | $1.48 | 13d | 1 | 1.02mi |
| 7509 38th Dr SE Lacey, WA | 3.0 | 2.5 | 1800 | $2,695 | $1.50 | 43d | 1 | 1.28mi |
| 8545 Oxford Ave SE Lacey, WA | 3.0 | 2.5 | 1572 | $2,400 | $1.53 | 43d | 1 | 1.42mi |
| 7325 39th Ct SE Lacey, WA | 3.0 | 2.0 | 1676 | $2,695 | $1.61 | 21d | 1 | 1.44mi |
Listing history 15 events
-
2026-06-18days on market $245,000 Active 117 DOM
-
2026-06-17days on market $245,000 Active 116 DOM
-
2026-06-16days on market $245,000 Active 115 DOM
-
2026-06-15days on market $245,000 Active 114 DOM
-
2026-06-14days on market $245,000 Active 112 DOM
-
2026-06-13pricedays on market $245,000 Active 111 DOM
-
2026-06-10days on market $279,000 Active 109 DOM
-
2026-06-09days on market $279,000 Active 108 DOM
-
2026-06-08days on market $279,000 Active 107 DOM
-
2026-06-07days on market $279,000 Active 106 DOM
-
2026-06-03days on market $279,000 Active 102 DOM
-
2026-06-02days on market $279,000 Active 101 DOM
-
2026-05-31days on market $279,000 Active 100 DOM
-
2026-05-30days on market $279,000 Active 99 DOM
-
2026-02-20$279,000 Active
ⓘ Source: listings_history table (triggers on properties + properties_extension) + one-shot
backfill from property_details.listing_events for pre-trigger history.
Climate risk First Street
- Flood 1/10 Low FEMA zone X (unshaded) · 0% chance over 30 yrs
- Wildfire 4/10 Moderate
- Heat 3/10 Moderate 7 d/yr ≥88°F today · 15 d/yr by 30 yrs out
- Wind 1/10 Low
- Air quality 6/10 Major 7 unhealthy d/yr today · 8 by 30 yrs out
Nearby sold comps map
Loading sold comps map…
Walkable amenities ~0.75 mi
Loading nearby amenities…
Taxation est. · year 1
- Rental income
- $28,605
- − Mortgage interest
- −$13,724
- − Property taxes
- −$3,675
- − Insurance
- −$1,225
- − Repairs & maintenance
- −$2,288
- − Management
- −$2,288
- − Depreciation
- −$7,127
- Taxable loss
- −$1,723
- Est. tax savings @ 24.0%
- +$413
- After-tax cash flow
- $2,694/yr
For passive investors: Depreciation is non-cash, so a rental often shows a tax loss while cash-flowing — sheltering income. Rental losses are passive: they offset passive income freely, and up to $25,000/yr can offset ordinary (W-2) income if you actively participate and your MAGI is under $100k (phasing out to $0 by $150k); unused losses carry forward. On sale, claimed depreciation is recaptured at up to 25%, and gains may owe capital-gains tax (a 1031 exchange can defer both). Figures are a year-1 estimate at your 24.0% rate — not tax advice; consult a CPA.
Condition & rehab AI · 12 photos
This well-maintained home in the Laurel Oaks community is in good condition with no major repairs needed. It offers a spacious layout and recent updates, making it a great investment opportunity.
Value-add opportunities
- Resale Paint the exterior siding — Fresh paint can enhance the curb appeal and value of the home.
- Resale Replace the garage door — A new garage door can improve the home's curb appeal and functionality.
- Resale Clean the gutters — Clean gutters can prevent water damage and improve the home's overall appearance.
- Both Install new flooring in the living areas — New flooring can improve the home's appearance and increase its value.
- Both Install new kitchen cabinets — New kitchen cabinets can improve the home's appearance and increase its value.
- Both Install new bathroom fixtures — New bathroom fixtures can improve the home's appearance and increase its value.
- Both Install new HVAC system — A new HVAC system can improve the home's comfort and increase its value.
- Both Landscaping improvements — Landscaping improvements can enhance the home's curb appeal and increase its value.
Renovation cost estimate screening
Value-add ROI direction
- Resale Paint the exterior siding — Fresh paint can enhance the curb appeal and value of the home. ↑
- Resale Replace the garage door — A new garage door can improve the home's curb appeal and functionality. ↑
- Resale Clean the gutters — Clean gutters can prevent water damage and improve the home's overall appearance. ↑
- Both Install new flooring in the living areas — New flooring can improve the home's appearance and increase its value. ↑
- Both Install new kitchen cabinets — New kitchen cabinets can improve the home's appearance and increase its value. ↑
- Both Install new bathroom fixtures — New bathroom fixtures can improve the home's appearance and increase its value. ↑
- Both Install new HVAC system — A new HVAC system can improve the home's comfort and increase its value. ↑
- Both Landscaping improvements — Landscaping improvements can enhance the home's curb appeal and increase its value. ↑
ⓘ Cost ranges are severity-bucket heuristics (US national rule-of-thumb). Get contractor quotes + a written scope before underwriting a rehab budget.
Schools (NCES district)
- District
- North Thurston Public Schools
- NCES district ID
- 5305850
- Math proficiency
- 51% ▬ 0.00%
- Reading proficiency
- 62% ▬ 0.00%
- Median HH income
- $62,338
- Composite
- 51.09/100
- National rank
- #3798
- State rank
- #80 of 291 in WA
Livability — Lacey
- Score
- 85/100
- State rank
- #33
- US rank
- #581
Category grades
Schools grade is shown separately in the Schools card above.
Census & demographics
- County
- Thurston County · 269,345 people
- City population
- 108,850
- Metro
- Olympia-Lacey-Tumwater, WA
- Population (ZIP)
- 41,656
- Household income
- $89,002
- Rent vs Own
- Severe rent burden
- 2195.0
Population outlook (Thurston County) Hauer SSP2
- Today (2025)
- 308,239 people
- By 2030
- 326,483 · +5.9%
- By 2040
- 359,890 · +16.8%
- By 2050
- 391,800 · +27.1%
- By 2075
- 468,024 · +51.8%
- By 2100
- 519,890 · +68.7%
Race, ethnicity, and origin ACS 2023
- Neighborhood character
- Diverse neighborhood (Simpson 0.56)
- Race & ethnicity
- White 65% Two or more races 12% Hispanic / Latino 12% Asian 7% Black 5% Pacific Islander 2% Native American 1%
- Hispanic origin (detail)
- Mexican 8% Puerto Rican 1%
- Common ancestry
- Portuguese 4% Slovak 3% Lithuanian 3%
- Foreign-born
- 10% · Canada, Vietnam, South Korea
- Languages at home
- 82% English-only · Spanish 6% German/W. Germanic 3% Other Asian/Pacific 2%
Political lean MEDSL · Thurston
- 2024 margin
- Strong D (+20.4) · D 58.5% · R 38.1% · Other 3.5%
- 2008→2024 swing
- -1.3pp toward R · 2008: 21.7pp · 2024: 20.4pp
- All cycles
- 2024: D+20.4 2020: D+18.6 2016: D+15.4 2012: D+19.0 2008: D+21.7
Not yet ingested
- Civics
- —
Market trends
- HPI YoY
- ▼ -385.93%
- Current HPI
- 361.0974
- Rent YoY
- ▲ 3.56%
- Metro
- Olympia-Lacey-Tumwater, WA
- State GDP YoY
- ▲ 4.65%
- F500 in state
- 22
Industry mix (Fortune 500 HQ in WA)
| Industry | F500 HQs | Revenue |
|---|---|---|
| Retail | 2 | $269B |
|
||
| Technology / Retail | 1 | $638B |
|
||
| Technology | 1 | $245B |
|
||
| Telecommunications | 1 | $38B |
|
||
| Food / Beverage | 1 | $36B |
|
||
| Automotive / Trucks | 1 | $34B |
|
||
Price history
1 event — show timeline
- 2026-02-20 Listed $279,000 NWMLS as Distributed by MLS Grid
Cash-flow waterfall
monthlySold comps — $/sqft
last 12 mo · ≤1 miLoading sold comps…