 Multi-family
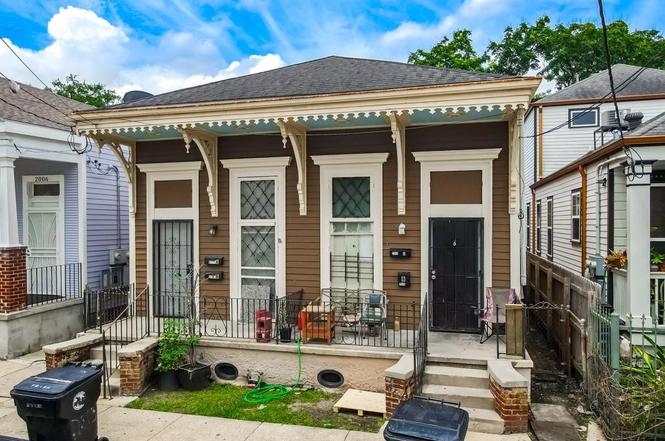
2008 10 Josephine St · New Orleans, LA
Flood risk 8/10 · Major
- FEMA flood zone
- X
- Chance of flooding over 30 yrs
- 0.75%
- Est. flood insurance / yr
- $507 – $1,088
Fire risk 1/10 · Minimal
- Est. fire insurance / yr
- $1,269 – $2,357
Heat risk 10/10 · Severe
- Hot days now (above 108°F)
- 7 days/yr
- Hot days in 30 yrs
- 21 days/yr
Wind risk 10/10 · Severe
- Chance of severe wind over 30 yrs
- 99.0%
Air-quality risk 3/10 · Minor
- Unhealthy air days now
- 3 days/yr
- Unhealthy air days in 30 yrs
- 4 days/yr
Risk factors via First Street. Map © Google.
Why this score? — see what drove the C grade
The composite is a weighted blend of 9 inputs, each scored 0–100. Each bar is that input's sub-score; the figure is the points it added to the 100-point composite (weight × sub-score).
- Cash flow +20.5/30.0
- Appreciation +10.0/10.0
- DSCR +6.5/10.0
- 1% rule +4.6/10.0
- Rent growth +4.0/5.0
- Livability +4.0/5.0
- ARV discount +3.7/15.0
- Condition / age +2.5/5.0
- Schools +1.6/10.0
$299,900
🖨 Deal sheet 📄 Offer letter ✓ Due diligence
Multi-family units
County records classify this as Multi-Family (2-4 Unit). Listing-text estimate: 1 unit. estimate disagrees with records
Listing remarks MLS
Perfect time to get the perfect place in the perfect area! Minutes from restaurants, shopping, schools, downtown, and Mardi Gras . This exquisite property offers not only a prime location but also a plenty of space on each side. ALMOST $5000 IN RENT?! DON'T MISS OUT!! The spacious living room is bathed in an abundance of natural light, creating a warm and inviting atmosphere for relaxation and entertainment. With 1 bedrooms and 1bath on each side great for long term or short term rental. CALL TODAY!
Key facts
- Built 1965
- Listed 7 days
Property features AI
Finance
- Financial info: Four total rental units; Each unit currently rented at $1,200 (actual and total rent listed for units 08-A, 08-B, 10-A, 10-B)
Exterior
- Utilities: Public water; Public sewer
- Home design: Single-story building
- Construction: Wood siding; Shingle roof; Built with raised foundation
- Exterior features: City lot; Irregular lot
Interior
- Bedrooms: Four 1-bedroom units (units 08-A, 08-B, 10-A, 10-B)
- Bathrooms: Four full bathrooms (one in each unit)
- Heating & cooling: Window unit heating; Window unit cooling
- Interior features: Average condition; Raised foundation
Neighborhood map
What this means for you Summary
Snapshot
- This is a 4-bed/3.0-bath multifamily listed at $300k.
Deal economics
- At list price, monthly cash flow is $327 ($4k/yr) — positive.
- The deal already cash-flows at list — no discount required.
- To meet the 1% rule (rent ≥ 1% of price), the offer needs to be $286k (4.5% below list).
- Recommended offer: $286k (4.5% below list) — sets the bar for 1% rule.
- Cap rate 7.9% vs local median 4.4% in New Orleans — top-decile yield for the area; either an underpriced asset or a hidden risk that comps aren't pricing in. Stress-test before assuming the spread holds.
Location & tenants
- Location reads 81/100 on livability (#3 in LA, #1,383 nationally) — a professional / high-income tenant draw. Strengths: amenities A+, commute A+, health & safety A+; Watch: crime C-, employment D.
- Orleans Parish (urban): math 11% / reading 27% proficiency, ranked #69 of 98 in LA (top 70%) — low school quality limits family demand, transient renter base, plan for 1-2y turnover; 68% free/reduced lunch — lower-income household profile, screen leases tightly.
- Market conditions: Rents rising fast (+6.0%/yr); 137 active listings in the ZIP; 40 comparable units currently listed for rent nearby; rentals at typical pace (median 24d on market — plan ~3-4 weeks tenant-placement turnaround); lower-income renter base — watch delinquency; 710 units permitted in Orleans Parish in 2024 (244 in 5+ unit buildings).
Forward outlook
- In year one you build about $32k of equity ($2k loan paydown + $30k appreciation (10.0% local appreciation)).
- Orleans County population projected at +61% by 2050 — long-run rental-demand tailwind backs the buy-and-hold thesis.
- At projected returns (10.0% appreciation + 6.0% rent growth), your $84k cash investment doubles in ~3 years — after that, you're playing with house money.
- By year 2, paydown + projected appreciation supports a ~$52k cash-out refi (75% LTV) — recoverable capital for the next deal without selling this one.
Negotiation context
- Only 7 days on market — expect competitive offers; lowballing is unlikely to land.
- 3 sale attempts since 14y ago with the ask held roughly flat each time — persistent listings suggest the price (not the market) is what's stuck; bring a comps-based counter.
- Current owner paid $20k; list at $300k implies a 1400% gain — meaningful room to come down on a strong offer.
Risks & watch-outs
- Watch-outs: flood insurance adds $66/mo.
- Climate carrying-cost: severe flood risk; severe wind risk, 99% chance of damaging wind over 30y; extreme-heat days projected 7→21/yr by 2055 (HVAC capex compounding) — expect insurance premiums to compound above CPI over the hold.
Questions for the listing agent
- Built in 1965 — when were the roof, HVAC, electrical panel, plumbing, and water heater last replaced?
- What's the actual annual flood-insurance premium (NFIP or private), and is the property in a SFHA with mandatory coverage?
- Is there a deadline driving the sale (1031 exchange, divorce, estate, relocation)? That informs how much negotiation room exists.
- What's the average days-on-market for RENTAL listings here right now (not sales)? A rising rental-DOM trend means longer vacancies and softer asking-rent achievability than the comps imply.
- What's the recent tenant-quality profile in this submarket — average credit score on applications, eviction rate, late-payment / NSF rate, and stable-employment percentage? A property-management company in the area should have these aggregated.
- How much new apartment / multifamily construction is in the pipeline within 1–3 miles? Heavy new supply (>2% of stock underway) typically softens rents 12–24 months out; light construction supports rent growth.
Investment metrics
- 1% rule
- 0.96% ✗
- Cap rate
- 7.87%
- Cash-on-cash
- 5.62%
- DSCR
- 1.25
- GRM
- 8.7
CMA / ARV
- ARV (on-the-fly)
- $276,624
- Comps found
- 11
Show comp detail 11 sales within ~0.75 mi
| Address | Dist | Beds/Ba | Sqft | Sold | Price | $/sf | Match |
|---|---|---|---|---|---|---|---|
| 2521 23 Carondelet St | 0.38mi | 4/2.5 | 1,873 (+4%) | 6mo | $490,000 | $262 | 69 |
| 2233-2235 Josephine St | 0.17mi | 4/2.0 | 1,938 (+7%) | 8mo | $159,000 | $82 | 69 |
| 2113 15 S Liberty St | 0.19mi | 4/2.0 | 1,624 (-10%) | 10mo | $228,500 | $141 | 62 |
| 2514-16 Second St | 0.42mi | 4/3.0 | 1,910 (+6%) | 12mo | $293,000 | $153 | 61 |
| 2624-2626 Jackson Ave | 0.47mi | 4/2.0 | 1,713 (-5%) | 6mo | $159,900 | $93 | 60 |
| 1809 11 Third St | 0.35mi | 4/2.0 | 1,585 (-12%) | 1mo | $260,000 | $164 | 58 |
| 1626 28 Simon Bolivar Ave | 0.19mi | 4/2.0 | 1,944 (+8%) | 23mo | $299,000 | $154 | 56 |
| 1713 15 8th St | 0.67mi | 4/2.0 | 1,750 (-3%) | 7mo | $280,000 | $160 | 54 |
| 718 20 Fourth St | 0.38mi | 4/2.0 | 1,596 (-12%) | 13mo | $270,000 | $169 | 48 |
| 2219 21 Toledano St | 0.66mi | 4/2.0 | 1,640 (-9%) | 4mo | $232,000 | $141 | 47 |
| 2721 23 First St | 0.49mi | 4/4.0 | 1,978 (+9%) | 23mo | $170,000 | $86 | 38 |
Match score weights: distance 35% · size 25% · config 20% · recency 20%. Top-matched comps best support the ARV.
Projected returns pro-forma
10.0% appreciation · 5.98% rent growth · sell at horizon
- IRR
- 28.7%
- Equity multiple
- 3.30×
- Total profit
- $192,940
- Equity at exit
- $270,174
- IRR
- 25.8%
- Equity multiple
- 7.81×
- Total profit
- $571,985
- Equity at exit
- $582,640
Cash invested: $83,972 (down + closing). Projections, not guarantees.
Landlord ↔ Tenant lean methodology
- Overall (STATE)
- 90 Strongly Landlord-Friendly
- State Louisiana
- 90 Strongly Landlord-Friendly · R+12
- County
- — inherits STATE
- City
- — inherits STATE
ZIP-level market 70113
- Rents YoY
- 6.0%
- Active inventory
- 137
- Price-to-rent
- 17.4×
Monthly cashflow live
- Estimated rent
- $2,865 high interval (Pro) →
- Mortgage (P&I)
- −$1,573
- Tax from tax record
- −$173 /mo · $2,072/yr
- Insurance
- −$125
- Flood insurance flood zone
- −$66 /mo · $798/yr
- HOA
- −$0
- Vacancy / Maint / Mgmt
- −$602
- Net cashflow
- $327
Break-even live
2-unit breakdown (identical units grouped — click to expand)
| Units | Beds | Baths | Est. rent |
|---|---|---|---|
| 2× units | 1 | 1 | $2,866 |
| #1 | 1 | 1 | $1,433 |
| #2 | 1 | 1 | $1,433 |
| Total (2 units) | $2,865 | ||
UW: 25.0% down · 7.5% · 30yr · 1.5% tax · 5.0% vac · 8.0% maint · 8.0% mgmt
Financing live
Cash to close
- Down payment
- $74,975
- Closing costs
- $8,997
- Reserves months
- —
- Total cash needed
- —
Loan-product check · same deal, 3 products live
Conventional
25% down · 7.5% · 30yr
- Down + closing
- —
- Monthly P&I
- —
- Monthly cashflow
- —
- DSCR
- —
- Eligible?
- —
Personal DTI + credit; lowest rate.
DSCR
20% down · 8.5% · 30yr
- Down + closing
- —
- Monthly P&I
- —
- Monthly cashflow
- —
- DSCR
- —
- Eligible?
- —
No personal income docs; deal must DSCR.
Hard money
10% down · 12.0% · 12mo
- Down + closing
- —
- Monthly P&I
- —
- Monthly cashflow
- —
- DSCR
- —
- Eligible?
- —
Short-term bridge; refi at stabilization.
Rent comps 40 comps
| Address | Beds | Baths | Sqft | Rent | $/sqft | DOM | Units | Dist |
|---|---|---|---|---|---|---|---|---|
| 1944 Jackson Ave New Orleans, LA | 3.0 | 2.5 | 1572 | $2,500 | $1.59 | 44d | 1 | 0.06mi |
| 2102 Josephine St New Orleans, LA | 4.0 | 2.0 | 1286 | $2,100 | $1.63 | 24d | 1 | 0.07mi |
| 1915 Philip St New Orleans, LA | 3.0 | 1.5 | 1300 | $2,450 | $1.88 | 24d | 1 | 0.14mi |
| 2301 Dryades St New Orleans, LA | 3.0 | 3.0 | 2070 | $3,000 | $1.45 | 3d | 1 | 0.17mi |
| 2403 S Saratoga St New Orleans, LA | 3.0 | 2.5 | 1600 | $2,500 | $1.56 | 24d | 1 | 0.19mi |
| 2123 S Liberty St Unit 2125 New Orleans, LA | 3.0 | 2.0 | 1500 | $2,100 | $1.40 | 3d | 1 | 0.22mi |
| 2231 S Liberty St New Orleans, LA | 3.0 | 3.5 | 1752 | $2,000 | $1.14 | 17d | 1 | 0.23mi |
| 2107 Fourth St New Orleans, LA | 3.0 | 1.0 | 1292 | $1,775 | $1.37 | 17d | 1 | 0.35mi |
| 2318 Martin Luther King Junior Blvd New Orleans, LA | 3.0 | 2.0 | 1400 | $1,700 | $1.21 | 24d | 1 | 0.35mi |
| 2625 Baronne St Unit 1 New Orleans, LA | 3.0 | 1.5 | 2100 | $2,600 | $1.24 | 44d | 1 | 0.37mi |
| 2717 Loyola Ave New Orleans, LA | 3.0 | 2.0 | 1250 | $2,300 | $1.84 | 2d | 1 | 0.40mi |
| 2717 Loyola Ave New Orleans, LA | 3.0 | 2.0 | 1232 | $2,300 | $1.87 | 24d | 1 | 0.40mi |
| 2733 Danneel St New Orleans, LA | 4.0 | 2.0 | 1350 | $1,775 | $1.31 | 24d | 1 | 0.40mi |
| 2713 Baronne St New Orleans, LA | 3.0 | 2.5 | 1600 | $2,300 | $1.44 | 24d | 1 | 0.41mi |
| 1525 Melpomene St Unit Na New Orleans, LA | 3.0 | 1.5 | 1700 | $4,000 | $2.35 | 44d | 1 | 0.51mi |
| 1201 Baronne St #1 New Orleans, LA | 3.0 | 2.5 | 1892 | $2,700 | $1.43 | 17d | 1 | 0.51mi |
| 2608 Magnolia St New Orleans, LA | 4.0 | 2.5 | 1950 | $3,200 | $1.64 | 44d | 1 | 0.53mi |
| 2722 Martin L King Bl New Orleans, LA | 3.0 | 2.5 | 1350 | $1,800 | $1.33 | 24d | 1 | 0.53mi |
| 1407 Magnolia St New Orleans, LA | 3.0 | 2.0 | 1824 | $1,500 | $0.82 | 24d | 1 | 0.55mi |
| 1306 Felicity St Unit C New Orleans, LA | 3.0 | 3.0 | 1500 | $2,450 | $1.63 | 17d | 1 | 0.56mi |
| 1204 Saint Andrew St Unit 1204 New Orleans, LA | 3.0 | 2.0 | 1600 | $2,300 | $1.44 | 24d | 1 | 0.61mi |
| 3212 Danneel St New Orleans, LA | 3.0 | 2.0 | 1945 | $2,000 | $1.03 | 24d | 1 | 0.65mi |
| 822 Howard Ave Unit 1272354P New Orleans, LA | 1.0–5.0 | 1.0–4.0 | 1749 | $9,250 | $5.29 | 2d | 3 | 0.67mi |
| 875 O'Keefe Ave #301 New Orleans, LA | 3.0 | 2.5 | 2029 | $4,500 | $2.22 | 17d | 1 | 0.70mi |
| 2028 Magazine St New Orleans, LA | 3.0 | 2.5 | 2600 | $7,000 | $2.69 | 17d | 1 | 0.71mi |
| 1410 6th St New Orleans, LA | 3.0 | 2.0 | 1400 | $5,000 | $3.57 | 16d | 1 | 0.71mi |
| 1021 1st St New Orleans, LA | 4.0 | 4.0 | 2621 | $4,500 | $1.72 | 3d | 1 | 0.75mi |
| 803 Baronne St New Orleans, LA | 3.0 | 2.0 | 1791 | $3,525 | $1.97 | 3d | 1 | 0.78mi |
| 2608 Magazine St New Orleans, LA | 3.0 | 2.0 | 1844 | $3,100 | $1.68 | 44d | 1 | 0.78mi |
| 2628 Magazine St New Orleans, LA | 3.0 | 2.0 | 1400 | $2,650 | $1.89 | 17d | 1 | 0.79mi |
| 3120 Second St New Orleans, LA | 3.0 | 3.0 | 1256 | $2,050 | $1.63 | 24d | 1 | 0.79mi |
| 921 Race St Unit C New Orleans, LA | 3.0 | 2.0 | 1570 | $3,000 | $1.91 | 10d | 1 | 0.80mi |
| 3429 Baronne St New Orleans, LA | 3.0 | 2.5 | 1600 | $2,500 | $1.56 | 44d | 1 | 0.82mi |
| 1000 Girod St Ph 2 New Orleans, LA | 3.0 | 3.5 | 2008 | $4,800 | $2.39 | 44d | 1 | 0.83mi |
| 1111 6th St New Orleans, LA | 3.0 | 1.5 | 1425 | $2,995 | $2.10 | 44d | 1 | 0.84mi |
| 1420 Annunciation St New Orleans, LA | 1.0–3.0 | 1.0–2.0 | 1019 | $2,390 | $2.35 | 2d | 78 | 0.86mi |
| 2539 Amelia St New Orleans, LA | 3.0 | 2.0 | 1296 | $2,200 | $1.70 | 24d | 1 | 0.86mi |
| 913 Felicity St New Orleans, LA | 1.0–3.0 | 1.0–2.0 | 999 | $1,850 | $1.85 | 24d | 1 | 0.86mi |
| 2833 S Derbigny St New Orleans, LA | 3.0 | 2.0 | 1500 | $1,795 | $1.20 | 24d | 1 | 0.87mi |
| 2502 Laurel St New Orleans, LA | 3.0 | 2.0 | 1333 | $2,300 | $1.73 | 17d | 1 | 0.88mi |
Listing history 6 events
-
2026-06-18days on market $299,900 Active 7 DOM
-
2026-06-17days on market $299,900 Active 6 DOM
-
2026-06-16days on market $299,900 Active 5 DOM
-
2026-06-15days on market $299,900 Active 4 DOM
-
2026-06-13remarks 504-char remark
-
2026-06-13$299,900 Active 2 DOM
ⓘ Source: listings_history table (triggers on properties + properties_extension) + one-shot
backfill from property_details.listing_events for pre-trigger history.
Tax reassessment forecast LA · Resets to sale price
- Current annual tax
- $2,072 · $173/mo
- Projected year-2 tax
- $2,072 · $173/mo
- Expected delta
- $0/yr ($0/mo · 0.0%)
ⓘ Screening estimate from a state-policy table — verify with the county assessor before closing.
Climate risk First Street
- Flood 8/10 Severe FEMA zone X · 75% chance over 30 yrs
- Wildfire 1/10 Low
- Heat 10/10 Extreme 7 d/yr ≥108°F today · 21 d/yr by 30 yrs out
- Wind 10/10 Extreme 99% chance of damaging wind over 30 yrs
- Air quality 3/10 Moderate 3 unhealthy d/yr today · 4 by 30 yrs out
Nearby sold comps map
Loading sold comps map…
Walkable amenities ~0.75 mi
Loading nearby amenities…
Taxation est. · year 1
- Rental income
- $34,380
- − Mortgage interest
- −$16,799
- − Property taxes
- −$2,072
- − Insurance
- −$2,297
- − Repairs & maintenance
- −$2,750
- − Management
- −$2,750
- − Depreciation
- −$8,724
- Taxable loss
- −$1,013
- Est. tax savings @ 24.0%
- +$243
- After-tax cash flow
- $4,162/yr
For passive investors: Depreciation is non-cash, so a rental often shows a tax loss while cash-flowing — sheltering income. Rental losses are passive: they offset passive income freely, and up to $25,000/yr can offset ordinary (W-2) income if you actively participate and your MAGI is under $100k (phasing out to $0 by $150k); unused losses carry forward. On sale, claimed depreciation is recaptured at up to 25%, and gains may owe capital-gains tax (a 1031 exchange can defer both). Figures are a year-1 estimate at your 24.0% rate — not tax advice; consult a CPA.
Schools (NCES district)
- District
- Orleans Parish
- NCES district ID
- 2201170
- Math proficiency
- 11% ▼ -52.00%
- Reading proficiency
- 27% ▼ -46.00%
- Median HH income
- $37,011
- Composite
- 15.78/100
- National rank
- #9271
- State rank
- #69 of 98 in LA
Livability — New Orleans
- Score
- 81/100
- State rank
- #3
- US rank
- #1383
Category grades
Schools grade is shown separately in the Schools card above.
Census & demographics
- Census place
- New Orleans, LA
- County
- Orleans Parish · 338,817 people
- City population
- 338,817
- Metro
- New Orleans-Metairie, LA
- Population (ZIP)
- 9,387
- Household income
- $39,333
- Rent vs Own
- Severe rent burden
- 714.0
Population outlook (Orleans County) Hauer SSP2
- Today (2025)
- 513,025 people
- By 2030
- 575,781 · +12.2%
- By 2040
- 700,174 · +36.5%
- By 2050
- 826,541 · +61.1%
- By 2075
- 1,123,374 · +119.0%
- By 2100
- 1,355,609 · +164.2%
Race, ethnicity, and origin ACS 2023
- Neighborhood character
- Diverse neighborhood (Simpson 0.57)
- Race & ethnicity
- Black 61% White 20% Hispanic / Latino 13% Two or more races 11% Asian 2%
- Hispanic origin (detail)
- Mexican 2%
- Common ancestry
- Lithuanian 2% Portuguese 1% Slovak 1%
- Foreign-born
- 13% · Canada, Vietnam, China
- Languages at home
- 86% English-only · Spanish 11% Other Indo-European 1% Vietnamese 1%
Political lean MEDSL · Orleans
- 2024 margin
- Solid D (+67.0) · D 82.2% · R 15.2% · Other 2.7%
- 2008→2024 swing
- +6.7pp toward D · 2008: 60.3pp · 2024: 67.0pp
- All cycles
- 2024: D+67.0 2020: D+68.2 2016: D+66.2 2012: D+62.5 2008: D+60.3
Not yet ingested
- Civics
- —
Market trends
- HPI YoY
- ▲ 65.92%
- Current HPI
- 229.3968
- Rent YoY
- ▲ 5.98%
- Metro
- New Orleans-Metairie, LA
- State GDP YoY
- ▲ 3.29%
- F500 in state
- 10
Industry mix (Fortune 500 HQ in LA)
| Industry | F500 HQs | Revenue |
|---|---|---|
| Telecommunications | 2 | $23B |
|
||
| Utilities | 1 | $12B |
|
||
| Wholesale / Distribution | 1 | $5B |
|
||
| Advertising | 1 | $2B |
|
||
Price history
+1399.5% since first listed4 events — show timeline
- 2026-06-11 Listed $299,900 AcadianaMLS
- 2026-06-11 Listed $299,900 GSREIN
- 2012-10-01 Listed $45,000 AcadianaMLS
- 1986-05-30 Sold (Public Records) $20,000 Public Records
Property tax history
+3.6%/yrLatest (2026): $2,072 · +1.1% YoY. Source: county tax records.
Cash-flow waterfall
monthlySold comps — $/sqft
last 12 mo · ≤1 miLoading sold comps…